
 ?Mathematical formulae have been encoded as MathML and are displayed in this HTML version using MathJax in order to improve their display. Uncheck the box to turn MathJax off. This feature requires Javascript. Click on a formula to zoom.
ABSTRACT
Using data for Dutch municipal elections between 1998 and 2018, this paper finds two dominant trends: more political fragmentation and increasing electoral success of independent local parties. The relative size of local parties in the council rises from 25% in 1998 to 37% in 2018 and the relative share of their aldermen from 21% to 32%. When understanding the increasing share of local parties, the number of inhabitants, regional diversity, the share of elderly people and the election year dummies are important explanations. Looking at the changes after large decentralisations, also indications for a welfare hypothesis were found, if fixed effects are included. Following an empirical approach for AfD in local elections in German state of Lower Saxony, the impact of the anti-establishment Freedom Party on contesting local parties was analysed and this influence turned out to be small. This also gives an indication that Dutch local parties are becoming more established.
1 Introduction
In the Netherlands, independent local parties (ILP) are on the rise and are becoming an important political player in the (executive) board at the municipal level. ILP run in municipal elections but do not participate in elections at the national level. In the literature, there is an increasing attention for this phenomenon (Boogers and Voerman Citation2010; Otjes Citation2018, Citation2020a for the Netherlands; Kjaer and Elklit Citation2010 for Denmark; Dodeigne, Close, and Teuber Citation2021 for Belgium; Åberg and Ahlberger Citation2015 for Sweden; Jankowski, Juen, and Tepe Citation2020 for the German state of Lower Saxony; Ennser-Jedenastik and Hansen Citation2013 for Austria). In the literature several explanations are emerging. Boogers and Voerman (Citation2010) stress the anti-establishment branch of these parties as they intend to expose the poor responsiveness of national party branches. Another explanation is amalgamation as when smaller municipalities are merged into larger municipalities, independent local parties can be formed to defend the interests of the villages amalgamated (Otjes Citation2018). The Netherlands can be an interesting case to study this phenomenon as mergers are still ongoing with a limited number every year, which is quite different from other European countries as Belgium where a big reform took place in 1976 reducing the number of municipalities to a quarter (De Ceuninck et al. Citation2010). Moreover, there is also a trend in the literature indicating spatial differentiation of the support for local parties. Åberg and Ahlberger (Citation2015) show that this differentiation is obvious in the Netherlands and noticeable in Sweden. In addition, Ennser-Jedenastik and Hansen (Citation2013) point out this spatial differentiation for Austria especially for cross-border regions with Switzerland. Dodeigne, Close, and Teuber (Citation2021) highlight the negative effect of a municipality’s size on the localised local party system. Jankowski, Juen, and Tepe (Citation2020) show that in municipalities of the German state of Lower Saxony Independent Local Lists received in 2016 15.6% of the votes. Moreover, they also show that in the election of 2016 in which the anti-establishment party AFD contested the election, the vote share of ILL decreased by more than three percentage points.
The recent history of increasing independent local parties is intertwined with the increasing political fragmentation and decreasing power. This fragmentation is due to the decline of the main established political parties in the Netherlands, but also due to an increasing number of local parties. In the literature the consequences of this fragmentation on different political decisions are studied. Let us focus on the Netherlands and Belgium as these countries have a parliamentary system consisting of the local council (the legislative body) and the board of aldermen (the executive body). Goeminne, Geys, and Smolders (Citation2008) show for Flanders that fragmented municipalities (measured by the number of parties in the board) are more optimistic in projecting tax revenues and therefore will have larger deficits. Recently, Vanneste and Goeminne (Citation2020) calculated for municipalities in Flanders the power (measured by the share of seats of the government in the council) and show that deficits decrease with decreasing power. Gradus and Dijkgraaf (Citation2019) found for the Netherlands evidence that political fragmentation of the council decreases the ability to introduce unit-based waste pricing. Waste pricing is important to reduce environmental unfriendly unsorted waste and to stimulate recycling. As waste pricing is political disputable and has some adverse effects as illegal dumping and administrative costs less fragmented municipalities are more eager to introduce it. Studying Dutch waste collection, Gradus and Budding (Citation2020) found some indications that privatisation is more difficult under highly fragmented local councils. Remarkably, they also noticed some evidence that political fragmentation of the board increases the ability to outsource (only at 10%-level), the opposite of what was found by Warner and Hefetz (Citation2002) for US outsourcing. All in all, the literature gives modest indications that fragmented municipalities delay important decisions.
Based on data for municipal elections in 1998, 2002, 2006, 2010, 2014 and 2018, we find evidence for more electoral success of ILP and increased political fragmentation as emerging trends for both council seats and aldermen. Using additional data, we explain these trends and build on the literature by testing different hypotheses. For instance, one of the main assumptions is that ILP can focus especially on local issues and, therefore, we investigate a welfare hypothesis as a large decentralisation of Dutch central social policy towards municipalities took place in 2007 and 2015. Åberg and Ahlberger (Citation2015) explored such a hypothesis of a relation between the rise of local parties and a larger local welfare state in Sweden and they found some evidence for it. Otjes (Citation2018, Citation2020a) suggests a supply-side-based explanation for the increasing success of Dutch ILP. Specifically, it is argued that ILP perform better in small municipalities in which the number of established parties competing in the local election is rather small. Although the number of small municipalities is decreasing due to mergers, this can be offset by forming ILP to defend the interests of the villages amalgamated into these municipalities (Otjes Citation2018).
The paper is structured as follows. Section 2 describes the data for municipal elections between 1998 and 2018. In section 2.1 we describe the (relative) number of seats of different political parties in local councils. We pay special attention to local parties. In section 2.2 we give the (relative) number of aldermen and their political affiliation. As Dutch councils have become more fragmented in recent decades (see Gradus and Dijkgraaf Citation2019), we present two fragmentation indexes in section 2.3. In addition, power which is the share of seats of the government in the council, is calculated as well (see Vanneste and Goeminne Citation2020). In section 3 we present different models and their estimation. Some concluding remarks and topics for future research are offered in section 4.
2 Dutch municipal elections 1998–2018
In the Netherlands there are three layers of government (central, provincial and local). Subnational governments consist of 12 provinces and (in 2018) 380 municipalities. Local governments are seen as the most visible level of government and they have considerable autonomy regarding public service provision (Gradus and Budding Citation2020). Due to mergers, the number of municipalities has decreased from 548 in 1998 to 355 in 2019. Saarimaa and Tukiainen (Citation2016) point out the political consequences of Finnish mergers for local elections and they find that voters have preferences for premerger local representation in the next election. In recent decades, various public responsibilities, such as home care for the elderly and disabled, have been transferred from central to local government. At present, the importance of local social services has increased significantly. Currently, municipalities have a budget of about 7% of gross domestic product (GDP) and 20% of government spending. With over 40,000 inhabitants on average, Dutch municipalities are relatively large compared with most other European countries (Bel et al. Citation2010; De Ceuninck et al. Citation2010).
2.1 The municipal councils
Municipal councils are elected every 4 years. In principle, elections in all municipalities are held on the same day in March (with exceptions for municipalities that have recently been merged or are expected to be merged soon). The electoral system is based on list proportional representation with no threshold other than the natural threshold due to council size. Political parties are responsible for these lists. Normally, lists are presented in accordance with the number of votes in the past election; new political parties are displayed in a random order. For new political parties it is easy to participate in an election as they only have to be supported by some voters (in this municipality) and a deposit should be secured. As Otjes (Citation2018) points out this makes the Dutch system relatively open to the formation of new and independent local parties.Footnote1 The minimum number of votes necessary for the first seat is equal to the total number of votes divided by the number of seats (see also ).
Table 1. Relationship between inhabitants and number of seats and threshold (%).
The number of seats varies between 9 (for municipalities with less than 3,001 inhabitants) and 45 (for municipalities with more than 200,001 inhabitants). In , the relationship between the number of inhabitants of a municipality and the council size is illustrated. Due to mergers, the total number of seats of local councils has decreased from 10,129 in 1998 to 7,924 in 2018.
In , the threshold due to council size is given, ranging from 2% for large cities with 45 seats (Amsterdam, Rotterdam, The Hague, Utrecht and since 2018 Almere and Groningen) and 11% for small municipalities.
National parties are defined as parties that are represented in the National Parliament, local parties are not.Footnote2 After the 2017 National Election, there were 13 parties: Social Democrats (PvdA), Conservative Liberals (VVD), Christian Democrats (CDA), Progressive Liberals (D66), Green Left (GL), Socialist Party (SP), Christian Union (CU), Reformed Political Party (SGP), Freedom Party (PVV), Footnote3 Party for Animals (PvdD),Footnote4 Party for Elderly (50+)4, Party for Allochthones (DENK)4 and Forum for Democracy (FvD)4. Data about these political characteristics (seats and aldermen) in the election years 1998, 2002, 2006, 2010, 2014 and 2018 were collected from the Gids Gemeentebesturen (Guide to Municipal Boards), which is published by the Vereniging van Nederlandse Gemeenten (Association of Dutch Municipalities).Footnote5
In , the size of different parties as a percentage of their seats in total number of seats in every election year is given. Sometimes, a combination of political parties ran together in the election. In such a case the number of seats is divided equally between these parties.Footnote6
Table 2. Relative size of different parties in number of seats.
The main established parties in the Netherlands are the Christian Democrats (CDA), Conservative Liberals (VVD) and Social Democrats (PvdA), although the total size of these parties has dropped dramatically from 60% in 1998 to 38% in 2018. On the contrary, the size of local parties has increased substantially from 25% in 1998 to 37% in 2018. The SGP and CUFootnote7 are (traditional) Protestant parties and their size increased slightly between 1998 and 2018. The Progressive Liberals (D66) and Green Left (GL) also increased their size, although in the last election the Progressive Liberals lost seats to especially Green Left in many cities as this is their main battle ground. The number of seats for the Socialistic Party (SP) increased to a peak of 4.2% in 2014, although this is less than in the national elections. In the 2017 election the SP got 9.3% of the seats in the National Parliament. The main reason is that the SP only ran with a list in a limited number of municipalities. shows the percentage of municipalities in which a specific political party is represented in the municipal council for each year in the period 1998–2018.
Table 3. Political parties represented in municipal council.
The SP is now present in somewhat more than 30% of Dutch municipalities. However, this differs from the CDA and other main established parties VVD and PvdA as they were elected in almost all municipalities. Also, other parties were more represented over time as is showing. In 2006, there was a drop for D66, and this election gave a bad result for this party as also is showing.
In the literature, there is a growing attention for right-wing populist parties (i.e., Otjes Citation2020b). On Dutch local level, these parties are still small. Forum for Democracy (FvD) is active since 2018 and has only 3 seats in the capital Amsterdam.Footnote8 Recently, two of three councillors have left this party to establish a new party. More stable is the populist and anti-Islamic Freedom Party (PVV) of Geert Wilders, which participate in some local elections since 2010. In the 2010 and 2014 election, the PVV only had seats in the cities of The Hague and Almere, but on a national level the PVV got 15.4% of the votes in the 2010 elections and 10.1% in the 2012 elections. In 2018, the PVV had a list in 30 municipalities and 75 seats in municipal councils but no aldermen. In section 3.2. in line with Jankowski, Juen, and Tepe (Citation2020), we compare the performance of ILP in these 30 municipalities in which PVV competed with those municipalities in which PVV did not compete.
2.2 Board of aldermen
After every local election, the members of the council negotiate the number of aldermen and their political affiliation. The board of mayor and aldermen is responsible for preparation and execution of policies. The mayor is appointed by Central Government and his/her executive power is limited and therefore we only discuss the board of aldermen.Footnote9 In principle, aldermen are appointed for a period that lasts until new municipal elections, although in a limited number of municipalities aldermen and their affiliations change during this period. So, on principle, they are appointed for 4 years. However, no information on earlier step down is available in the data we have. A municipality has ample power to increase the number of aldermen. For example, the largest city Amsterdam has had six to eight aldermen in 1998–2018.Footnote10 Since 2014, due to increasing fragmentation the current number is eight. Since the 2018 election with a very fragmented council, Rotterdam has the maximum with 10 aldermen.Footnote11
In the relative number of aldermen per political party is shown. The developments in this table are comparable with those in . The relative number of aldermen in the main established parties dropped substantially and the number of local parties has increased substantially between 1998 and 2018. It is well-known from the literature on political issues that there can be a distinction between general political preferences as expressed by the voters (represented by the share of seats of each political party on the municipal council) and those of the ruling parties (shown in our analysis by the aldermen) (Elinder and Jordahl Citation2013). A method of analysing this is to subtract the relative number of seats in the municipal council from the relative number of aldermen (see ).
Table 4. Relative number of aldermen.
Table 5. Difference between relative size of seats and aldermen.
In all elections, the difference between seats and aldermen is large for local parties (between 4.0% and 9.4%). Therefore, there is some evidence that local parties are more non-conformists than most other national parties. Of note, for local parties as they increase over time this difference stays more or less the same (with exception for 2006). This can be an indication that the non-conformist’s position of these local parties has decreased. Another indication for the decrease of this non-conformist’s position is that the share of municipalities with at least one alderman from local parties is rising from 46% in 1998 to 75% in 2018. For the more conformist CDA, there are consistently over time more aldermen than seats. For other parties such as VVD, CU and SGP generally speaking a similar effect has occurred, although it is nearly always smaller than for the CDA. The contrary is true for the SP, which has an anti-establishment orientation. Interestingly, for PvdA the large negative sign indicating relative more aldermen changed to become small and even a positive in 2014. Therefore, its position as ruling party with relatively many aldermen has changed dramatically after recent elections.
2.3 Fragmentation of the council and board and power
We have calculated two fragmentation indexes. Firstly, we measured fragmentation by the (absolute) number of political parties in the board. Secondly, we included the relative size of parties. In allowing for differences in the relative size of parties, the effective number of political parties can be calculated (see Mueller Citation2003, 273). As a formula:
where xi is the share of the seats (or board members) of i-th party (listed normally ordered in size) in a municipality. In political science this is often called the Laakso–Taagepera index.
In , for every election in our dataset the absolute and the effective number of political parties in the council in the years of elections is illustrated.
Figure 1. Absolute and effective number of political parties in council.
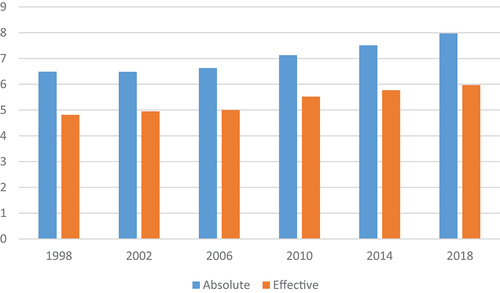
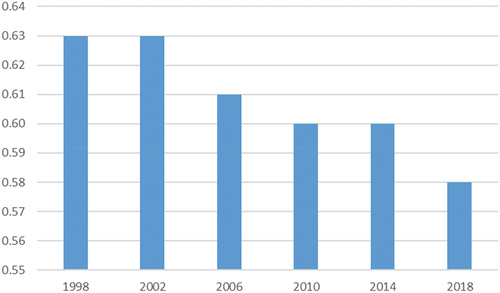
This shows the increasing Dutch political fragmentation in recent decades. The effective number of political parties increased from 4.8 in 1998 to just under 6 in 2018. In addition, the absolute number of political parties increased from 6.5 in 1998 to 8 in 2018. Overall, fragmentation increased steadily between 1998 and 2018. We also describe the power of the government, measured as its share of seats in the council. After the election aldermen are chosen and they normally should get at least 50% of the council seats. Moreover, a powerful majority is also more capable of confronting the challenges presented by different interest groups (Vanneste and Goeminne Citation2020). In , the power of Dutch coalitions is shown. On average, the power of Dutch municipalities decreased from 63% in 1998 to 58% in 2018.Footnote12
Figure 2. Average power of coalitions in Dutch municipalities.
The increase of fragmentation or decrease of power is due to the erosion of the main established parties as shown in paragraph 2.1, but also due to the increasing number of local parties. Thus, not only the size of the local political parties in the council has increased (see ), but also the number of local parties in one council. In , the percentage of municipalities with a specific number of local parties is given.
Table 6. Share of municipalities with number of local parties.
On average, the number of local political parties per municipality increased from 1.75 in 1998 to 2.50 in 2018. In 1998, 17% of Dutch municipalities did not have a local party, in 2018 this decreased to 2%. The percentage of municipalities with one local party also decreased from 34% in 1998 to 21% in 2018. On the contrary, the percentage of municipalities with two, three or four local parties increased from, respectively, 26, thirteen, and 5 in 1998 to 30, twenty-seven, and 13 in 2018. So, especially the number of municipalities with three and four local parties increased largely between 1998 and 2018.
On average, the local party share is 30.6%. In , this number is split between different population size of municipalities and over time.
Table 7. Share local political parties in municipal council.
From this table, two trends emerge. First, the share of local parties is larger in small and medium-sized municipalities. Second, the share of local parties increases over time (although the 2006 election seems to be an exception). In the next paragraph we explain the relative number of seats for local parties and the number of aldermen by different hypotheses. contains the descriptive statistics.
Table 8. Descriptive statistics.
The number of observations where all variables are available is 1,941 for local parties. As we have no lag in our estimations, we have additional observations available, and we estimate with 2,468 observations.
3. How to explain the increasing share of local parties?
3.1 How to explain the share of local parties?
An important explanation according to Otjes (Citation2018) and Dodeigne, Close, and Teuber (Citation2021) is the supply-side hypothesis. The underlying idea is that voters who prefer national parties that do not run in the municipal elections in their municipality are more likely to vote for a local party. This hypothesis can be tested by including the number of inhabitants as also the threshold is depending on this (see also ). We expect a negative sign for it. To test for nonlinear effects, the squared number of inhabitants is included as well. In addition, by comparing Sweden and the Netherlands Åberg and Ahlberger (Citation2015) note the spatial differentiation of voting for local lists in certain regions (the regional hypothesis). Ennser-Jedenastik and Hansen (Citation2013) find indications for cross-regional variation in the size of local parties in Austria, especially in Tyrol and Vorarlberg. In order to analyse this effect for the Netherlands, we included province dummies and we expect that certain provinces in the Netherlands, particularly Drenthe, Friesland, Limburg and Noord-Brabant,Footnote13 stand out. In addition, as we expect local parties more active in rural areas, population density is included as well, and a negative sign is predicted.
Moreover, we include merger as an independent variable. Otjes (Citation2018) suggests that when smaller municipalities were merged into larger municipalities in the Netherlands, independent local parties were formed to defend the interests of the villages amalgamated into this new municipality (merger hypothesis). To test this, we take a dummy variable MERGER if a municipality has been amalgamated during the last 5 years. Therefore, we expect a positive sign of the amalgamation variable. Åberg and Ahlberger (Citation2015) indicate that in Sweden extensive welfare institutions are largely implemented by the municipalities and indicate that the rise of local lists is most likely related to the welfare state challenges of the past 40 years. In the Netherlands decentralisation and also the related cost-saving measures are of more recent date. In 1994, transport and facility care for disabled persons have been decentralised to Dutch municipalities. The decentralised budget was at that time 320 million euros. In 2007, domestic care for elderly and disabled persons was decentralised as well. This amounted for 1.2 billion euros. Together with transport and facility care this domestic care was placed in the Social Support Act. Importantly, in 2015, a large decentralisation of three government tasks in the social service domain to Dutch municipalities (taking up 18 billion euros in annual government spending) was carried out. By including a dummy for election years, we can get some indication for a welfare hypothesis. We expect a positive sign and an increase in time as the importance of this hypothesis seems to increase over time. In addition, the pension issue has been debated strongly in the Netherlands and on a national and on a local level, there are pensioners’ parties (Otjes Citation2018). By incorporating a variable for the share of elderly people in the municipality and we expect it will be positive (elderly hypothesis).Footnote14 Finally, we also investigate the relation between ILP and fragmentation. However, an increase in the share of local parties does mechanically increase the extent of fragmentation, so we include fragmentation of the council and the board of the previous election. We could expect a negative sign if the fragmentation increases and power decreases as the decision-making power diminishes, and therefore local parties may be less attractive. However, the literature on this issue is still emerging and there are other indications as well. Therefore, we are unable to specify a sign for the hypothesis concerning political fragmentation (fragmentation hypothesis). To sum up, the following model will be estimatedFootnote15:
where ILP is the relative size of local parties, INH is the number of inhabitants, ELDERLY is the share of elderly people (above 65 years), DPj is a dummy for different Dutch provinces,
POPD is the population density, DMERG is a dummy with one if a merger did take in recent years (5 years before), EYi is a set of dummies for the election years (with 2002 as benchmark), FRAGC and FRAGB the fragmentation index for the council and the board in election-year t-1 and POWER is the government share in the council in election-year t-1.
contains estimates with White cross-section standard errors and covariance (d.f. corrected). In the second column EquationEquation (2)(2)
(2) is estimated.
Table 9. Estimation results local parties (% of total seats): without and with fixed effects.
The results in seem in accordance with most hypotheses. For the supply-side hypothesis, there is strong evidence as all two inhabitants’ variables are significant (at the 1% level). The smaller the municipality the larger the share of local parties, although it is not a linear effect. Note that the (local) minimum of this function is 400,000 and after this size, the effect increases again. As we have only a few observations of cities with more inhabitants than 400,000, the evidence of the decreasing effect is sounder. Interestingly, the share of elderly people is significant (at 1% level) and positive, so that municipalities with more elder people have larger independent local parties. Also, for the regional hypothesis, there is evidence. For the provinces Noord-Brabant and Limburg the estimation of the dummy is large with 0.19 and 0.18 and significant (at 1% level). For Friesland and Noord-Holland this is smaller with 0.06 and 0.02, but still significant. Interestingly, the provinces Groningen and Zeeland have a negative dummy (against the benchmark Zuid-HollandFootnote16). In addition, population density is significant (at 1% level) and a negative sign is found, so that rural areas have more local parties. For the merger-hypothesis, there is no evidence. The dummy for the election year 2006 is strongly significant and negative, whereas the dummy for 2010 is also negative but only weakly significant. In 2006, there was among other things a highly politicised media coverage after the 2005 national referenda on the EU constitution.Footnote17 The dummies for 2010 and 2014 are both weakly significant and positive. In addition, we have checked for other local characteristics, such as ethnicity, income (per inhabitant) and the level of unemployment. In a separate analysis we did not found significant effects.Footnote18 Finally, the fragmentation variables and the power variable are not significant.
When ILP is estimated, it is nearly impossible to have explicit variables for all relevant differences, as these are often not observable. The solution is to correct for municipal fixed effects. In the third column of , we include therefore municipal fixed effects in the estimation of EquationEquation (2)(2)
(2) . It could be reasoned that fixed effects are to be preferred in the first place; however, we think that estimations without fixed effects shed more light on some exogenous variables, such as the number of inhabitants, elderly people, population density and provincial dummies. With municipal fixed-effects dummies for provinces are no longer possible and necessary. There are some interesting differences if fixed effects are included. First it should be noted that for population density and the share of elderly people the significant effect disappears when fixed effects are calculated. Therefore, the situation in the single municipality seems to be an important factor. For inhabitants we get still a linear negative effect (at 1%-level), although the quadratic term disappears. With respect to the election year dummies we get stronger results than without fixed effects. In addition, for 2014 and 2018 there is now a positive and significant effect. For 2010 we do not find a statistically significant result. Thus, for the welfare hypothesis there is some evidence as both dummies are significant (against the benchmark 2002) and increasing after the decentralisation of 2007. Of course, this is only a proxy, but nevertheless it is interesting that these year dummies become larger after the decentralisations took place in the Netherlands. Interestingly, we get a significant and positive result for fragmentation of the council and the board. If the fragmentation of the council or the board in the past was increasing, the share of ILP is increasing. These are interesting results and we leave it as topic for future research to further explore it. Also, the power variable is significant with a negative sign. In addition, estimation with fixed effects is necessary to get significant results for the fragmentation and power variables, while estimation without fixed effects sheds more lights on other exogenous variables. Thus, a combination of the two gives the most information.
3.2 Impact of anti-establishment party PVV on the electoral success of ILP?
Drawing on a recent contribution for the German federal state of Lower Saxony (LS), we elaborate in this section whether there is an impact of the anti-establishment party PVV on the electoral success of ILP (Jankowski, Juen, and Tepe Citation2020). In the German state of LS, independent local lists (ILL) are increasingly successful and received 15.6% of votes in 2016. In 2016 the AfD had not only become a successful party in Germany, but it had also transformed into a populist radical-right party with strong anti-establishment attitudes. Jankowski, Juen, and Tepe (Citation2020) argue that the rise of anti-establishment parties, especially the rise of populist radical-right parties, potentially harms the electoral success of ILL. Moreover, the AfD competed in 88 of 398 municipalities in LS, which is 28.9%. Like us, Jankowski, Juen, and Tepe (Citation2020) have data on several elections in 1996, 2001, 2006, 2011 and 2016 as local elections take place in every 5 years in the German state of LS. Importantly, the case of local elections in LS allows for a robust analysis and shows that for 2016, in which the populist anti-establishment party AfD contested the election, the vote share of ILL decreased by more than three percentage points. For the Netherlands we did a similar experiment. In 2018 it was the first time that the PVV is contested in a substantial number of Dutch municipalities (30). As in Jankowski, Juen, and Tepe (Citation2020), a difference-to-difference method can be used to estimate the treatment effect of how the entrance of the PVV to Dutch local elections affects the electoral success of ILP. Jankowski, Juen, and Tepe (Citation2020) found strong effects and argues that both German ILP and AfD attract voters that are dissatisfied with established parties. Although the Dutch size of ILP is substantially larger than the German size, it is still interesting to test whether such a treatment effect for contesting anti-establishment parties is present on the share of ILP. Whereas Jankowski, Juen, and Tepe (Citation2020) had to deal with missing values for ILP as not all German municipalities have local lists, in our case we have only 189 of 2468 observations where ILP are missing and in such a case we treat them as zero.
Therefore, the following model as in Jankowski, Juen, and Tepe (Citation2020) will be estimated:
where DPVV a dummy with one if PVV competes in municipality i. For other variables see EquationEquation (2)(2)
(2) . The benchmark for the election year dummy is now 1998.
contains the difference-in-difference estimations for EquationEquation (3)(3)
(3) .
Table 10. Estimation results local parties (% of total seats): effect PVV.
First, we observe a negative treatment effect of PVV and the sign is as expected. However, this effect is not statistically significant. This is a different result than in Jankowski, Juen, and Tepe (Citation2020). One reason for this could be that the Dutch ILP’s are already more established than German ILP’s in LS. Second, for inhabitants square we do not find a significant effect anymore. However, if only inhabitants and no square is included, we still have a significant and negative effect.Footnote19 For the year dummies we found a significant effect for 2010, 2014 and 2018.
However, Jankowski, Juen, and Tepe (Citation2020) argue that these effects could be observed for other parties as well. In fact, it is plausible that when a new party gains votes under PR, that the vote share of the other parties has to decrease. Therefore, in order to compare the substantial effect size of the AfD on the electoral success on ILL, they run the same analysis with regard to the electoral success of other established parties. Particularly the conservative CDU witnessed a decrease in its electoral success by 2.5 percentage points, although this is still relatively small as the CDU received an average vote share of 40.7% in 2011. Therefore, we run the same analysis as in EquationEquation (3)(3)
(3) with the three main established parties CDA, VVD and PvdA. The results are displayed in .
Table 11. Estimation results PVV on three other parties.
Finally, the results in indicate that the presence of the PVV did affect the electoral success negatively of CDA and especially PvdA, but not of VVD. This effect is statistically significant and 1% for CDA and 3% for PvdA. Thus, the effect on local parties is not very different from that of the established parties CDA and PvdA.
4 Conclusions and discussion
Every 4 years an election takes place for all Dutch municipalities. Based on data between 1998 and 2018, two trends are emerging. Firstly, the percentage of local parties (in number of seats in local councils) has increased substantially from 25% in 1998 to 37% in 2018. If we look at the share of municipalities with at least one alderman from local parties, this is increasing from 46% in 1998 to 75% in 2018. This gives an indication that the non-conformist’s or protest attitude of this group, which is suggested by Boogers and Voerman (Citation2010), has become smaller. Secondly, political fragmentation of the council has increased. Measured by the effective number of political parties, it increased from 4.8 in 1998 to just under 6 in 2018 and measured by the absolute number of political parties from 6.3 in 1998 to just under 8 in 2018. In addition, power which is the share of seats of the government in the council decreased from 63% in 1998 to 58% in 2018.
We try to explain the share of local parties based on a number of hypotheses. We found evidence for a supply-side hypothesis. The underlying idea is that the smaller the municipality, the higher the share of local parties (Dodeigne, Close, and Teuber Citation2021). Regional diversity seems also an important explanation as we found evidence for more local parties in e.g., Noord-Brabant and Limburg. This is in line with Ennser-Jedenastik and Hansen (Citation2013) for Voralberg and Tirol in Austria. Moreover, there is some evidence that municipalities with a larger share of elderly people have larger local parties. As the Netherlands has this phenomenon on national level since 1994, pensioner parties are also active on a local level and in some municipalities they play an important role. In line with the marginalised people mobilisation hypothesis by Verba and Nie (Citation1972), elderly people seem to be mobilised. We leave this also a topic for future research. If fixed effects are included, the relation between local parties and inhabitants become linear and we found some indication for a time effect or a welfare hypothesis as there is a large effect for years after decentralisations. Further research is needed whether this can be linked to decentralisation of the Dutch welfare state in 2007 and 2015. Remarkably, we found that if the fragmentation of the council or the board in the past was increasing, the share of ILP is increasing. However, the relation between fragmentation and the share of local parties is still a challenging puzzle as we only get if fixed effects are included, and we encourage further research on it.
Moreover, the relation between the impact of the rise of anti-establishment parties and localism is studied in more detail by investigating if this rise ‘leaves space for independent local parties’. The populistic and anti-immigration Freedom Party did not contest municipal elections until 2010 and only ran in two municipalities in 2010 and 2014. However, based on 2018 elections where the Party of Freedom contests in 29 municipalities and by using the difference-in-difference method of Jankowski, Juen, and Tepe (Citation2020) we found that there is smaller support for the impact of PVV on success of Dutch ILP’s this than in Germany. This is also an indication that Dutch ILP’s become more established. Interestingly, there is more support that the presence of the PVV did especially affect the electoral decline of PvdA.
There are many avenues to explore for future research. First, the implications of political fragmentation of municipal councils and board should be discussed furthermore. Overall, the literature indicates that fragmented councils are less willing to take tough decisions (Goeminne, Geys, and Smolders Citation2008; Gradus and Dijkgraaf Citation2019; Gradus and Budding Citation2020), although this needs further investigation. Second, it would be interesting to use the scores on the item concerning general party positioning on the left-right dimension of the Chapel Hill Expert Survey Trend questionnaire and link this to the local councils (see Bakker et al. Citation2015 for CHES methodology). Third, it is important to study local parties and its consequences further. Almost 50% of Dutch municipalities have three or more local parties. Unfortunately, we only have aggregate information. Therefore, it would be interesting to know more about the structure of these local parties and, for example, whether they have membership-based politics (see, for example, Van Biezen and Poguntke Citation2014). Fourth, in testing localism we only have a proxy for the welfare hypothesis effect measured by election year dummy. Perhaps an enquiry can be helpful to understand this phenomenon further. Fifth, based on voter intentions, Otjes (Citation2018) shows that a significant part of voters after a merger motivates to vote for an independent local party. However, as we have only aggregate information, we did not find such an effect in the Netherlands. Therefore, a more detailed analysis can be helpful to understand Dutch mergers and we leave this as a topic for future research as well.
Disclosure statement
No potential conflict of interest was reported by the author(s).
Additional information
Notes on contributors
Raymond Gradus
Raymond Gradus is Professor of Public Economics and Administration in the School of Business and Economics at the Vrije Universiteit Amsterdam, the Netherlands. He is also a fellow of Tinbergen Institute, Netspar (Network for Studies on Pensions, Aging and Retirement) and Chairman of the Committees for Financial Supervision of the Dutch Antilles. His research interests are public administration, local government, environmental policy and social security.
Elbert Dijkgraaf
Elbert Dijkgraaf is a professor at the Erasmus School of Economics and a fellow of the Tinbergen Institute at Erasmus University, Rotterdam, the Netherlands. His research investigates empirical economics, competition, regulation, and environmental policy, with a focus on network sectors (the waste, water, energy and care markets), agricultural economics, education and environmental issues. He has published widely and is the owner of Dijkgraaf Strategisch Advies.
Tjerk Budding
Tjerk Budding is Director of the postgraduate programme for certified public controllers in the School of Business and Economics at the Vrije Universiteit Amsterdam, the Netherlands, where he researches local government, public sector accounting, outsourcing, and e-government. He is co-author, with Guiseppe Grossi and Tobjorn Tagesson of Public Sector Accounting, Routledge, 2014, and has published in journals including Management Accounting Research, International Public Management Journal and Government Information Quarterly.
Notes
1. In this paper, we do not distinguish between local and regional parties as for example the provincially active Frisian National Party (Fryske Nasjonale Partij, FNP). All provincially active parties are registered as local parties. It should be noted that regional parties do not play an important role in provincial elections as local parties. In the last election for Provinces (i.e., March 2019) regional parties have seats in Friesland (4), Limburg (2), Zeeland (2), Groningen (5), Brabant (1), and Drenthe (1), which represent only 2.6% of total provincial seats.
2. Some local parties ran under the banner ‘Leefbaar’ (Liveable), but without forming a national organisation. In 2002 Leefbaar Nederland had two seats in the National Parliament. However, this party did not have formal ties to the independent local parties (Otjes Citation2018).
3. As these parties are running only in the municipal election of 2010–2018, we did not take them into account in . It should be noted that their size is relatively small, and these parties have no aldermen. In 2010, the PvdD got one seat in six municipalities (Amsterdam, The Hague, Leiden, Apeldoorn, Groningen and Buren). The total seats for PvdD increased slightly to 10 in 2014 and 30 (or 0.4%) in 2018, so this party is small on a local level contrasting to the National Parliament with 3.2% of the seats in 2017.
4. As these parties are running only in the municipal election of 2018, we did not take them into account in . It should be noted that their size is relatively small (50+: 34, FvD: 3 and DENK: 21 and only 50+ has one aldermen). In December 2020, two of three FvD’s councillors left this party to establish a new party.
5. Due to availability issues, we used the guides who were published in the years 2002 (showing the political composition as of September, 2001) for election 1998 (VNG, Citation2002), 2004 (id., October 2003) for election 2002 (VNG, Citation2004), 2009 (id. October, 2008) for election 2006 (VNG, Citation2009), 2012 (id. September, 2011) for election 2010 (VNG, Citation2012), 2016 (id. January 2016) for election 2014 (VNG, Citation2016) and 2018 (id. July, 2018) as well as 2020 (id. February, 2020) for election 2018 (VNG, Citation2020).
6. For example, in a lot of municipalities there is a combination between both Protestant parties, CU and SGP.
7. In 1998, the CU consisted of two parties RPF and GPV. In 2000, these parties merged into CU.
8. In the spring of 2019, FvD led by Thierry Baudet, became the largest party in the Dutch Senate, which is indirectly elected by provincial councils. These were elected in 20 March 2019 and FvD became the largest party in these elections. In the Senate election on 27 May 2019, the Conservative Liberals (VVD) and the FvD both won twelve seats (Otjes Citation2020b).
9. Currently, the mayor is still appointed by the King as part of the Dutch constitution. However, in due course this will be done by the Central Government as to emphasise the independence of this figure.
10. PvdA has always been the most important party in the board of aldermen in Amsterdam (1998: 3 aldermen, 2002: 3, 2006: 4 and 2010: 3). However, this has changed in 2014 with no representation in the board of Aldermen. Currently, GL is the largest party and PvdA has two aldermen.
11. Not all aldermen have a fulltime appointment. For example, in Rotterdam, CU/SGP with only one seat in the council has one aldermen with 0.4 FTE working time.
12. In some municipalities the power is less than a half. This will be the case if an aldermen seat is vacant or a governing party does have a seat in the local government.
13. Interestingly, Noord-Brabant was the scene of extensive territorial adjustments in terms of mergers of municipalities in the late 1990s (Åberg and Ahlberger (Citation2015, 815)).
14. Interestingly, a pensioner party started in 1994 on a national level when the Christian Democrats proposed to cut public pension. In the general elections of 1994, a pensioner party AOV/Unie 55+ got 7 seats (i.e., 5%). After some internal disputes, this party disappeared in the general election in 1998. Interestingly, on a local level also such initiatives started. In some municipalities, AOV is still active.
15. We also checked for multicollinearity of Equationequation (2)(2)
(2) and (Equation3
(3)
(3) ). As the correlation coefficients of all variables are less than 0.7 and 92% is less than 0.4 no predictors indicate the presence of multicollinearity. The correlations can be obtained upon request.
16. We selected this province as the benchmark as this province includes the city of The Hague in which Dutch parliament and also most other central government entities are located.
17. In 2005, there was an advising referendum on the new constitution of EU. 61,5% was against and the cabinet Balkenende IV want to ignore the outcome and become among other thing very unpopular at time.
18. Those estimations are available on request. Unfortunately, we do not have data for education.
19. Those estimations are available on request. Unfortunately, we do not have data for education.
References
- Åberg, M., and C. Ahlberger. 2015. “Local Candidate Lists: Historical Artefacts or A Novel Phenomenon? A Research Note.” Party Politics 21 (5): 813–820. doi:10.1177/1354068813499870.
- Bakker, R., C. De Vries, E. Edwards, L. Hooghe, S. Jolly, G. Marks, J. Polk, J. Rovny, M. Steenbergen, and M. A. Vachudova. 2015. “Measuring Party Positions in Europe: The Chapel Hill Expert Survey Trend File, 1999–2010.” Party Politics 21 (1): 143–152. doi:10.1177/1354068812462931.
- Bel, G., E. Dijkgraaf, X. Fageda, and R. Gradus. 2010. “Similar Problems, Different Solutions: Comparing Refuse Collection in the Netherlands and Spain.” Public Administration 88 (2): 479–496. doi:10.1111/j.1467-9299.2009.01808.x.
- Boogers, M., and G. Voerman. 2010. “Independent Local Political Parties in the Netherlands.” Local Government Studies 36 (1): 75–90. doi:10.1080/03003930903435807.
- De Ceuninck, K., H. Reynaert, K. Steyvers, and T. Valcke. 2010. “Municipal Amalgamations in the Low Countries: Same Problems, Different Solutions.” Local Government Studies 36 (6): 803–822. doi:10.1080/03003930.2010.522082.
- Dodeigne, J., C. Close, and F. Teuber. 2021. “Nationalisation of Local Party Systems in Belgium (1976-2018): The Combined Effects of Municipality Size and Parliamentary Parties’ Dominance.” Local Government Studies 47 (1): 100–125. doi:10.1080/03003930.2020.1802251.
- Elinder, M., and H. Jordahl. 2013. “Political Preferences and Public Sector Outsourcing.” European Journal of Political Economy 30 (1): 43–57. doi:10.1016/j.ejpoleco.2013.01.003.
- Ennser-Jedenastik, L., and M. E. Hansen. 2013. “The Contingent Nature of Local Party System Nationalisation: The Case of Austria 1985-2009.” Local Government Studies 39 (6): 777–791. doi:10.1080/03003930.2012.675328.
- Goeminne, S., B. Geys, and C. Smolders. 2008. “Political Fragmentation and Projected Tax Revenues - Evidence from Flemish Municipalities.” International Tax and Public Finance 15 (3): 297–315. doi:10.1007/s10797-007-9021-4.
- Gradus, R. H. J. M., and G. T. Budding. 2020. “Political and Institutional Explanations for Increasing Re-municipalization.” Urban Affairs Review 56 (2): 538–564. doi:10.1177/1078087418787907.
- Gradus, R. H. J. M., and E. Dijkgraaf. 2019. “Poorer and Less Political Fragmented Dutch Municipalities Take Tighter Waste Reductions Decisions.” Waste Management 88 (3): 328–336. doi:10.1016/j.wasman.2019.03.059.
- Jankowski, M., C.-M. Juen, and M. Tepe. 2020. “The Impact of Anti-establishment Parties on the Electoral Success of Independent Local Lists: Evidence from Germany.” Party Politics 135406882096543. doi:10.1177/1354068820965430.
- Kjaer, U., and J. Elklit. 2010. “Local Party System Nationalisation: Does Municipal Size Matter?” Local Government Studies 36 (3): 425–444. doi:10.1080/03003931003730451.
- Mueller, D. C. 2003. Public Choice III. Cambridge: Cambridge University Press.
- Otjes, S. 2018. “Pushed by National Politics or Pulled by Localism? Voting for Independent Local Parties in the Netherlands.” Local Government Studies 44 (3): 305–328. doi:10.1080/03003930.2018.1427072.
- Otjes, S. 2020a. “Going Local. Voting for Independent Local Parties in the Netherlands 1986-2010.” Local Government Studies 46 (1): 91–115. doi:10.1080/03003930.2019.1619555.
- Otjes, S. 2020b. “The Fight on the Right: What Drives Voting for the Dutch Freedom Party and for the Forum for Democracy?” Acta Politica. doi:10.1057/s41269-020-00150-y.
- Saarimaa, T., and J. Tukiainen. 2016. “Local Representation and Strategic Voting: Evidence from Electoral Boundary Reforms.” European Journal of Political Economy 41: 31–45. doi:10.1016/j.ejpoleco.2015.10.008.
- Van Biezen, I., and T. Poguntke. 2014. “The Decline of Membership-based Politics.” Party Politics 20 (2): 205–216. doi:10.1177/1354068813519969.
- Vanneste, S., and S. Goeminne. 2020. “The Role of the past in Public Policy: Empirical Evidence of the Long-term Effect of past Policy and Politics on the Local Budget Balance.” Economics of Governance 21 (1): 75–99. doi:10.1007/s10101-019-00232-4.
- Verba, S., and N. H. Nie. 1972. Participation in America. Political Democracy and Social Equality. Chicago: Chicago Press.
- VNG. 2002. Gids Gemeentebesturen 2002. Den Haag: VNG Uitgeverij.
- VNG. 2004. Gids Gemeentebesturen 2004. Den Haag: VNG Uitgeverij.
- VNG. 2009. Gids Gemeentebesturen 2009. Den Haag: VNG Uitgeverij.
- VNG. 2012. Gids Gemeentebesturen 2012. Den Haag: SDU.
- VNG. 2016. Gids Gemeentebesturen 2016. Den Haag: SDU.
- VNG. 2020. Gids Gemeentebesturen 2020. Den Haag: SDU.
- Warner, M. E., and A. Hefetz. 2002. “Applying Market Solutions to Public Services: An Assessment of Efficiency, Equity, and Voice.” Urban Affairs Review 38 (1): 70–89. doi:10.1177/107808702401097808.