
 ?Mathematical formulae have been encoded as MathML and are displayed in this HTML version using MathJax in order to improve their display. Uncheck the box to turn MathJax off. This feature requires Javascript. Click on a formula to zoom.
ABSTRACT
Countries reap numerous benefits from maintaining rural communities. Those advantages, however, come at a cost. We examine the additional costs of public services in rural areas in Israel by considering sparsity, population size and density, distances, and socio-economic status of rural residents. We quantify the effect of these factors and find that the cost of providing public services in rural areas is 39% greater than in cities. Density and other structural differences contribute 20% to the added cost. Economies of scale contribute 8.2%; peripheral location 4.2%; and socio-economic status 2.6%. We show that population density moderates the relation between population size and per-resident expenditure. We also demonstrate that more rural villages in an area increases per-resident expenditure and moderates the relation between distance and expenditure. We discuss policy implications and suggest contributions to a deeper understanding of the rural public economy.
1. Introduction
Countries gain significant utility from populating their rural space: enhanced food production, border security, control of long-distance roads, access to rare-earth minerals, governance in the country fringes, and recreational space for urban residents. Central governments may subsidise the rural space if the utility received is positive. The additional cost of public services can serve as a proxy to reveal the country’s preferences for having rural villages.
Studies suggest that the cost of public services in rural regions is higher than in urban areas (Bradley and Barratt Citation2003; Hall Citation2010; Hindle and Annibal Citation2011; Kitchen and Slack Citation2006; Ranasinghe Citation2011; Warner Citation2006). However, no clear quantification of the cost differential exists. Small population size, low population density, sparsity of villages, and large distances may explain discrepancies in cost. A few studies show a link between density and population size, indicating that density influences economies of scale (Drew, Kortt, and Dollery Citation2014; Holcombe and Williams Citation2009; Ladd Citation1992). However, most of those studies do not quantify the cost disparities between rural and urban areas nor the relation between density and size. Those that do, quantify only a small subset of the overall services provided by local governments (LGs) (Carruthers and Ulfarsson Citation2003; Tran, Kortt, and Dollery Citation2019).
Studying the sub-national government structure in Israel, Shani et al. (Citation2023) suggest that a mezzanine tier of clustered rural villages is more efficient than LGs operating in each village, and compare it to inter-municipal cooperation and mergers. This study extends the concept by comparing cities and the optimal structure of rural LGs, revealing the additional cost of providing public services in Israel’s rural space. The current study offers three contributions to the literature: (i) quantification of the cost differentials for provision of public services in rural and urban areas; (ii) elucidation of the factors contributing to added costs, including the moderating effect of number of villages in a service cluster on the relation between distance from a service location and the cost of providing public servicesFootnote1; and (iii) quantification of the moderating effect of population density on economies of scale.
The paper is organised as follows. First, there is a literature review and a presentation of the theoretical background for the economic differences between rural and urban areas. Next is a discussion of economies of scale and density, the moderation theory of density, and the influence of the number of rural villages on per-resident cost. We then describe the institutional background of LG in Israel’s urban and rural spaces, followed by research methods and data. Finally, our empirical results then lead to theoretical and policy implications.
2. Literature review
Our study relates two strands in the literature: (i) studies exploring the economic differences between rural and urban jurisdictions, and (ii) studies exploring economies of scale and density, analysing the effects of smaller populations and lower population density.
2.1. Economic differences between rural and urban areas
Although research on economic differences between rural and urban areas is limited, most studies agree that the cost of public services is higher in rural than in urban jurisdictions (Bradley and Barratt Citation2003; Hall Citation2010; Hindle and Annibal Citation2011; Kitchen and Slack Citation2006; Ranasinghe Citation2011; Warner Citation2006). The term ‘rural cost penalty’ refers to the distinctive characteristics of rurality that influence the cost and how rural services are delivered. Most papers, however, do not quantify the cost differentials of the provision of public services in rural and urban areas; only a smaller number quantify the cost differentials of a few services. Cossu and Masi (Citation2013) study waste management costs and indicate that the weighted unit cost of waste collection in rural areas is 40% greater than in towns.Footnote2 Kitchen and Slack (Citation2006) indicate that the expenditure in Yukon, Canada, is 41% higher than in the rest of the country. More comprehensive studies conducted in the UK that analyse the drivers of service costs in rural areas (Hindle, Spollen, and Dixon Citation2004; Ranasinghe Citation2011, Citation2014) attempt to quantify the additional costs. Their underlying assumption is that expenditure on public services is a reasonable proxy for residents’ requests for public services comparable to those found in the cities and that there are no budgetary restrictions. However, those studies rely on surveys, whose results are indicative rather than systematic. LGs in rural areas respond to the ‘rural cost penalty’ by reducing the level of services (Asthana and Halliday Citation2004; G. Hindle and Hindle Citation2010). Therefore, the assumption underlying the above studies may be untenable and create selection bias. We address selection bias by comparing cities and regional councils whose efficiency in the provision of public services is similar.
2.2. Economies of scale and density
The literature on the influence of LG size on expenditures discusses two primary characteristics – the number of residents and population density. The studies find that the number of residents impacts LG expenditure due to economies of scale. Some of these studies show a U-shaped relationship between population size and per-resident expenditure. The production cost function is U-shaped if public service delivery costs have fixed components. ‘This is why it is commonly expected that per-capita costs will be higher for the smallest local government’ (Solé-Ollé and Bosch Citation2005, 350).
Solé-Ollé and Bosch (Citation2005) find economies of scale for smaller LGs while diseconomies of scale for larger cities. Similarly, Buljan et al. (Citation2022), Hortas-Rico and Rios (Citation2020), and Drew et al. (Citation2016) find a U-shaped relationship with an optimal minimum varying between 15,000 to 98,000 residents.
As LGs provide a wide range of public services, different economic behaviours may be associated with different services since each service has its characteristics (Callanan, Murphy, and Quinlivan Citation2014). Andrews and Boyne (Citation2009), and Bikker and van der Linde (Citation2016) describe economies of scale of administrative expenditures. Studying the effect of population size on property tax collection, Avellaneda and Gomes (Citation2015) find a positive correlation, indicating economies of scale.
On the other hand, a few studies find limited support for economies of scale (Callanan, Murphy, and Quinlivan Citation2014; Fellows, Dollery, and Tran Citation2022; Holcombe and Williams Citation2009). Holcombe and Williams (Citation2009) conclude that ‘constant returns to scale best characterize the relationship between per capita municipal government expenditures and total population served by the government’.
Comparing amalgamated LGs to non-amalgamated ones, Reingewertz (Citation2012) finds lower per-resident expenditure, indicating economies of scale. Similarly, Allers and Geertsema (Citation2016), Blesse and Baskaran (Citation2016), and Cobban (Citation2019) find economies of scale in the administrative expenditures. On the other hand, Tavares (Citation2018) concludes that while administrative expenditures exhibit economies of scale, they tend to disappear when controlling for other factors.
To save costs and improve services, local governments have the option to cooperate with neighbouring municipalities to benefit from economies of scale. In many countries, such cooperation is voluntary, both in terms of participation and the specific services offered. For rural local governments, inter-municipal cooperation is an important alternative to reduce service costs (Bel and Warner Citation2015; Hefetz, Warner, and Vigoda-Gadot Citation2012; Warner Citation2006).
Fellows, Dollery, and Marques (Citation2022) describe five studies that find economies of scale and three that do not. The meta-analysis of Gómez-Reino et al. (Citation2023) affirms the prevalence of moderate economies of scale.
From the surveyed studies, it is apparent that definitive findings of economies of scale do not exist. This calls for enlarging the knowledge database with additional studies conducted in different settings. The large span in optimal size of LG leads us to conclude that the optimal size may depend on a multitude of unique characteristics of each location and may also vary in time.
A few studies indicate a correlation between population density and per-resident expenditure, namely, the economies of density (Ladd Citation1992; Libertun de Duren and Guerrero Compeán Citation2016; Mattson Citation2021). Other studies show that per-resident costs rise in low-density areas of urban sprawl (Carruthers and Ulfarsson Citation2003; Fregolent and Tonin Citation2016; Hortas-Rico and Solé-Ollé Citation2010).
A few papers assert a correlation between population size and density and, therefore, stratify LGs into density groups (Bernardelli, Kortt, and Dollery Citation2020; Drew, Kortt, and Dollery Citation2014; Holcombe and Williams Citation2009; Tran, Kortt, and Dollery Citation2019). According to these studies, economies of scale decrease after stratifying LGs based on density. Such patterns indicate that density is a moderator of economies of scale. These findings lead us to study the moderating effect of density rather than stratifying LGs into different groups according to density, as low density is typical in rural villages.
3. Theoretical background
3.1. Economies of scale
The fundamental argument for economies of scale is derived from the theory of the firm (Ferguson Citation1969), which discusses the ‘return to scale’ of production. Limitations on inputs (e.g., specialised labour and land) result in diminished marginal returns after a certain point, which leads to decreased returns of scale or increased cost of production. This leads to U-shaped product unit costs.
Providing public services to residents of rural villages must overcome remoteness from urban service centres, which incur a ‘rural cost penalty’. Some of the services LGs provide also require fixed costs. Once the number of residents exceeds that limitation, the LG needs to invest in expanding or building new facilities.
A few papers argue that population density influences per-resident costs (Holcombe and Williams Citation2008) since the costs of providing services in dense areas are spread over a larger population. Therefore, denser areas exhibit lower per-resident costs. Hence, we deduce that density moderates the relationship between population size and cost of services, such that in denser LGs, economies of scale flatten. Such phenomenon is important to our study, as rural LGs tend to exhibit much lower density than urban areas.
3.2. Contributors to the cost of public services in rural areas
Longer distances, sparsity of villages, and low population density all contribute to higher costs of public services. Even if population density remains low, clustering rural villages into a few service centres produces economies of scale since the distance service providers must travel decreases (Kitchen and Slack Citation2006; Ramsland and Dollery Citation2011; Shani, Reingewertz, and Vigoda-Gadot Citation2023). The more villages there are in a service cluster, the shorter the service provider’s average travel distance. Therefore, we deduce that the number of villages moderates the relationship between distance to the service centre and per-resident cost of services, such that the more villages in a cluster, the more the per-resident cost flattens as a function of distance.
4. Institutional background
The structure of LGs in Israel combines unitary cities and dual-tier regional councils, which cluster villages in the lower tier. In Israel in 2021, there were 79 cities, 122 towns, and 54 regional councils. Regional councils incorporate 1,016 lower-tier villages. Regional councils have the same powers and provide local services as cities, except they may delegate some of their authority to villages, usually communal local services (Hananel and Fishman Citation2017; Rasis and Applebaum Citation2009). Appendix B describes the lists of services LGs provide. In Israel’s polarised society, Jewish and Arab towns have different economic capabilities, with Arab towns suffering from a lack of resources, predominately industrial and commerce areas (Ben-Bassat and Dahan Citation2009; Razin Citation1998).Footnote3 Likewise, ultra-orthodox Jewish cities lack resources. Hence, the 85 Arab and seven ultra-orthodox towns were excluded from this study due to their low per-resident income.Footnote4
Regional councils cluster between three and 64 rural villages (not including towns) being their ‘distributed municipality’ to achieve economies of scale and scope (Shani, Reingewertz, and Vigoda-Gadot Citation2023). The Israel Central Bureau of Statistics (ICBS) periodically publishes a Periphery Index, a weighted average of potential accessibility and proximity to the Tel Aviv municipal district. The combined density and Periphery Index fit the OECD (Citation2016) classification of rurality, which confirms that regional councils in Israel encompass rural areas.
Although mandated by law, we can look at regional councils as long-term cooperation relationships, resembling inter-municipal cooperation, and providing both cost saving and higher quality of services (Aldag and Warner Citation2018; Aldag, Warner, and Bel Citation2020; Shani, Reingewertz, and Vigoda-Gadot Citation2023). However, regional councils differ in that they are a statutory local government tier. Villages within regional councils cannot opt out and govern themselves independently as with regular local governments.
presents descriptive statistics of the variables used in this study for cities and regional councils, indicating that, on average, cities have more residents; they span smaller jurisdictional areas and exhibit higher population densities. Residents in regional councils are younger and have higher socio-economic standing.Footnote5
Table 1. Descriptive statistics of Israeli cities and regional councils in 2021.
The last two years of the data, 2020 and 2021, include the influence of COVID-19 pandemic. The central government reimbursed all local governments for the decline in their local tax collection. On average, the central government reimbursed about 15% of the tax revenue, where the difference between cities and regional councils is small (around 0.4% and insignificant). Therefore, the influence of the COVID-19 pandemic was similar on both cities and regional councils.
5. Method
The empirical analysis consists of four steps. In the first step, we compare the average efficiency of services provided in regional councils and cities using Stochastic Frontier Analysis (SFA). This not only establishes a baseline for comparison, but also mitigates selection bias. In the second step, we compare service income and expenditure in regional councils and cities to obtain differentials in the cost of public services. In the third step, we explore the moderation effect of density. In the fourth step, we quantify the contribution of LGs characteristics to per-resident expenditures and study the moderation effect of the number of villages. The outcome of all those steps reveals the influence of the characteristics of LGs on per-resident expenditures in general and on the difference between rural and urban LGs in particular.
5.1. SFA
A similarity in the efficiency of LGs in the provision of public services implies similar organisational and fiscal competence. LGs control the efficiency and quality of their services (Geys, Heinemann, and Kalb Citation2013). In this study, we compare the efficiency levels of cities and rural LGs in current expenditures and two primary services: education and sanitation.
There are significant differences between rural and urban LGs. In the first step, we compare the efficiency frontier of regional councils and cities. Shani et al. (Citation2023) show that the dual-tier structure is more efficient than the unitary structure. Therefore, comparing regional councils to cities presents the lower bound of the cost difference.
The literature offers two methods for analysing the efficiency of LGs as decision-making units (DMU): nonparametric and parametric. We use the parametric SFA to differentiate between inefficiency and noise and as it is less sensitive to outliers (Geys, Heinemann, and Kalb Citation2013).Footnote6
5.2. Comparing rural and urban LGs
In the second step, we analyse and compare cities’ and regional councils’ income and expenditure statements using panel regressions per Specifications (1) - (2) (for clarity, we omit the year and LG subscripts):
where Ec is the per-resident budget expenditure in NIS of component c (adjusted to the price index for 2020), population is the number of residents in thousands, city is a dummy variable that takes the value of one if the LG is a city, density is the inhabited residential density per Km2.Footnote7 Controls include the socio-economic and the periphery indices, the ratio of students, and the percentage of senior citizens. We use Specifications (1) - (3) in a pooled panel mode, as the controls either do not change over time or the changes are insignificant. We also calculate Specification (1) in a fixed-effects mode and with ln(E) at the left-hand side to verify the robustness that economies of scale occur with population size.
β2 of Specification (1) captures the difference between cities and regional councils. If β2 < 0, the service expenditures in regional councils are greater than those of cities. If β2 = 0 or is insignificant, expenditures or income are assumed to be equal. β1 of Specifications (1) - (2) captures the economies of scale, and β2 of Specification (2) the economies of density, ceteris paribus. We have both specifications because we find a high correlation between the city dummy and ln(density) (0.94).
When calculating Specification (1) for total current expenditure, β2 indicates the total differential in expenditure between rural and urban areas, revealing the preference for maintaining rural jurisdictions.
Due to their correlation, previous studies indicate that population size may influence density in calculating economies of scale. Our dataset shows a correlation of 0.49 between density and size. We assume that density moderates the relation between population size and service per-resident expenditure. In the third step, we use Specification (3) to analyse the moderating effect of density.
In the fourth step, we analyse each group of LGs to quantify the characteristics that influence their per-resident cost of services.
5.3. Data
Each year, the Ministry of the Interior (MoI) and the ICBS publish the financial statements of all LGs.Footnote8 In addition, the Ministry of Education (MoE) publishes an annual overall financial statement for educational services. We compile these data sources into one panel from 2014 to 2021.
5.4. Data sorting
Any comparison of urban and rural areas has to control for differences in the standard of living and socio-economic standing. In many countries, these characteristics are lower in rural areas than in cities. However, those differences may also dictate a different set of services or different quality of services, which creates selection bias.
Among the Jewish population in Israel, most of these differences are negligible, as the standard of living in regional councils is similar to that of cities (). Per-resident income is also comparable ().
We eliminate two LGs as outliers: the capital (Jerusalem), which exhibits low income, mainly due to the large number of ultra-orthodox and Arab residents, and the Tamar regional council, which has only about 1,600 residents but a very high income: more than 12 times the average of the other LGs.
6. Results
6.1. Comparison of the efficiency of rural and urban LGs
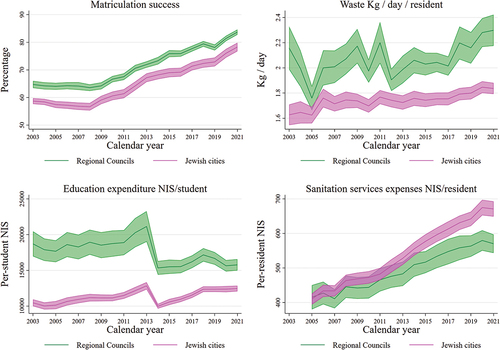
Using success in matriculation exams and per-resident daily waste collection as our measures of the output of LGs, we first examine how the average of these variables behaves over time. shows that success in matriculation exams and per-student expenditure are higher in regional councils. Per-resident waste collection is higher in regional councils. While this may be attributed to the agricultural activity in rural areas, sanitation expenditures in cities remain higher.
Figure 1. Success in matriculation exams and per resident daily waste collection expenditures.
Two questions emerge from the statistics presented in : (a) What is the relative efficiency of providing education and sanitation services, and (b) What contributes to the costs of those services? Efficiency is the relation between inputs and outputs for the same public service across LGs. We use SFA to evaluate service efficiency and regression analysis to evaluate their contributing costs.
As Israel is a highly centralised state (Ivanyna and Shah Citation2014), the normative level of wages for all public service employees are within the purview of the central government, which also controls the normative number of teaching hours and the normative number of students in a class.Footnote9 Therefore, we can safely assume homogeneity in the input variables for all LGs.
Our primary goal in performing the efficiency analysis is to note if there is a level playfield regarding their day-to-day operations. Therefore, we are interested in their efficiency differences rather than the absolute levels. We use Stata with the SFA model Belotti et al. (Citation2013) proposed to calculate the efficiency frontier and then differentiate average efficiencies into cities and regional councils. and show slight efficiency differences in providing education and sanitation services. This leads us to conclude that both groups operate similarly efficiently in providing local public services.Footnote10
Figure 2. Education and sanitation technical efficiency of cities and regional councils.
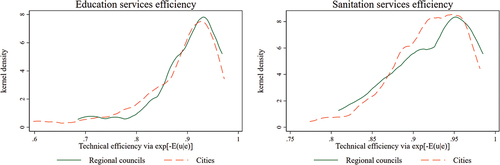
Table 2. SFA results.
6.2. Comparing income and expenditure in rural and urban LGs
Using Specifications (1) - (3), we evaluate expenditures and own-source income for all budget components from 2014 – 2021 in a panel model to reveal those that exhibit significant differences in cities and regional councils.
presents the differentials between regional council and city expenditures for the major categories and total current expenditures. The first column in each category presents the results for Specification (1) – the main effect of economies of scale and the differences between rural and urban LGs (City dummy variable); the second column presents the results for Specification (2) – the main effects of economies of scale and density; and the third column presents the results for Specification (3) – the interaction between population and density. clearly shows that all the major categories exhibit economies of scale. The most significant is in expenditures on G&A, where a 1% growth in population produces a 0.15% decrease in per-resident expenditure. The economies of scale of Local services, State services, and Total expenditures are smaller: 0.07%, 0.03%, and 0.06%, respectively. The Periphery Index is significantly negative, indicating that the more peripheral an LG is, the higher its per-resident expenditure is. Per-resident expenditure correlates positively with socio-economic standing, the number of students, or the percentage of senior citizens.
The city dummy presents the density and unexplained differences of 19.8%. further shows that cities and regional councils spend similar amounts on G&A and Local services. It further shows that expenditure on State services (mainly education and welfare) is 27% greater in regional councils when all control variables are considered. We used the method of Gelbach (Citation2016) to calculate the explanatory value of each variable. Starting with the base model, that includes density and unexplained difference, shows that population size adds 8.2%, peripherality location adds 4.2%, and socio-economic status 2.6%, resulting in a total difference of 39% - the ‘rural cost penalty’.
Table 3. The explanatory value of the independent variables on the ‘rural cost penalty’.
We use Specification (2) to calculate the economies of density. shows that economies of density are present in Total current expenditure, where a 1% increase in density implies an 0.09% decrease in per-resident expenditure. also shows that the yearly change in per-resident total expenditure is 1.8% of real value.
Table 4. Regression analysis of the major expenditure components.
The breakdown of each budgetary category into its components shows the similarities and differences in expenditures of regional councils and cities.Footnote11 Although the expenditure in total Local services is similar (the city coefficient is small and insignificant), there are variations within the budgetary components. Cities spend more on sanitation services, whereas regional councils spend more on village transfer payments.
Using a fixed-effect regression, we calculate Specification (1) as a robustness test. The calculations show significantly negative population coefficients (β1), which indicate economies of scale.
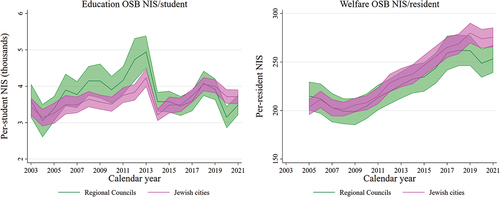
Education and welfare services are major budgetary components of State services. The analysis shows that educational services compose most of the difference in expenditures in regional councils and cities. As a service that LGs provide on behalf of the state, the central government reimburses LGs for most of their expenditures on education, typically at around 75%. shows the Own Source Balance (OSB) for educational and welfare services for cities and regional councils. OSB is the net amount (expenditure minus dedicated revenue income) that LGs spend on each budgetary component from their own-source revenue. shows that the OSB for education and welfare is similar for cities and regional councils, indicating that differences in government-earmarked grants can be attributed to differences in expenditures.
Figure 3. Own-source budget of education and welfare services.
The analysis shows that students in regional councils receive 19% more financing than city students. Most of this difference is due to transportation services, as regional councils provide free transportation from their villages to schools (Table C3 in the online appendix).
Regional councils’ per-resident expenditure is 19.8% greater than the cities’ ceteris paribus. presents the revenue difference. Columns (1) - (2) show that cities charge 4.3% more residential property tax, although the commercial property tax is similar in both groups. Regional councils receive 54% more monies in intergovernmental grants, resulting in similar income from total taxation and grants since the city dummy in Column (4) is small and insignificant. Within State services, income for welfare services is similar in both groups, but regional councils receive 48% more for educational transfers, wherein a significant portion is set aside for student transportation. Therefore, it is clear that the central government subsidises the difference in total expenditures between cities and regional councils.
Table 5. Revenue of major budgetary components.
6.3. Moderation effect of density on population size
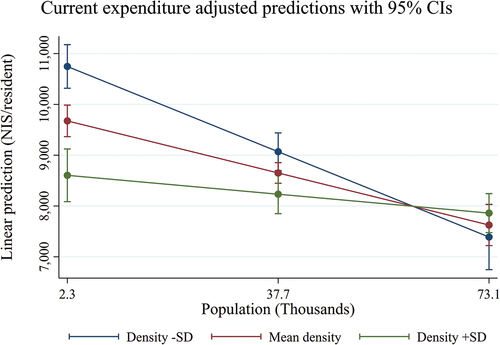
shows a significantly positive interaction between population size and density. The principal effect of population size and density on per-resident expenditure is negative and significant, implying economies of density and scale. However, as noted earlier, density correlates to population size, moderating the relation between population size and per-resident expenditure.
The positive and significant interaction between density and population size indicates that the denser the LG, the relationship between the population size and the per-resident expenditure flattens. shows the linear prediction of Specification (3) of per-resident current expenditures along three density criteria: mean density ± SD. Note that denser population diminishes the economies of scale, and the sparsity increases the economies of scale.
Figure 4. Population density moderates the relationship between population size and per-resident expenditures.
6.4. Expenditure – population dependency
The literature describes expenditure as either a logarithmic transformation of population, representing economies of scale, or as a quadratic polynomial of population that assumes a U-shape. To find out which specification better describes our dataset, we plot scatter charts of both (). We then perform a regression analysis for each group of LGs using both options. With each regression, we compute the AIC (Akaike Information Criterion) and BIC (Bayesian Information Criterion) measures of goodness of fit and select the model with the lowest measure (Table C8 in the online appendix).
Figure 5. Scatter charts of per-resident total current expenditure.
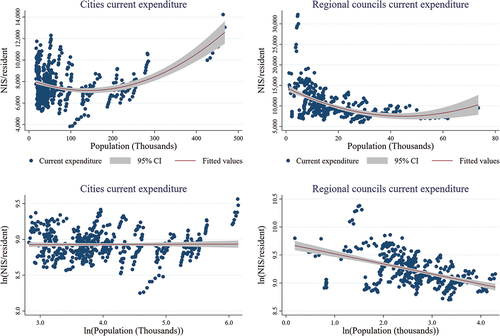
shows that the per-resident current expenditure of regional councils exhibits a shallow U-shaped structure, with an optimal population size of between 40–60 thousand residents, where most regional councils have populations below that minimum. This aligns with the theoretical analysis of Shani et al. (Citation2023). Furthermore, regressing Specification (2) shows that the logarithmic model best describes the regional councils.
We perform a similar analysis for cities. shows that per-resident current expenditure for cities also exhibits a U-shaped structure, with an optimal population size of 120,000 residents. This is somewhat greater than Bikker and van der Linde (Citation2016) and Drew et al. (Citation2016). The logarithmic transformation shows no effect. Therefore, the model that best fits cities is the quadratic polynomial.
6.5. Characterizing expenditures of rural and urban LGs
In this section, we explore how the characteristics of LGs influence the expenditures on different services.
6.5.1. Rural LGs – regional councils
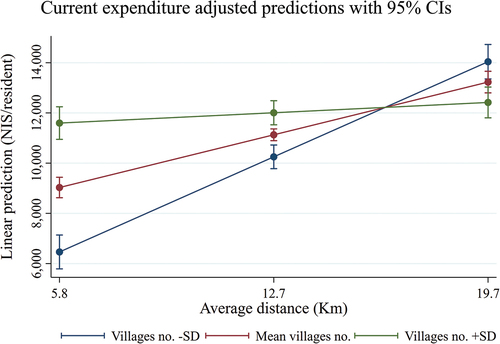
The analysis shows that most of the public services exhibit economies of scale. Some services present diseconomies of density, which may be attributed to the small span of resident density in rural spaces (). All services exhibit positive relations between the number of villages, the average distance between villages, and the location of main public services. The greater the number of villages or the greater the distance, the greater the expenditure. One additional village adds 0.4% to total current per-resident expenditures. This is composed of a 1% increase in G&A and in local services, and a 0.4% increase in state services (mainly education). The elasticity of per-resident expenditure to the average distance to a service centre is 0.3% of the Total current expenditure. This is decomposed into a 0.3% increase in G&A, a 0.4% increase in local services, and a 0.3% increase in state services.
The number of villages moderates the relationship between the average distance to the service centre and per-resident expenditure. The analysis shows that the interaction between the number of villages and the average distance is negative and significant. As the main effects of the number of villages and the average distance are positive and significant, the negative interactions point to the smoothing effect of moderation. A regional council that clusters more villages is less sensitive to distance to the service centre, as shown in .
Figure 6. The number of villages a regional council agglomerates moderates the relation between the average distance to a service centre and per-resident expenditure.
6.5.2. Urban LGs
Total per-resident current expenditure shows economies of scale occurring in jurisdictions of up to 120,000 residents and diseconomies of scale obtaining in larger cities. Most services exhibit economies of density, wherein a 1% increase in density is associated with an 0.1% decline in per-resident total current expenditure. The higher the socio-economic standing, the more peripheral the city is, or the older the city’s residents, the greater the per-resident expenditure.
7. Conclusions
What influences the increased costs of public services in rural towns? We argue that the inherent characteristics of LGs in rural areas, namely small population size, low population density, sparsity of villages, and long distance to service centres, explain the added cost. We also argue that population density moderates the relation between population size and the per-resident cost of public services. Furthermore, we argue that population increases reduce per-resident costs, but establishing new villages increases costs and that the number of villages moderates the relationship between distance and cost. Our findings demonstrate that the cities and regional councils operate at similar efficiency levels concerning education, sanitation, and total expenditures. Regional councils exhibit higher costs per resident, mainly due to higher education costs, including student transportation. We then show that the higher cost of public services in rural LGs is not due to own-source tax income differences.
We show that all major budgetary categories exhibit economies of scale and density, most significantly in expenditures for G&A. Rural LGs are smaller, more peripheral, and sparsely populated, so their per-resident expenditures are higher. We show that the additional cost of public services in rural areas is 39%. Population size contributes 8.2% to the added cost; peripherality adds 4.2%; socio-economic status 2.6%; and density and other structural differences explain the remaining 20%, ceteris paribus. Income from taxes in rural LGs’ is only a few percentage points lower than that of cities, but they receive more unconditioned inter-governmental grants (55%) and educational income (48%). Therefore, the central government subsidises the total expenditure differential between cities and regional councils.
The policy implies that central governments are expected to transfer more grant monies to rural LGs or encourage them to develop other revenue sources. Otherwise, rural LGs would have to compromise on the quality and level of public services. This 39% differential comprises the ‘rural cost penalty’. Similar to those obtained by Kitchen and Slack (Citation2006) and Cossu and Masi (Citation2013), our results indicate that the ‘rural cost penalty’ may be consistent across countries.
Density significantly influences per-resident expenditure directly and through moderating economies of scale: the denser the population, the economies of scale flatten. We show that per-resident expenditures increase with the number of villages or distance to the service centre. The finding that the greater the distance, the greater the per-resident expenditure has been noted in previous studies, although without quantification. The positive effect of the number of villages is an added structural cost. If new residents inhabit existing villages rather than establishing a new village, per-resident expenditure declines per economies of scale. If, on the other hand, the government establishes more villages while keeping the same number of residents, per-resident expenditure rises, indicating the additional overhead cost of creating a village. Moreover, we show that a regional council that clusters more villages is less sensitive to distances to the service centre.
From an economic perspective, there are two ways to save costs. First, small regional councils should be merged into larger ones until a threshold of 40–60 thousand residents is reached (Shani, Reingewertz, and Vigoda-Gadot Citation2023). Second, by increasing the population density of rural villages.
Our study quantifies the benefit of maintaining rural areas within a country using the hedonic approach (Rosen Citation1974): estimating the value of inhabited rural areas by comparing them to cities. Central governments reveal their interests and preferences in maintaining rural areas by granting them 20%-39% more financial support than urban LGs. Further research may be able to quantify the financial benefits accruing to rural areas directly.
Our study is not without its limitations, as the number of LGs in each category is relatively small. Conducting similar studies in larger countries will give urban and rural LGs more representative statistics.
Our results enable us to compare costs in rural vs. urban LGs, showing that public services in rural LGs cost more than similar services in urban LGs. These differences result from inherent characteristics of rural LGs: population size, lower density, high sparsity of villages, and greater distances.
Supplemental Material
Download MS Word (105.2 KB)Acknowledgments
We express our sincere appreciation to the editor and two anonymous reviewers who provided valuable comments and constructive critiques. Their rigorous evaluation and thoughtful recommendations have undoubtedly strengthened the rigour and clarity of our research. Any residual mistakes are entirely our own fault.
Disclosure statement
No potential conflict of interest was reported by the author(s).
Supplementary material
Supplemental data for this article can be accessed online at https://doi.org/10.1080/03003930.2024.2369784
Notes
1. Grouping rural villages into service clusters, such as regional councils, is more economically efficient than each village having to provide public services on its own. The terms ‘service cluster’ and ‘regional councils’ are interchangeable.
2. Authors’ compilation of Tables 7–8 in Cossu and Masi (Citation2013).
3. Table C6 in Appendix C shows that the per-resident expenditure of towns is significantly lower than cities and regional councils. Towns experience resource limitations, which affirms our decision to exclude towns from the analysis.
4. The cities in the study represent 65% of the total population, and regional councils 10%.
5. Appendix B presents detailed description of LGs financial statements.
6. Appendix A presents SFA description.
7. The ICBS measures residential density using GIS.
8. See data.gov.il and cbs.gov.il.
9. LGs may deviate from the normative standards of the MoE, to the extent allowed by their budgets.
10. Appendix A presents detailed SFA results.
11. Appendix C presents detailed results of the breakdown of the budgetary components for Local services and State services.
References
- Aldag, A. M., and M. E. Warner. 2018. “Cooperation, Not Cost Savings: Explaining Duration of Shared Service Agreements.” Local Government Studies 44 (3): 350–370. https://doi.org/10.1080/03003930.2017.1411810.
- Aldag, A. M., M. E. Warner, and G. Bel. 2020. “It Depends on What You Share: The Elusive Cost Savings from Service Sharing.” Journal of Public Administration Research and Theory 30 (2): 275–289. https://doi.org/10.1093/jopart/muz023.
- Allers, M. A., and J. B. Geertsema. 2016. “The Effects of Local Government Amalgamation on Public Spending, Taxation, and Service Levels: Evidence from 15 Years of Municipal Consolidation.” Journal of Regional Science 56 (4): 659–682. https://doi.org/10.1111/jors.12268.
- Andrews, R., and G. Boyne. 2009. “Size, Structure and Administrative Overheads: An Empirical Analysis of English Local Authorities.” Urban Studies 46 (4): 739–759. https://doi.org/10.1177/0042098009102127.
- Asthana, S., and J. Halliday. 2004. “What Can Rural Agencies Do to Address the Additional Costs of Rural Services? A Typology of Rural Service Innovation.” Health and Social Care in the Community 12 (6): 457–465. https://doi.org/10.1111/j.1365-2524.2004.00518.x.
- Avellaneda, C. N., and R. C. Gomes. 2015. “Is Small Beautiful? Testing the Direct and Nonlinear Effects of Size on Municipal Performance.” Public Administration Review 75 (1): 137–149. https://doi.org/10.1111/puar.12307.
- Belotti, F., S. Daidone, G. Ilardi, and V. Atella 2013. “Stochastic Frontier Analysis Using Stata.” The Stata Journal 13 (4): 719–758. https://doi.org/10.1177/1536867x1301300404.
- Bel, G., and M. E. Warner. 2015. “Inter-Municipal Cooperation and Costs: Expectations and Evidence.” Public Administration 93 (1): 52–67. https://doi.org/10.1111/padm.12104.
- Ben-Bassat, A., and M. Dahan. 2009. The Political Economics of the Municipalities. Jerusalem, Israel: The Israel Democracy Institute.
- Bernardelli, L. V., M. A. Kortt, and B. Dollery. 2020. “Economies of Scale and Brazilian Local Government Expenditure: Evidence from the State of Paraná.” Local Government Studies 46 (3): 436–458. https://doi.org/10.1080/03003930.2019.1635018.
- Bikker, J., and D. van der Linde. 2016. “Scale Economies in Local Public Administration.” Local Government Studies 42 (3): 441–463. https://doi.org/10.1080/03003930.2016.1146139.
- Blesse, S., and T. Baskaran. 2016. “Do Municipal Mergers Reduce Costs? Evidence from a German Federal State.” Regional Science and Urban Economics 59:54–74. https://doi.org/10.1016/j.regsciurbeco.2016.04.003.
- Bradley, P., and P. Barratt. 2003. Study of the Relative Costs Associated with Delivering the Connexions Service in Rural and Urban Areas. DfES Research Report (No. RR390; Issue January). http://www.education.gov.uk/publications/eOrderingDownload/RR390.pdf.
- Buljan, A., S. Švaljek, and M. Deskar-Škrbić. 2022. “In Search of the Optimal Size for Local Government: An Assessment of Economies of Scale in Local Government in Croatia.” Local Government Studies 48 (4): 604–627. https://doi.org/10.1080/03003930.2021.2007080.
- Callanan, M., R. Murphy, and A. Quinlivan. 2014. “The Risks of Intuition: Size, Costs and Economies of Scale in Local Government.” Economic and Social Review 45 (3): 371–403.
- Carruthers, J. I., and G. F. Ulfarsson. 2003. “Urban Sprawl and the Cost of Public Services.” Environment and Planning B: Planning and Design 30 (4): 203–522. https://doi.org/10.1068/b12847.
- Cobban, T. W. 2019. “Bigger is Better: Reducing the Cost of Local Administration by Increasing Jurisdiction Size in Ontario, Canada, 1995–2010.” Urban Affairs Review 55 (2): 462–500. https://doi.org/10.1177/1078087417719324.
- Cossu, R., and S. Masi. 2013. “Re-Thinking Incentives and Penalties: Economic Aspects of Waste Management in Italy.” Waste Management 33 (11): 2541–2547. https://doi.org/10.1016/j.wasman.2013.04.011.
- Drew, J., M. Kortt, and B. Dollery. 2014. “Economies of Scale and Local Government Expenditure: Evidence from Australia.” Administration and Society 46 (6): 632–653. https://doi.org/10.1177/0095399712469191.
- Drew, J., M. Kortt, and B. Dollery. 2016. “Did the Big Stick Work? An Empirical Assessment of Scale Economies and the Queensland Forced Amalgamation Program.” Local Government Studies 42 (1): 1–14. https://doi.org/10.1080/03003930.2013.874341.
- Fellows, C., B. Dollery, and R. Marques. 2022. “Identifying Interactions Between Size Effects in New South Wales Local Government.” Local Government Studies 48 (5): 842–863. https://doi.org/10.1080/03003930.2021.1980390.
- Fellows, C., B. Dollery, and C. T. T. D. Tran. 2022. “Is Bigger More Efficient? An Empirical Analysis of Scale Economies in Administration in South Australian Local Government.” Economic Papers 41 (1): 54–67. https://doi.org/10.1111/1759-3441.12327.
- Ferguson, C. E. 1969. The Neoclassical Theory of Production and Distribution. Cambridge University Press. https://doi.org/10.1017/CBO9780511896255.
- Fregolent, L., and S. Tonin. 2016. “Local Public Spending and Urban Sprawl: Analysis of This Relationship in the Veneto Region of Italy.” Journal of Urban Planning and Development 142 (3). https://doi.org/10.1061/(asce)up.1943-5444.00003181423.
- Gelbach, J. B. 2016. “When Do Covariates Matter? And Which Ones, and How Much?” Journal of Labor Economics 34 (2): 509–543. https://doi.org/10.1086/683668.
- Geys, B., F. Heinemann, and A. Kalb. 2013. “Local Government Efficiency in German Municipalities.” Raumforschung und Raumordnung | Spatial Research and Planning 71 (4): 283–293. https://doi.org/10.1007/s13147-012-0191-x.
- Gómez-Reino, J. L., S. Lago- PeñPeñAs, and J. Martinez-Vazquez. 2023. “Evidence on Economies of Scale in Local Public Service Provision: A Meta-Analysis.” Journal of Regional Science: 1–27. https://doi.org/10.1111/jors.12640.
- Hall, J. L. 2010. “The Distribution of Federal Economic Development Grant Funds: A Consideration of Need and the Urban/Rural Divide.” Economic Development Quarterly 24 (4): 311–324. https://doi.org/10.1177/0891242410366562.
- Hananel, R., and A. Fishman. 2017. The Rural Space in Israel: Who Is Serving You? Tel Aviv, Israel: Tel Aviv University.
- Hefetz, A., M. E. Warner, and E. Vigoda-Gadot. 2012. “Privatization and Intermunicipal Contracting: The US Local Government Experience 1992–2007.” Environment and Planning C: Government and Policy 30 (4): 675–692. https://doi.org/10.1068/c11166.
- Hindle, R., and I. Annibal. 2011. “Developing Collaborative and Innovative Approaches to the Delivery of Rural Services.” (Issue September). https://randd.defra.gov.uk/ProjectDetails?ProjectId=17240.
- Hindle, G., and T. Hindle. 2010. “Developing Geographical Indicators of Mileage-Related Costs: A Case Study Exploring Travelling Public Services in English Local Areas.” Journal of the Operational Research Society 61 (5): 714–722. https://doi.org/10.1057/jors.2009.21.
- Hindle, T., M. Spollen, and P. Dixon. 2004. Review of Evidence on Additional Costs of Delivering Services to Rural communities. Final Report for Defra. (Issue April).
- Holcombe, R., and D. Williams. 2009. “Are There Economies of Scale in Municipal Government Expenditures?” Public Finance and Management 9 (3): 416–438. https://doi.org/10.1177/152397210900900305.
- Holcombe, R., and D. E. Williams. 2008. “The Impact of Population Density on Municipal Government Expenditures.” Public Finance Review 36 (3): 359–373. https://doi.org/10.1177/1091142107308302.
- Hortas-Rico, M., and V. Rios. 2020. “Is There an Optimal Size for Local Governments? A Spatial Panel Data Model Approach.” Regional Studies 54 (7): 958–973. https://doi.org/10.1080/00343404.2019.1648786.
- Hortas-Rico, M., and A. Solé-Ollé. 2010. “Does Urban Sprawl Increase the Costs of Providing Local Public Services? Evidence from Spanish Municipalities.” Urban Studies 47 (7): 1513–1540. https://doi.org/10.1177/0042098009353620.
- Ivanyna, M., and A. Shah. 2014. “How Close Is Your Government to Its People? Worldwide Indicators on Localization and Decentralization.” Economics 8 (2014–3): 1–61. https://doi.org/10.5018/economics-ejournal.ja.2014-3.
- Kitchen, H., and E. Slack. 2006. “Providing Public Services in Remote Areas.” In Perspectives on Fiscal Federalism, edited by R. M. Bird and F. Vaillancour, 123–139. World Bank. https://doi.org/10.4324/9781003286387-8.
- Ladd, H. F. 1992. “Population Growth, Density and the Costs of Providing Public Services.” Urban Studies 29 (2): 273–295. https://doi.org/10.1080/00420989220080321.
- Libertun de Duren, N., and R. Guerrero Compeán. 2016. “Growing Resources for Growing Cities: Density and the Cost of Municipal Public Services in Latin America.” Urban Studies 53 (14): 3082–3107. https://doi.org/10.1177/0042098015601579.
- Mattson, J. 2021. “Relationships Between Density and per Capita Municipal Spending in the United States.” Urban Science 5 (3): 69. https://doi.org/10.3390/urbansci5030069.
- OECD. 2016. OECD Regional Outlook 2016 Productive Regions for Inclusive Societies/Organisation for Economic Co-Operation and Development. OECD. https://doi.org/10.1787/9789264260245-en.
- Ramsland, D., and B. Dollery. 2011. “Enhancing Regional Cooperation Between Local Councils: A Proposed Two-Tier Model for Australian Local Government.” Journal of Economic & Social Policy 14 (2): 28–45. https://search.informit.org/doi/abs/10.3316/informit.497122968592662.
- Ranasinghe, J. 2011. Costs of Providing Services in Rural Areas. (Delivering Rural Services (SPARSE-RURAL)).
- Ranasinghe, J. 2014. “Research into Drivers of Service Costs in Rural Areas.” https://assets.publishing.service.gov.uk/government/uploads/system/uploads/attachment_data/file/388587/Rural_summary_report.pdf.
- Rasis, S., and L. Applebaum. 2009. Legal Aspects of Structural Adjustments in Israel’s Rural Local Government. Vol. 68. Jerusalem, Israel: Hebrew University of Jerusalem.
- Razin, E. 1998. “The Impact of Decentralisation on Fiscal Disparities Among Local Authorities in Israel.” Space and Polity 2 (1): 49–69. https://doi.org/10.1080/13562579808721770.
- Reingewertz, Y. 2012. “Do Municipal Amalgamations Work? Evidence from Municipalities in Israel.” Journal of Urban Economics 72 (2–3): 240–251. https://doi.org/10.1016/j.jue.2012.06.001.
- Rosen, S. 1974. “Hedonic Prices and Implicit Markets: Product Differentiation in Pure Competition.” Journal of Political Economy 82 (1): 34–55. https://doi.org/10.1086/260169.
- Shani, R., Y. Reingewertz, and E. Vigoda-Gadot. 2023. “Regional Governments in the Rural Space: The Effectiveness of Dual-Tier Regional Councils.” Regional Studies 57 (9): 1816–1831. https://doi.org/10.1080/00343404.2022.2153825.
- Solé-Ollé, A., and N. Bosch. 2005. “On the Relationship Between Authority Size and the Costs of Providing Local Services: Lessons for the Design of Intergovernmental Transfers in Spain.” Public Finance Review 33 (3): 343–384. https://doi.org/10.1177/1091142104272708.
- Tavares, A. F. 2018. “Municipal Amalgamations and Their Effects: A Literature Review.” Miscellanea Geographica 22 (1): 5–15. https://doi.org/10.2478/mgrsd-2018-0005.
- Tran, C., M. Kortt, and B. Dollery. 2019. “Population Size or Population Density? An Empirical Examination of Scale Economies in South Australian Local Government, 2015/16.” Local Government Studies 45 (5): 632–653. https://doi.org/10.1080/03003930.2018.1501364.
- Warner, M. E. 2006. “Market-Based Governance and the Challenge for Rural Governments: US Trends.” Social Policy and Administration 40 (6): 612–631. https://doi.org/10.1111/j.1467-9515.2006.00523.x.