
Abstract
Objective: The aim of the Iluvien Clinical Evidence study in the UK (ICE-UK) was to assess the real-world effectiveness of fluocinolone acetonide (FAc) 190 µg intravitreal implant for the treatment of clinically significant chronic diabetic macular edema (DME) in routine clinical practice.
Methods: This retrospective study collected data from patient medical records in 13 ophthalmology centers for people with DME prescribed FAc intravitreal implant between April 1, 2013 and April 15, 2015. Visual acuity (VA) and intraocular pressure (IOP) measurements were collected for 12 months prior to and after implant.
Results: Two hundred and eight people, contributing 233 eyes, treated with FAc implant were included. Mean age was 68.1 years and 62% were male. In the 12 months prior to FAc implant, VA declined. Median (interquartile range, IQR) VA was 0.66 (0.48–1.00) LogMAR units (equivalent to 52.0 ETDRS letters) at implant, improving to 0.60 (0.38–0.90) LogMAR units (55.0 letters) at 12 months post-implant (p < 0.001). In total, 44%, 30%, and 18% of people achieved an improvement in ETDRS score of ≥5, ≥10, and ≥15 letters, respectively, over the same period. A small but significant (p < .001) increase in median IOP was observed (median = 15.0, IQR = 13.0–18.0 mmHg at implant to 18.0, 15.0–21.0 mmHg at 12 months). In the 12 months following implant, additional IOP-lowering therapy was prescribed in 15% of subjects previously not requiring such therapy.
Conclusion: Following FAc implant, an overall significant improvement in VA was observed over a period of 12 months, accompanied by a significant but small increase in IOP.
Introduction
The fluocinolone acetonide (FAc) 190 µg intravitreal implant has been licensed in 17 European countries for the management of chronic diabetic macular edema (DME) when other treatments have proven to be insufficiently effective. The approval of the FAc implant was based on data from the Fluocinolone Acetonide in Diabetic Macular Edema (FAME) study programCitation1. This program comprised two separate randomized controlled trials, FAME A and FAME B, and studied the clinical effectiveness of the FAc intravitreal implant in DMECitation2,Citation3. Analysis of the combined data demonstrated that, vs the patients randomized to sham injection, the FAc 0.2 µg/day intravitreal implant provided significant visual benefits over the 3-year period of follow-upCitation2,Citation3.
However, the treatment paradigm for center-involving clinically significant DME has changed since the FAME studies were conducted. At that time, laser photocoagulation was considered to be the cornerstone of the management of DME, supported by evidence from the Early Treatment Diabetic Retinopathy Study (ETDRS)Citation4. However, several landmark trials have since demonstrated that anti-VEGF therapy can lead to an improvement in vision in people with DMECitation5–8 and, therefore, anti-VEGF therapy is now considered to be the gold-standard, first-line treatment for the condition. People recruited for the FAME studies were previously treated with retinal laser therapy with no prior exposure to anti-VEGF therapiesCitation2,Citation3. As the FAc intravitreal implant is currently only indicated when available therapies have proved to be insufficiently effective, there is a need to determine the effectiveness of FAc in those individuals previously exposed to anti-VEGF therapy.
The role of real-world clinical evidence in supplementing clinical trial data has been acknowledged by regulatory authoritiesCitation9, with eye disorders previously investigated using either prospective (HELIOS)Citation10 or retrospective designs (TWIN)Citation11. Studies investigating the effectiveness of the FAc intravitreal implant using real-world data are limited, with most of the studies being short-term follow-up studies with small participant numbers and/or limited data collectionCitation12–16. However, in a recently published, larger prospective study by El-Ghrably et al.Citation17 involving DME subjects previously treated with anti-VEGF (n = 57), an improvement in best-corrected visual acuity and central macular thickness was observed at 3 months post-FAc implant, with a sustained effect observed for the remainder of the 12-month follow-up period.
Since FAME, no randomized clinical trials have been conducted to assess the impact of FAc intravitreal implant on visual acuity and other clinical outcomes after treatment with anti-VEGF. Therefore, the aim of the ILUVIEN Clinical Evidence study in the UK (ICE-UK) was to assess the real-world effectiveness of FAc intravitreal implant in routine clinical practice. Additionally, the project was conducted to assess the long-term effect of FAc intravitreal implant on intraocular pressure (IOP) and its management in clinical practice. The real-world evidence generated by the clinical use of FAc intravitreal implant since 2013 provides an opportunity to investigate treatment outcomes retrospectively. The study design enabled data to be collected for at least 12 months prior to and at least 12 months post-implant. The collection of data prior to implant is of considerable advantage to this study and is rarely available from randomized controlled trials.
Methods
Data source
A retrospective cohort study was conducted. In this multi-center, hospital-based study, data were taken from the medical records. Data collection was secondary, as the data used for this study were initially collected for purposes other than research. Data were collected from a representative cohort of people treated at 13 participating hospitals in the UK and combined into a single dataset for the purpose of analysis. These data were pseudonymized and entered into an online data entry tool (Real World Treatment Evaluator), where center and subject identifiers were added. Data generated from retrospective case reviews were entered by the consultant themselves or by other members of the healthcare professional’s team.
Data included demographics, medical history, implant data, and data from multi-disciplinary and medication reviews at several time points within a designated period (see Supplementary Figure 1). Quantitative data were generated from medical records, administrative records, and clinical measurements, and were collected only for those parameters that were necessary to answer the research question. Summaries by site were not performed other than for analysis relevant to evaluation of their healthcare service. No data linkage took place in the course of this project. At no point did Alimera Sciences, the manufacturer of ILUVIEN, have access to the data.
Ethical approval
The lead clinician and Caldicott Guardian at each center gave written approval for extraction of anonymized data. The study protocol was approved by the head of research governance at the lead clinical center. This study was conducted in accordance with the Declaration of Helsinki and the UK Data Protection Act.
Subjects
A cohort of people prescribed FAc 190 µg intravitreal implant was constructed based on past exposure to FAc intravitreal implant. People with type 1 and type 2 diabetes treated with FAc intravitreal implant for DME in at least one eye were included in the cohort if they had received an implant at a participating site as part of their routine care between April 1, 2013 and April 15, 2015 and had a minimum of 12 months’ history prior to implant. Subjects were excluded from the study if they had been involved in other, prior interventional studies for DME. People who had insufficient follow-up because they had left the clinic, had no visits, or had missed their last appointment post-index were also excluded from the study.
The index date was defined as the date of first recorded FAc intravitreal implant into the study eye. All subjects were followed from implant for 1 year. As the end of the observation period was April 15, 2016, all selected subjects had a follow-up of at least 1 year post-implant. Individuals that received FAc intravitreal implant in both eyes were allowed to contribute both eyes to the study.
Outcomes
For these analyses, the following clinical outcomes were investigated at 3, 6, and 12 months post-index date: change in visual acuity on the LogMAR (Logarithm of the Minimum Angle of Resolution) scale; proportion of eyes that demonstrated an improvement in ETDRS score of ≥5 letters, ≥10 letters, and ≥15 letters; and change in IOP from implant.
Visual acuity was measured using one of: ETDRS scores, Snellen fractions, or LogMAR scores. Snellen fractions were converted to approximate ETDRS scores for the purpose of analysis using the following formula derived by Gregori et al.Citation18: approximate ETDRS = 85 + 50 × log (Snellen fraction). All approximate ETDRS scores were rounded to the nearest integer. Snellen fractions were converted to LogMAR scores using the following formula: –1 × log (Snellen fraction)Citation18. These formulae were rearranged to convert between LogMAR and ETDRS. Where a person could only detect light, detect movement, or count fingers, a LogMAR score of 2.3, equivalent to counting figures, was appliedCitation18.
Sub-groups
Results are presented for four sub-groups based on higher and lower visual acuity at implant (<0.7 and ≥0.7 on LogMAR scale, equivalent to an approximate ETDRS letter score of <50 and ≥50Citation18) and number of treatments for DME prior to implant (categorized as six or fewer treatments and more than six treatments). Treatments for DME were defined as laser therapy, steroid treatment (triamcinolone and dexamethasone), and anti-vascular endothelial growth factor (anti-VEGF) injection (ranibizumab, aflibercept, and bevacizumab). People with no baseline visual acuity score and no history of receiving any anti-VEGF, macular laser, or steroid therapy prior to index date were excluded from the sub-group analyses.
Statistical analysis
Changes in visual acuity (LogMAR scale) and IOP were compared between implant and the 3-, 6-, and 12-month time points using the non-parametric Wilcoxon signed ranks test, because the variables were not normally distributed. The proportions of people achieving an improvement in visual acuity between implant and the 3-, 6-, and 12-month time points were compared between sub-groups using Fisher’s exact test. Mean and median visual acuity (LogMAR scale) were calculated daily for the 12 months prior to and post-FAc implant. In order to smooth the data, missing values for each day of this 24-month period were imputed using linear interpolationCitation19. As linear interpolation could not be used before the first recorded value or after the last recorded value, nearest observation carried forward and backwards were used to impute the remaining missing values. Last observation carried forward was implemented to impute missing values in all other analyses where changes in study outcomes were evaluated at 3-, 6-, and 12-month follow-up time pointsCitation19. Missing values were imputed in two stages: ≤ index date and > index date. Statistical analyses were carried out using IBM SPSS Statistics version 20.
Results
Data were collected on 311 people, of which 208 people contributing 233 eyes treated with FAc intravitreal implant were eligible for inclusion in the study cohort (). Two hundred and five people (99%) had bilateral DME at implant. Of the 233 eyes treated, 208 were first eyes treated with the implant and 25 were a second eye in the same person.
Patient characteristics
Of the 208 people treated in any eye, 128 (62%) were male. Mean age was 68.1 years; 176 (85%) had type 2 diabetes (). Median (IQR) duration of diabetes was 18 (11–28) years.
Table 1. Baseline characteristics overall and by visual acuity and treatment sub-group.
Two hundred and sixteen treated eyes had a baseline visual acuity score and a history of receiving at least one treatment for DME (steroid, macular laser, or anti-VEGF therapies). Of these, 89 eyes (41%) had previously received six or fewer prior treatments. Visual acuity was <0.7 LogMAR units in 45 eyes (21%) and ≥0.7 LogMAR units in 44 eyes (20%). One hundred and twenty-seven eyes (59%) had received more than six prior anti-VEGF, macular laser, or steroid therapies prior to implant. Here, visual acuity was <0.7 LogMAR units in 63 (29%) eyes and ≥0.7 LogMAR units in 64 eyes (30%).
Two hundred and seven treated eyes (89%) had a pseudophakic lens at the time of implant. Median (IQR) visual acuity at implant was 0.66 (0.48–1.00) LogMAR units. Mean (SD) central foveal thickness at implant was 482 μm (186 μm), and median (IQR) IOP was 15.0 (13.0–18.0) mmHg. Median (IQR) number of macular laser treatments, steroid treatments, and anti-VEGF injections prior to index date was 1.0 (0.0–3.0), 0.0 (0.0–1.0), and 5.0 (2.0–7.0), respectively. Baseline characteristics by visual acuity and treatment sub-groups are described in and Supplementary Table 1.
Intraocular therapies
At FAc implant, 191 eyes (82%) had received at least one prior anti-VEGF treatment (). Thirteen (6%), 21 (9%), and 41 (18%) treated eyes received additional anti-VEGF treatment between 0–3 months, 3–6 months, and 6–12 months, post FAc implant, respectively. Three (1%), 3 (1%), and 11 (5%) treated eyes received additional steroid therapy between 0–3 months post-index date, 3–6 months post-index date, and 6–12 months post-index date, respectively. The corresponding figures for laser therapy were 4 (2%), 6 (3%), and 11 (5%) procedures, respectively. Over the 12-month follow-up period, additional treatments for DME were used in 69 (30%) treated eyes. Cataract operations were conducted in 19 eyes between 0–3 months. However, 14 of these operations were conducted on the same date as the eye was implanted. A cataract operation was conducted in one treated eye between 3–12-months post-implant.
Table 2. Number of eyes receiving other interventions before and after treatment with fluocinolone intravitreal implant.
Visual acuity
In the 12-month period prior to FAc implant, a decrease in visual acuity was observed, median = 0.6 to 0.66 LogMAR units (55.0 to 52.0 ETDRS letters), mean = 0.72 to 0.76 LogMAR units (49.6 to 47.5 ETDRS letters, ). Following implant, visual acuity improved, median = 0.55 and 0.60 LogMAR units (57.5 and 55.0 ETDRS letters), mean = 0.65 and 0.67 LogMAR units (52.9 and 51.8 ETDRS letters) at months 4 and 12 post-implant.
Figure 1. Attrition. FAc, fluocinolone acetonide; VEGF, vascular endothelial growth factor.
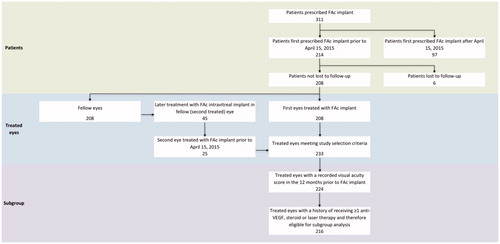
Figure 2. Change in visual acuity in the 12 months before and after fluocinolone intravitreal implant. (a) LogMAR scale. (b) ETDRS letters. Visual acuity measurements recorded in the 12 months before and after FAc implant were included. Linear interpolation was used to impute missing values between visual acuity scores. Nearest observation carried forward and backwards was used to impute missing values prior to the first and after the last recorded measurement. Imputation was carried out in two parts, day –365 to day 0 and day 1 to day 365.
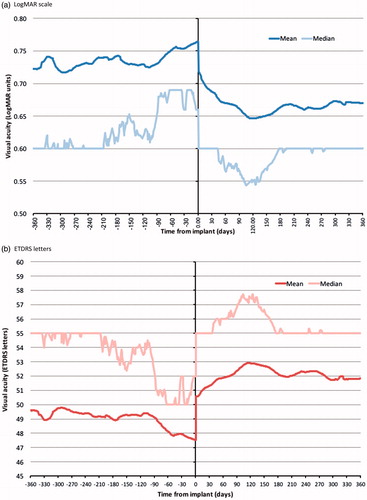
Median (IQR) visual acuity in treated eyes changed from 0.64 (0.48–1.00) to 0.54 (0.40–0.90) LogMAR units between implant and 3 months (p < .001), from 0.66 (0.48–1.0) to 0.54 (0.32–0.87) LogMAR units between implant and 6 months (p < .001), and from 0.66 (0.48–1.00) to 0.60 (0.38–0.90) LogMAR units between implant and 12 months (p < .001, ). Following conversion to ETDRS letter score, median (IQR) visual acuity changed from 53.0 (35.0–61.0) to 58.0 (40.0–65.0) letters between implant and 3 months, from 52.0 (35.0–61.0) to 58.0 (41.5–69.0) letters between implant and 6 months, and from 52.0 (35.0–61.0) to 55.0 (40.0–66.0) letters between implant and 12 months.
Table 3. Change in visual acuity (baseline value varies according to availability of pairs of visual acuity values at baseline and during follow-up).
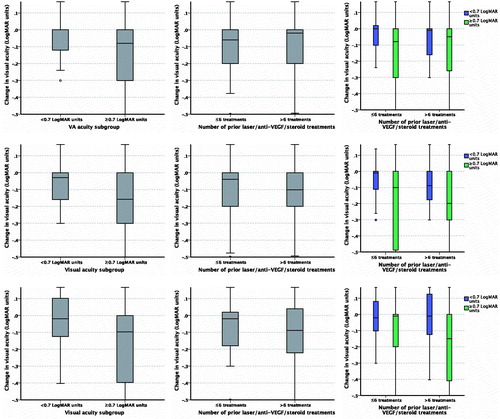
A significant improvement in visual acuity was observed at all time points in those eyes with a visual acuity score of ≥0.7 LogMAR units at implant, regardless of treatment sub-group (six or fewer and more than six anti-VEGF, steroid, and macular laser therapies prior to index date; ). At 12 months post-FAc implant, a non-significant improvement in visual acuity was observed in those with a visual acuity score of <0.7 LogMAR units at baseline (median [IQR] = 0.48 [0.3–0.54] LogMAR units or 65 [55–75 ETDRS] letters at implant and 0.4 [0.2–0.6] LogMAR units or 64.5 [55–74.5] letters at 12 months post-implant, p = .390). Similarly, a non-significant improvement in visual acuity was observed in the same eyes when analyzed by treatment sub-group.
Figure 3. Percentage of fluocinolone acetonide treated eyes achieving (a) ≥ 5, ≥ 10, and ≥15 letter improvement in ETDRS score and (b) ≥ 5, ≥ 10, and ≥15 letter worsening in ETDRS score overall and by visual acuity and treatment sub-group. VA, visual acuity.
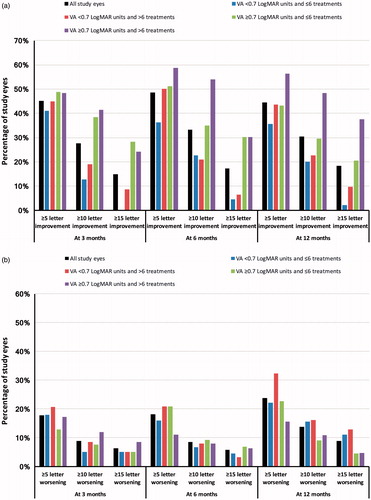
When analyzed using ETDRS score, visual acuity improved by at least five letters in 91 (45%), 107 (49%), and 99 (44%) of the treated eyes at 3 months, 6 months, and 12 months post-implant, respectively (). The corresponding visual acuity scores for an improvement of ≥10 letters were 56 (28%), 73 (33%), and 68 (30%), respectively; 30 (15%), 38 (17%), and 41 (18%) eyes had an improvement in ETDRS score of at least 15 letters at 3 months, 6 months, and 12 months post-index, respectively. The corresponding figures by visual acuity and treatment sub-group are detailed in and Supplementary Figure 2. No significant association between the number of prior treatments (six or fewer and more than six) and the achievement of an improvement of ≥5 letters, ≥10 letters and ≥15 letters in ETDRS score from implant to the three time points was observed within each visual acuity sub-group (<0.7 and ≥0.7 LogMAR units). In those eyes with a pseudophakic lens at implant, 36 (17%) had an improvement in ETDRS letter score of ≥15 letters at 12 months. Visual acuity worsened by ≥5 letters in 53 (24%) eyes, ≥10 letters in 31 (14%) eyes, and ≥15 letters in 20 (9%) eyes between FAc implant and 12 months follow-up.
Change in visual acuity score by sub-group is detailed in and Supplementary Figure 3.
Figure 4. Change in visual acuity (LogMAR scale) post-index by sub-group. (a) At 3 months by visual acuity sub-group; (b) At 3 months by treatment sub-group; (c) At 3 months by visual acuity and treatment sub-group; (d) At 6 months by visual acuity sub-group; (e) At 6 months by treatment sub-group; (f) At 6 months by visual acuity and treatment sub-group; (g) At 12 months by visual acuity sub-group; (h) At 12 months by treatment sub-group; (i) At 12 months by visual acuity and treatment sub-group.
Intraocular pressure
Median (IQR) IOP increased from implant to each time point: 15.0 (13.0–18.0) mmHg at implant to 17.0 (14.0–20.0) mmHg at 3 months (p < .001), 15.0 (13.0–18.0) mmHg at implant to 17.0 (15.0–20.0) mmHg at 6 months (p < .001), and 15.0 (13.0–18.0) mmHg at implant to 18.0 (15.0–21.0) mmHg at 12 months (p < .001; ).
Table 4. Change in intraocular pressure for paired values where these were available (baseline value varies according to availability of IOP at baseline and the respective time-point).
Five (3%), 15 (8%), and 29 (15%) people with no history of receiving IOP-lowering therapies prior to FAc intravitreal implant were prescribed IOP-lowering therapy between 0–3 months, 0–6 months and 0–12 months post-implant ().
Table 5. Intraocular pressure-lowering therapy before and after implant.
IOP was <21 mmHg in 141 (90%) treated eyes at FAc implant and 127 (81%) treated eyes at 3 months (p = .029). One hundred and fifty-nine (91%) and 137 (78%) treated eyes had an IOP of <21 mmHg at FAc implant and 6 months, respectively (p = .002). The corresponding values at implant and 12 months were 165 (91%) and 135 (75%), respectively (p < .001).
Discussion
In the 12 months prior to the FAc implant, a decline in visual acuity was observed. Following FAc intravitreal implant, there was an overall improvement in visual acuity at 3, 6, and 12 months. Visual acuity improved by at least 15 letters in nearly one fifth of treated eyes at 12 months post-implant. After insertion of FAc intravitreal implant, there was a small but statistically significant increase in median IOP recorded at 3, 6, and 12 months, but this remained below a median value of 21 mmHg at each time point. In the first 12-month period following FAc implant, 15% of subjects were newly treated with IOP-lowering medication. Additional concomitant treatments for DME were used in 30% of treated eyes during the 12-month study follow-up period. This needs to be taken into account when interpreting these results.
In the UK, NICE recommends the use of FAc only in DME-affected eyes that have an artificial lens and are insufficiently responsive to other treatmentsCitation20. Of the treated eyes in the ICE-UK study cohort, 90% were pseudophakic, with a further 6% receiving a cataract operation on the same day as the FAc implant; 97% of eyes had previously been treated with at least one anti-VEGF, steroid or laser therapy prior to index.
In the FAME trial—randomized with a sham injection—it was found that 29% of eyes treated with 0.2 µg/day FAc intravitreal implant achieved a 15-letter improvement in visual acuity at 24 months following implant insertion vs 16% (p = .002) in the sham-treated groupCitation3. Of those patients randomized to 0.2 µg/day FAc implant, 23% demonstrated ≥15 letter improvement in visual acuity over baseline at 12 monthsCitation3. At 12 months post-implant, we similarly found that 18% of treated eyes achieved an improvement in visual acuity of ≥15 letters.
Compared with FAME, there was a higher percentage of people with type 1 diabetes in the ICE study cohortCitation3. In addition, the people included in the ICE study were generally older, with a higher proportion of treated eyes with a pseudophakic lensCitation3. Visual acuity at implant was lower in this study (median LogMAR 0.66 units, converting to an ETDRS score of 47 letters compared with a mean of 53.4 letters in the FAME study)Citation3. Cunha-Vaz et al.Citation21 reported that the percentage of people in the FAME trial that gained a 15-letter improvement in visual acuity following implant was significantly higher in those with chronic DME vs those with non-chronic DME. Unfortunately, chronicity of DME was not recorded in the ICE-UK study. However, the highest percentage of people achieving a ≥15-letter improvement in ETDRS score at 12 months was observed in those with poorer vision at implant (≥0.7 LogMAR units) and a history of receiving a greater number of anti-VEGF, steroid or laser treatments (more than six). Bailey and colleagues conducted an electronic medical record based study across 14 UK clinical sites and reported that 15.0% of FAc treated eyes obtained a ≥15-letter improvement in visual acuity after 12 months follow-upCitation22. This increased to 20.8% after 24 months follow-upCitation22. In a retrospective study by Elaraoud et al.Citation14, an improvement in visual acuity and central retinal thickness was observed in 15 out of 22 pseudophakic eyes treated with FAc intravitreal implant, the majority of which had been previously treated with multiple anti-VEGF and laser therapies. In a recent retrospective study by El-Ghrably et al.Citation17, five out of 22 eyes (22.7%) achieved an increase in ETDRS letter score of ≥15 letters at 12 months. As with this study, a small decrease in visual acuity was reported between 6–12 months post-FAc implantCitation17.
In the FAME study, the most commonly reported adverse event was cataract surgery, which was listed as an adverse event in 75% of the low-dose group, 85% of the high-dose group, and 23% of the sham group after 24 months of follow-up in those with no history of cataract surgery at implantCitation3. At 36 months, cataracts were reported in 82%, 89%, and 50% of the people with no prior history of cataract surgery in each of the groups, respectivelyCitation2. In this study, 19 cataract operations were observed between 0–3 months post-implant, where 14 of these operations were carried out on the day of implant. However, cataract development is likely to have pre-dated FAc implant in these cases and it is probable that these operations were carried out on pre-existing conditions. No cataract surgeries were recorded between 3–12 months post-implant. However, the high proportion of treated eyes with a pseudophakic lens at implant needs to be considered when interpreting this observation (90% vs 35% in the FAME study)Citation3.
Steroids are known to be associated with raised intraocular pressure and the FAc 190 µg intravitreal implant is contraindicated in people with glaucoma. Although the number of patients with glaucoma at the time of implant was not known, 19% of study eyes had been treated with IOP-lowering therapy prior to insertion of the FAc implant in the current studyCitation3. Following FAc implant, a small but statistically significant increase in IOP was found at 3, 6, and 12 months. However, the median IOP remained below 21 mmHg. Of the eyes with no history of receiving IOP-lowering therapy prior to FAc intravitreal implant, 15% were prescribed IOP-lowering therapy between 0–12 months post-implant. IOP-lowering surgery was required in only one eye between 3–6 months post-implant and in one eye at 6–12 months post-index. The first eye (treated between 3–6 months post-implant) had a history of IOP-lowering therapy prior to implant. The second eye had no history of glaucoma prior to implant. In the FAME trials, people with glaucoma were excluded. A higher proportion of treated eyes required glaucoma surgery in the FAME study, where laser trabeculoplasty and incisional IOP-lowering surgery were carried out in 1.3% and 4.8% of eyes treated with the 0.2 µg/day FAc implant and 0% and 0.5% of those treated with sham, respectivelyCitation2. However, IOP increases were manageable and did not affect vision outcomesCitation23. In the FAME trials, FAc was not associated with significant glaucomatous changes in the optic nerve head in those with or without raised IOPCitation24.
Strengths and limitations
Several measures were taken to maintain consistency in data entry. All data-entry personnel received one-to-one training and continued support. Eligibility criteria were checked both prior to data entry and after any new record had been entered. The online database included partial validation upon data entry, and the user interface and data entry processes were designed to minimize errors and achieve consistency between centers. New data entered were checked daily for irregularities, and data entry progress was monitored and logged.
As this is an observational study, several limitations may occur. Retrospective studies are subject to bias and confounding, and can only be used to infer association and not causation. Medical records may be incomplete for patients who switch ophthalmology centers. Recording of procedures occurring near the end of the study observation period (April 15, 2016) may also be incomplete. Misclassification of outcomes, effectiveness, and safety may have occurred, although data were taken from patient notes and electronic medical records. As data were collected from routine secondary care, outcomes were not measured at set times post-index. Individual information on exposures and outcome was not consistently available across all participating centers for all the time points planned in the analysis. Last observation carried forward minimized the elimination of individuals from the analysis, but can produce a biased estimate of treatment effect and smaller standard errors. However, as visual acuity continued to improve over the follow-up period, we believe that the use of last observation carried forward will provide a conservative estimate of the effectiveness of FAc. However, for IOP, which continued to worsen over the period of follow-up, the results may be optimistic. Recall of participants for review may have led to differential misclassification and missing values. Duration of diagnosed DME was not recorded. Unfortunately, information recorded for lens status and cataract status was inconsistent in some people, potentially leading to misclassification. Data on lens status and cataract operations for each eye were scrutinized in order to classify phakic and pseudophakic lens status at implant and the presence of cataract operations post-implant. However, some eyes were classified as having a pseudophakic lens at index date, but had no history of receiving a cataract operation. Visual acuity scores recorded on the same date as the first administration of FAc intravitreal implant were assumed to have been measured prior to implant. Analysis was restricted to 12 months follow-up post-implant, because available follow-up after this date varied from person to person.
First and second treated eyes from the same individual were analyzed as independent observations. However, FAc implant in a second eye may be more likely if the first eye responded positively to FAc implant. In addition, bilateral treatment with FAc implant may be more likely to occur at certain treatment centers.
The date on which age and duration of diabetes was recorded was not documented. Therefore, it was not possible to determine the subject’s exact age or their duration of diabetes at implant. The dataset included other parameters where a specific event date was not recorded (lens status, visual acuity score, central foveal thickness, and IOP). In these cases, the date of the event was defined as the review date. Due to the retrospective nature of the ICE-UK study, it was not possible to ensure that visual acuity was recorded using the same standardized method. Visual acuity was recorded as one of: Snellen fraction, ETDRS letter score, or LogMAR unit. Conversion was required for data analysis, and the method adopted by Gregori et al.Citation18 was used. However, the use of a standardized method for measuring visual acuity using ETDRS letter score is likely to have provided more accurate visual acuity measurements. People who could only count fingers or detect movement or light at implant were attributed a LogMAR score of 2.3, the LogMAR score applied to people who can count fingers. Therefore, visual acuity on the LogMAR scale was over-estimated in those people that could only detect movement or light.
Conclusion
In the 12 months prior to FAc implantation, a decline in visual acuity was observed. Following FAc implantation, an overall improvement in visual acuity was observed over a period of 12 months. A small but significant increase in IOP was observed following FAc implant, which required emergent IOP-lowering therapy in 15% of FAc-treated eyes.
Transparency
Declaration of funding
This study was supported by Alimera Sciences, the manufacturer of Iluvien 190 µg intravitreal implant, who designed the study and commented on the manuscript.
Declaration of financial/other relationships
SH is employed by and CJC is a director of Pharmatelligence, a research consultancy receiving funding from Alimera Sciences for the submitted work and from other healthcare related organizations. DRO has received sponsorship from Sanofi to attend the American Diabetes Association Meeting, San Diego, June 2017. Peer reviewers on this manuscript have received an honorarium from CMRO for their review work, but have no other relevant financial relationships to disclose.
Previous presentations
These results have been presented at The Association for Research in Vision and Ophthalmology (ARVO) 2017 meeting, International Society for Pharmacoeconomics and Outcomes Research (ISPOR) 22nd Annual International Meeting 2017, 17th EURETINA Congress 2017, and the Royal College of Ophthalmology (RCOphth) Congress 2017.
Supplemental material
Download MS Word (2.4 MB)Acknowledgments
The authors thank Annette Beiderbeck of Alimera Sciences for designing the study and commenting on the manuscript. We acknowledge the contributions of the staff at the following ICE-UK study centres: New Cross Hospital, Wolverhampton; Maidstone Hospital, Maidstone; Bristol Eye Hospital, Bristol; Royal Victoria Hospital, Belfast; The James Cook University Hospital, Middlesborough; University Hospital, Norfolk; Sunderland Eye Infirmary, Sunderland; Royal Hallamshire Hospital, Sheffield; Royal Surrey County Hospital, Guildford; Queen Elizabeth Hospital, Birmingham; Moorfields Eye Hospital, London; Sandwell General Hospital, West Bromwich; and Royal Free Hospital, London. Particularly, the authors thank Prof Yit Yang who was instrumental in project development, selection of clinically relevant endpoints, development of the protocol and study design. We also thank Prof Yit Yang for his comments on the draft manuscript. The authors thank SVMPharma for collating the data, Dafydd Williams for initial data preparation and analysis, and Sara Jenkins-Jones for her editorial work.
Related Research Data
References
- Medicines and Healthcare Products Regulatory Agency. Public assessment report mutual recognition procedure ILUVIEN® 190 micrograms intravitreal implant in applicator (fluocinolone acetonide). 2015. Available at: http://www.mhra.gov.uk/home/groups/par/documents/websiteresources/con171936.pdf. [Last accessed December 6, 2016]
- Campochiaro PA, Brown DM, Pearson A, et al. Sustained delivery fluocinolone acetonide vitreous inserts provide benefit for at least 3 years in patients with diabetic macular edema. Ophthalmology 2012;119:2125-32
- Campochiaro PA, Brown DM, Pearson A, et al. Long-term benefit of sustained-delivery fluocinolone acetonide vitreous inserts for diabetic macular edema. Ophthalmology 2011;118:626-35
- Early Treatment Diabetic Retinopathy Study research group. Photocoagulation for diabetic macular edema. Early Treatment Diabetic Retinopathy Study report number 1. Arch Ophthalmol 1985;103:1796-806
- Wells JA, Glassman AR, Ayala AR, et al. Aflibercept, bevacizumab, or ranibizumab for diabetic macular edema. Two-year results from a comparative effectiveness randomized clinical trial. Ophthalmology 2016;123:1351-9
- Brown DM, Nguyen QD, Marcus DM, et al. Long-term outcomes of ranibizumab therapy for diabetic macular edema: the 36-month results from two phase III trials: RISE and RIDE. Ophthalmology 2013;120:2013-22
- Elman MJ, Ayala A, Bressler NM, et al. Intravitreal ranibizumab for diabetic macular edema with prompt vs. deferred laser treatment: 5-year randomized trial results. Ophthalmology 2015;122:375-81
- The Diabetic Retinopathy Clinical Research Network. Aflibercept, bevacizumab, or ranibizumab for diabetic macular edema. N Engl J Med 2015;372:1193-203
- European Medicines Agency. Questions and answers following the initial experience of the Adaptive Licensing Pilot project; 2014. Available at: http://www.ema.europa.eu/docs/en_GB/document_library/Other/2014/09/WC500172810.pdf. [Last accessed February 21, 2017]
- Rakic J-M, Leys A, Brié H, et al. Real-world variability in ranibizumab treatment and associated clinical, quality of life, and safety outcomes over 24 months in patients with neovascular age-related macular degeneration: the HELIOS study. Clin Ophthalmol 2013;7:1849-58
- Souied EH, Oubraham H, Mimoun G, et al. Changes in visual acuity in patients with wet age-related macular degeneration treated with intravitreal ranibizumab in daily clinical practice. Retina 2015;35:1743-9
- Figueira J, Henriques J, Amaro M, et al. A nonrandomized, open-label, multicenter, phase 4 pilot study on the effect and safety of ILUVIEN® in chronic diabetic macular edema patients considered insufficiently responsive to available therapies (RESPOND). Ophthalmic Res 2017;57:166-72
- Schmit-Eilenberger VK. A novel intravitreal fluocinolone acetonide implant (Iluvien(R)) in the treatment of patients with chronic diabetic macular edema that is insufficiently responsive to other medical treatment options: a case series. Clin Ophthalmol 2015;9:801-11
- Elaraoud I, Andreatta W, Kidess A, et al. Use of flucinolone acetonide for patients with diabetic macular oedema: patient selection criteria and early outcomes in real world setting. BMC Ophthalmol 2016;16:3
- Elaraoud I, Attawan A, Quhill F. Case series investigating the efficacy and safety of bilateral fluocinolone acetonide (ILUVIEN®) in patients with diabetic macular edema. Ophthalmol Ther 2016;5:95-104
- Massin P, Erginay A, Dupas B, et al. Efficacy and safety of sustained-delivery fluocinolone acetonide intravitreal implant in patients with chronic diabetic macular edema insufficiently responsive to available therapies: a real-life study. Clin Ophthalmol 2016;10:1257-64
- El-Ghrably I, Steel DHW, Habib M, et al. Diabetic macular edema outcomes in eyes treated with fluocinolone acetonide 0.2 µg/d intravitreal implant: real-world UK experience. Eur J Ophthalmol 2017;27:357-62
- Gregori NZ, Feuer W, Rosenfeld PJ. Novel method for analyzing snellen visual acuity measurements. Retina 2010;30:1046-50
- Haukoos JS, Newgard CD. Advanced statistics: missing data in clinical research—part 1: an introduction and conceptual Framework. Acad Emerg Med 2007;14:662-8
- National Institute for Health and Care Excellence. Fluocinolone acetonide intravitreal implant for treating chronic diabetic macular oedema after an inadequate response to prior therapy; 2013. Available at: www.nice.org.uk/guidance/ta301. [Last accessed October 24, 2014]
- Cunha-Vaz J, Ashton P, Iezzi R, et al. Sustained delivery fluocinolone acetonide vitreous implants: long-term benefit in patients with chronic diabetic macular edema. Ophthalmology 2014;121:1892-903
- Bailey C, Chakravarthy U, Lotery A, et al. Real-world experience with 0.2 μg/day fluocinolone acetonide intravitreal implant (ILUVIEN) in the United Kingdom. Eye 2017 (epub ahead of print)
- Parrish RK, Campochiaro PA, Pearson PA, et al. Characterization of intraocular pressure increases and management strategies following treatment with fluocinolone acetonide intravitreal implants in the fame trials. Ophthalmic Surg Lasers Imaging Retin 2016;47:426-35
- Parrish RK, Traverso CE, Green K, et al. Quantitative assessment of optic nerve changes in patients with diabetic macular edema treated with fluocinolone acetonide vitreous implants. Ophthalmic Surg Lasers Imaging Retin 2016;47:418-25