
Abstract
Objective: To assess the safety and efficacy of ertugliflozin over 104 weeks in patients with type 2 diabetes mellitus (T2DM) inadequately controlled on metformin.
Methods: In this double-blind, multicenter, randomized, phase III study (VERTIS SU; NCT01999218), adults with T2DM and glycated hemoglobin (HbA1c) 7.0–9.0% on metformin ≥1500 mg/day received ertugliflozin 5 mg or 15 mg, or glimepiride. The primary efficacy time point was Week 52; double-blinded treatment continued until Week 104.
Results: Baseline characteristics of randomized, treated patients (n = 1315) were similar across groups (mean age 58.2 years, HbA1c 7.8%); 76.4% completed the study; 61.6% completed on study medication. Mean glimepiride dose at 104 weeks was 3.5 mg/day. At Week 104, least squares mean change from baseline in HbA1c (95% confidence intervals) were −0.3% (−0.4, −0.2), −0.4% (−0.5, −0.3) and −0.4% (−0.5, −0.3) for ertugliflozin 5 mg, 15 mg, and glimepiride, respectively. Ertugliflozin provided sustained reductions in body weight and systolic blood pressure (SBP) over 104 weeks. The incidence of adverse events (AEs) and serious AEs was similar across groups. The incidence of symptomatic hypoglycemia was 3.8%, 6.4% and 22.1% in the ertugliflozin 5 mg, 15 mg, and glimepiride groups, respectively. Genital mycotic infections were reported in 5.3%, 2.6% and 0% of men, respectively, and 9.2%, 12.3% and 1.4% of women, respectively. The incidence of urinary tract infection and hypovolemia AEs was similar across groups.
Conclusions: Ertugliflozin was well tolerated and provided clinically meaningful glycemic control and durable reductions in body weight and SBP over 104 weeks.
Trial registration: ClinicalTrials.gov identifier: NCT01999218.
1. Introduction
Metformin is the current guideline-recommended first-line pharmacotherapy for the treatment of type 2 diabetes mellitus (T2DM), although many individuals with T2DM require add-on therapies over time to maintain glycemic controlCitation1. Various factors, including efficacy, hypoglycemia risk, body weight effects, and cardiovascular or renal effects should be considered when choosing second- and third-line agentsCitation1. Sulfonylureas (SUs), although commonly used as a second-line therapy, are associated with an increased risk of hypoglycemia and weight gainCitation1. They have neutral effects on the progression of diabetic kidney disease, but their cardiovascular safety remains to be establishedCitation1,Citation2. Conversely, the latest class of agents approved for the treatment of T2DM, sodium–glucose cotransporter 2 (SGLT2) inhibitors, are associated with a low risk of hypoglycemia and reductions in body weight and blood pressure (BP)Citation1. Furthermore, slowed progression of kidney disease and a lower incidence of cardiovascular events (composite of death from cardiovascular causes, nonfatal myocardial infarction or nonfatal stroke) were reported in the two available cardiovascular outcome studies of SGLT2 inhibitorsCitation3–5.
Ertugliflozin is a highly selective SGLT2 inhibitor that was recently approved by the US Food and Drug Administration and the European Medicines Agency to improve glycemic control in adults with T2DM, following review of data from the VERTIS (eValuation of ERTugliflozin effIcacy and Safety) clinical programCitation6,Citation7. Ertugliflozin (as monotherapy, or as add-on to metformin or to metformin and sitagliptin) provided improved glycemic control and reductions in body weight and BPCitation8–12, with effects maintained over 52 weeksCitation10,Citation12,Citation13.
In the VERTIS SU study, the long-term safety and efficacy of ertugliflozin (5 mg and 15 mg) were assessed in adult patients with T2DM and inadequate glycemic control on metformin. In the first 52 week treatment period of the study, ertugliflozin 15 mg was noninferior to glimepiride in reducing glycated hemoglobin (HbA1c) from baselineCitation14. Here, we describe the long-term safety and efficacy of ertugliflozin, as add-on to metformin, over 104 weeks.
2. Methods
2.1. Study design
Protocol MK-8835-002 was a randomized, multicenter, double-blind, active-controlled phase III clinical study (VERTIS SU; ClinicalTrials.gov identifier: NCT01999218) conducted over 104 weeks in two 52 week phases. The primary time point for efficacy analysis was Week 52 (Phase A); treatment was continued in a blinded extension period until Week 104 (Phase B). No hypothesis testing was conducted for Week 104 efficacy data.
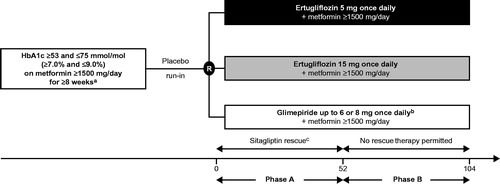
The study design has been reported previouslyCitation14. Briefly, eligible patients were randomized in a 1:1:1 ratio to receive ertugliflozin 5 mg once daily (QD), ertugliflozin 15 mg QD or glimepiride (titrated from 1 mg up to 6 or 8 mg QD according to the local country label or maximum tolerated dose; ). The dose of glimepiride/matching placebo could be up- and/or down-titrated throughout the 104 week treatment period based on fingerstick glucose determination performed at the clinic or at home and by the investigators’ assessment of the patient’s glycemic status.
Figure 1. Design of the VERTIS SU study. X-axis values are weeks. aPatients on one of the following regimens were also eligible to enter the screening period, and could enroll in the study if they met entry criteria after the wash-off/dose titration/stabilization period: on metformin monotherapy ≥1500 mg/day <8 weeks, HbA1c ≥7.0% and ≤9.0% (≥53 mmol/mol and ≤75 mmol/mol) – patients were to maintain metformin dose ≥1500 mg/day for ≥8 weeks; on metformin monotherapy <1500 mg/day and with HbA1c ≥7.5% and ≤9.5% (≥58 mmol/mol and ≤80 mmol/mol) – patients were titrated to metformin ≥1500 mg/day and were to maintain metformin dose for ≥8 weeks; on metformin + single allowable antihyperglycemic agentd and HbA1c ≥6.5% and ≤8.5% (≥48 mmol/mol and ≤69 mmol/mol) – patients were to discontinue non-metformin AHA, titrate metformin to ≥1500 mg/day (if necessary), and maintain metformin dose ≥1500 mg/day for ≥8 weeks (≥10 weeks for patients discontinuing SU therapy). bGlimepiride was initiated at 1 mg once daily and up-titrated to a maximum of 6 or 8 mg/day according to the local label or maximum tolerated dose. cPatients rescued with sitagliptin in Phase A were not eligible to enter Phase B; patients were not rescued during Phase B. dThis included SUs at <50% of the maximum approved dose in the local country label, dipeptidyl peptidase-4 inhibitors, meglitinides or alpha glucosidase inhibitors. Abbreviations. AHA, Antihyperglycemic agent; HbA1c, Glycated hemoglobin; SU, Sulfonylurea; R, Randomization.
Randomization was performed centrally using a computer-generated randomization schedule. A set of sponsor personnel were unblinded at the completion of the 52 week Phase A portion of the study (defined as database lock), to permit authoring of the Phase A clinical study report to support regulatory submission of a new drug application. Study personnel directly involved in the medical monitoring, including investigators and patients, remained blinded for the study duration.
Patients who received sitagliptin rescue therapy during Phase A were not permitted to participate in Phase B. During Phase B, patients who were on the maximum labeled dose or maximum tolerated dose of glimepiride/matching placebo for at least 2 weeks and who met glycemic rescue criteria (fasting plasma glucose [FPG] consistently >11.1 mmol/L or HbA1c >8.0% [64 mmol/mol]) were discontinued from study medication but remained in the study for safety follow-up until Week 104.
Patients who discontinued treatment with study medication for reasons other than withdrawn consent (including patients who discontinued treatment due to meeting glycemic rescue criteria in Phase B) were to attend the clinic for a study medication discontinuation visit followed by a post-treatment telephone call 14 days after the last dose of study medication. Thereafter, patients were followed by telephone according to the study visit schedule until the end of the trial (Week 104). The purpose of the telephone contacts, as well as the 14 day post-treatment telephone call, was to collect information about patients’ health status (e.g. to evaluate whether the patient experienced any serious adverse events [SAEs] or events eligible for adjudication). Events for adjudication included serious cardiovascular events, venous thromboembolic events, all deaths, fractures, pancreatitis, acute renal failure and liver injury. Data relating to glycemic parameters, vital signs, body weight and serum chemistry were not captured from patients who were discontinued.
The study was conducted in accordance with principles of Good Clinical Practice and was approved by the appropriate institutional review boards and regulatory agencies. Written consent was obtained from individuals included in this study. The protocol and statistical analysis plan were developed by the sponsors in consultation with an external Scientific Advisory Committee. The protocol was amended on 26 February 2015 to clarify that patients would initially receive glimepiride/matching placebo in the form of tablets and would be switched to glimepiride/matching placebo capsules during the study.
2.2. Patient population
Eligibility criteria have been reported previouslyCitation14. Briefly, patients aged ≥18 years with T2DM and inadequate glycemic control (HbA1c ≥7.0% and ≤9.0% [≥53 and ≤75 mmol/mol]) on metformin monotherapy (≥1500 mg/day for ≥8 weeks) were eligible (). Key exclusion criteria included a history of type 1 diabetes mellitus or ketoacidosis; unstable weight (≥5% change in body weight in previous 6 months); a history of myocardial infarction, unstable angina, arterial revascularization, stroke, transient ischemic attack or New York Heart Association functional class III–IV heart failure within 3 months of screening; any active, obstructive uropathy or indwelling urinary catheter; mean value for triplicate sitting systolic BP (SBP) >160 mmHg and/or diastolic BP (DBP) >90 mmHg (patients on BP medication must have been on a stable regimen for at least 4 weeks prior to randomization); estimated glomerular filtration rate (eGFR) <55 mL/min/1.73 m2; or serum creatinine ≥115 µmol/L in men or ≥106 µmol/L in women.
2.3. Efficacy assessments
Efficacy endpoints were change from baseline at Week 104 in HbA1c, FPG, body weight, SBP and DBP; the proportion of patients with HbA1c <7.0% (53 mmol/mol) at Week 104 was also evaluated. Composite endpoints assessed at Week 104 were: (1) the proportion of patients with HbA1c reduction >0.5% (5.5 mmol/mol) with no symptomatic hypoglycemia or body weight gain; and (2) the proportion of patients with HbA1c <7.0% (53 mmol/mol) with no symptomatic hypoglycemia. Body weight was measured in duplicate using a standardized digital scale. Sitting BP was measured in triplicate with an automated oscillometric BP measuring device.
2.4. Safety assessments
The occurrences of adverse events (AEs) and SAEs were recorded. AEs of special interest were symptomatic hypoglycemia (episodes with clinical symptoms reported by the investigator – biochemical documentation was not required), AEs associated with urinary tract infection (UTI), genital mycotic infection (GMI) and hypovolemia. Documented hypoglycemia (glucose level ≤3.9 mmol/L, symptomatic or asymptomatic) and severe hypoglycemia (episodes that required medical or non-medical assistance) were also recorded. Safety evaluation also included calculating changes over time in laboratory parameters (and recording occurrences exceeding pre-defined limits of change) in eGFR, low-density lipoprotein cholesterol (LDL-C), high-density lipoprotein cholesterol (HDL-C) and hemoglobin. Vital signs, electrocardiographic parameters and the occurrence of fractures were also recorded.
2.5. Statistical analysis
Hypothesis testing for efficacy endpoints was conducted for the Week 52 time pointCitation14. No hypothesis tests were performed for Week 104 efficacy endpoints. Efficacy analyses excluded results following the initiation of glycemic rescue therapy to avoid the confounding influence of rescue therapy. Analyses were conducted in the full analysis set (FAS) (all randomized patients who received ≥1 dose of study medication and had ≥1 assessment of the respective endpoint) and in the per protocol (PP) population (all randomized patients who took ≥1 dose of study medication, with a measurement of the analysis endpoint at baseline and Week 104, and without significant protocol deviations). Analyses of continuous endpoints in the FAS were based on a longitudinal data analysis (LDA) model, with fixed effects for treatment, time, prior antihyperglycemic medication (monotherapy or dual therapy), baseline eGFR (continuous) and the interaction of time by treatment. Time was treated as a categorical variable. The proportion of patients with HbA1c <7.0% (53 mmol/mol) was evaluated with a logistic regression model with fixed effects for treatment and prior antihyperglycemic medication, and covariates for baseline HbA1c and baseline eGFR; missing HbA1c data was imputed via multiple imputation using the LDA model. Between-group differences in composite endpoints were analyzed using the Miettinen and Nurminen methodCitation15 in conjunction with the last-observation-carried-forward approach for handling missing HbA1c and body weight values at Week 104. Analysis of change from baseline in HbA1c at Week 104 was also performed in the PP population using an analysis of covariance (ANCOVA) model.
Safety analyses included all randomized patients who received at least one dose of study treatment. AE analyses included all AEs from randomization to 14 days after the final dose of study medication. Events that occurred following the initiation of glycemic rescue medication were excluded from the analysis of hypoglycemia but included for the analysis of all other safety parameters. Between-group differences for pre-specified AEs were assessed using the Miettinen and Nurminen method to generate p values and 95% confidence intervalsCitation15. The percent changes from baseline in LDL-C and HDL-C were analyzed using the LDA method described above.
3. Results
The study was conducted at 232 sites across 16 countries (Supplementary Materials). The study started on 17 December 2013 and the last patient completed Phase B on 18 April 2017.
3.1. Patient disposition and baseline characteristics
A total of 1326 patients were randomized into Phase A of the study. In the current analysis of Phase A + B data (i.e. from baseline to Week 104), 1315 patients were included in the FAS; 10 patients from one site were excluded (from all Phase A + B analyses) due to good clinical practice (GCP) inspection findings; in addition, one patient did not receive study medication (Supplementary Figure 1).
Baseline demographics and disease characteristics were generally similar between treatment groups, except for a lower proportion of male patients in the ertugliflozin 15 mg group (). The mean duration of T2DM was 7.4 years, mean baseline HbA1c 7.8% (62 mmol/mol), mean FPG 8.9 mmol/L and mean eGFR 87.2 mL/min/1.73 m2.
Table 1. Demographics and baseline disease characteristics.
Of the 1326 randomized patients in Phase A, 1045 patients completed Phase A and 1037 entered Phase B (337, 351 and 349 in the ertugliflozin 5 mg, ertugliflozin 15 mg and glimepiride groups, respectively). Overall, 55 patients received sitagliptin rescue therapy in Phase A and were excluded from Phase B, per protocol (ertugliflozin 5 mg, n = 25; ertugliflozin 15 mg, n = 16; glimepiride, n = 14). During Phase B, 91 patients were discontinued due to meeting the hyperglycemia rescue criterion (ertugliflozin 5 mg, n = 33; ertugliflozin 15 mg, n = 27; glimepiride, n = 31). In total, 1006 (76.4%) completed the study (Supplementary Figure 1) and 811 (61.6%) completed on study medication (260 [58.4%], 278 [63.8%] and 273 [62.8%] in the ertugliflozin 5 mg, ertugliflozin 15 mg and glimepiride groups, respectively). Of these, 778 patients were included in the PP analysis population.
3.2. Efficacy
Mean changes from baseline in HbA1c at Week 104 were similar across treatment groups in the FAS population (; ). Initial reductions in HbA1c at Week 52 were followed by a gradual attenuation of response from Week 52 to Week 104. Less attenuation of HbA1c lowering was seen in the PP population in all treatment arms (). The mean and median doses of glimepiride, over the study period of 104 weeks, were both 3.5 mg/day (as opposed to 3.0 mg over the first 52 weeks). Furthermore, during the last 7 days of the study, approximately 60% of patients in the glimepiride group were receiving ≥4 mg/day glimepiride.
Figure 2. Change from baseline over time in (A) HbA1c (FAS), (B) HbA1c (per protocol analysis), (C) body weight (FAS) and (D) SBP (FAS), through Week 104. Vertical dashed line indicates Week 52 (primary time point). Abbreviations. BL, Baseline; FAS, Full analysis set; HbA1c, Glycated hemoglobin; LS, Least squares; SBP, Systolic blood pressure; SE, Standard error.
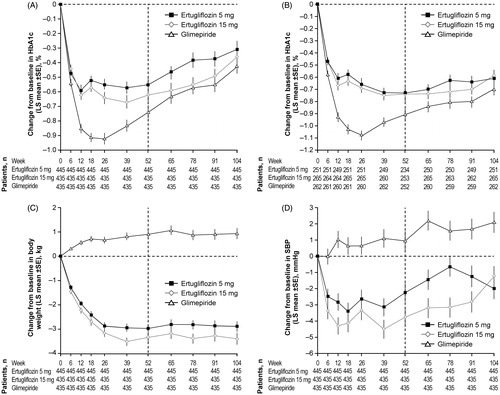
Table 2. Summary of glycemic-related endpoints.
The percentages of patients with HbA1c <7.0% (53 mmol/mol) at Week 104 were similar across treatment groups (). Mean reduction from baseline in FPG at Week 104 was greater in the ertugliflozin 15 mg group than in the glimepiride group, while reductions were similar in the ertugliflozin 5 mg and glimepiride groups (Supplementary Figure 2(A); ).
Body weight reductions observed at Week 52 in the ertugliflozin groups were maintained through Week 104 (). The least squares mean reductions from baseline in body weight at Week 104 were greater in both ertugliflozin groups compared with the glimepiride group, in which an increase in body weight was observed ().
Table 3. Summary of other efficacy endpoints at Week 104 (full analysis set).
Reductions from baseline in SBP were observed in the ertugliflozin groups at Week 104 (; ). Least squares mean reductions from baseline in DBP were observed in both ertugliflozin groups (Supplementary Figure 2(B); ). In contrast, increases in SBP and DBP were seen in the glimepiride group at Week 104.
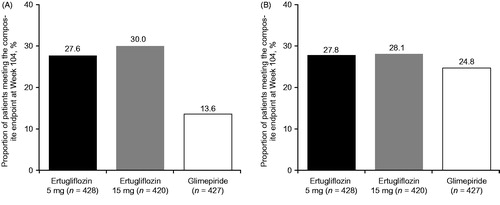
Relative to glimepiride, a higher proportion of patients in the ertugliflozin groups achieved the composite endpoint of a HbA1c decrease >0.5% (5.5 mmol/mol) with no symptomatic hypoglycemia and no body weight gain (). No differences were observed between ertugliflozin and glimepiride in terms of patients achieving HbA1c <7.0% (53 mmol/mol) with no symptomatic hypoglycemia ().
Figure 3. Proportion of patients meeting composite endpoint at Week 104 of (A) HbA1c reduction >0.5% (5.5 mmol/mol) with no symptomatic hypoglycemia or body weight gain and (B) HbA1c <7.0% (53 mmol/mol) with no symptomatic hypoglycemia. Abbreviation. HbA1c, Glycated hemoglobin.
3.3. Safety
The incidence of AEs and drug-related AEs was similar across treatment groups (). The incidence of SAEs was similar across the study groups (); events were distributed across multiple system organ classes and few occurred in more than one patient in any group. The incidence of discontinuations due to an AE was similar across treatment groups. Ten deaths were reported during the study: seven (1.6%), two (0.5%) and one (0.2%) in the ertugliflozin 5 mg, ertugliflozin 15 mg and glimepiride groups, respectively (). None of the AEs leading to deaths was considered to be drug-related; five of the 10 fatal events across the three groups were related to cardiovascular death. Of the remaining fatal events: one was related to multiple organ dysfunction syndrome, two were related to infections (pneumonia and septic shock), one was related to depression and one was related to chronic obstructive pulmonary disease.
Table 4. Summary of overall safety and prespecified AEs.
The incidence of symptomatic hypoglycemia was significantly lower in both ertugliflozin groups compared with the glimepiride group (both p < .001; ). Severe hypoglycemia was reported in one (0.2%), one (0.2%) and 15 (3.4%) patients in the ertugliflozin 5 mg, ertugliflozin 15 mg and glimepiride groups, respectively, through Week 104. Documented hypoglycemia (symptomatic or asymptomatic) was lower in the ertugliflozin 5 mg (34 [7.6%]) and 15 mg (48 [11.0%]) groups relative to glimepiride (135 [31.0%]) through Week 104. The incidence of AEs associated with GMI was significantly higher in male and female patients receiving ertugliflozin 5 mg or 15 mg compared with patients receiving glimepiride (). No significant differences were observed between ertugliflozin (5 mg or 15 mg) and glimepiride in the incidence of AEs associated with UTI or hypovolemia ().
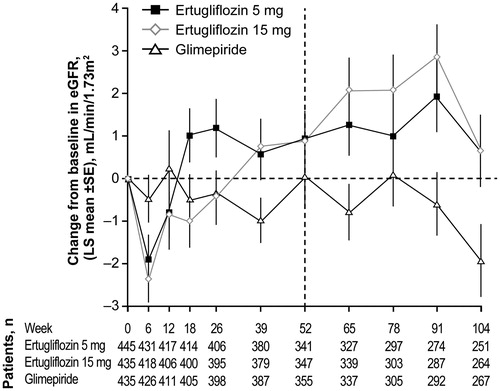
Transient and modest mean reductions in eGFR were observed in the ertugliflozin groups. Mean values returned to or near baseline afterwards; at the end of the study, mean eGFR levels were higher than baseline in the ertugliflozin groups, and lower than baseline in the glimepiride group ().
Figure 4. Change from baseline over time in eGFR through Week 104. Abbreviations. BL, Baseline; eGFR, estimated glomerular filtration rate; LS, Least squares; SE, Standard error.
AEs of decreased eGFR or increased creatinine occurred in eight (1.8%), four (0.9%) and three (0.7%) of patients receiving ertugliflozin 5 mg, ertugliflozin 15 mg and glimepiride, respectively.
Renal-related AEs (preferred terms included acute kidney injury, chronic kidney disease, renal impairment, nephropathy and diabetic nephropathy) were reported in four (0.9%), five (1.1%) and six (1.4%) patients in the ertugliflozin 5 mg, ertugliflozin 15 mg and glimepiride groups, respectively. Two patients in the ertugliflozin 15 mg group experienced an AE of acute kidney injury, one reported as serious and the other as non-serious. Both AEs resulted in discontinuation of study medication. No other renal-related AEs were considered serious or resulted in discontinuation.
Greater increases from baseline in HDL-C at Week 104 were observed in the ertugliflozin groups compared with the glimepiride group, in which a small decrease was seen (Supplementary Table S1). Changes from baseline in LDL-C were generally similar between treatment groups (Supplementary Table S1). A small increase in hemoglobin level was initially seen at Week 12 in both ertugliflozin groups, remaining stable through Week 104. Hemoglobin levels in the glimepiride group remained stable throughout the study.
A total of 12 patients had adjudication-confirmed fractures (five, five and two in the ertugliflozin 5 mg, 15 mg and glimepiride groups, respectively). One patient in the ertugliflozin 15 mg group suffered two fractures.
4. Discussion
The results of this randomized, multicenter, double-blind, phase III study (VERTIS SU) support the long-term safety and efficacy of ertugliflozin 5 mg and 15 mg as add-on to metformin in patients with T2DM and inadequate glycemic control on metformin.
At Week 52, ertugliflozin 15 mg was noninferior to glimepiride in reducing HbA1c from baselineCitation14. While the findings in the FAS population showed a gradual attenuation in response across all treatment groups after Week 52, the PP population analysis showed sustained improvements in HbA1c over 104 weeks in all treatment groups. This population excluded patients who did not complete the study on medication, did not have an HbA1c measurement at Week 104 or had significant protocol deviations (43.6%, 39.2% and 39.8% of patients excluded in the ertugliflozin 5 mg, ertugliflozin 15 mg and glimepiride groups, respectively). The attenuation in HbA1c response in the FAS was also observed in the glimepiride group, despite the mean and median dose of glimepiride increasing from 3.0 mg/day over 52 weeks to 3.5 mg/day over 104 weeks and with approximately 60% of patients on ≥4 mg/day during the last week of the study. The administered glimepiride doses approximated the near maximal efficacy dose of 4 mg/day previously reportedCitation16. Attenuation of the HbA1c response over time is generally observed during treatment with any antihyperglycemic medication. For example, in the ADOPT (A Diabetes Outcome Progression Trial) study, which evaluated treatment with rosiglitazone, metformin or glyburide monotherapy over 5 years, after a sharp decline in HbA1c in the first 4–12 months of therapy, HbA1c values gradually returned to or above baseline over timeCitation17.
In this study, the additional beneficial effects of ertugliflozin on body weight and SBP observed at Week 52 were sustained through Week 104. Ertugliflozin was also generally well tolerated over 2 years. No discernible pattern of SAEs was observed, and no deaths were considered related to study medication. Approximately three times more patients in the glimepiride group than in the ertugliflozin groups reported symptomatic hypoglycemia, and severe hypoglycemia was also more frequent with glimepiride compared with ertugliflozin. Over the 52 week extension, one patient in the ertugliflozin 5 mg and five patients in the glimepiride groups experienced severe hypoglycemia. In line with other studies from the VERTIS clinical program, a significantly higher incidence of GMIs was observed with ertugliflozin, but a comparable incidence of UTIs and hypovolemia AEs, relative to the comparatorCitation8,Citation10,Citation12,Citation18.
Studies evaluating the long-term effects of SGLT2 inhibitors as add-on therapies to metformin have reported reductions in HbA1c broadly within the same range as that observed in our studyCitation19–21. Similar reductions in body weight and SBP have also been reported in long-term studies of SGLT2 inhibitorsCitation19–23.
One limitation of the current study is that a smaller proportion of patients completed the study (76.4%) compared to Phase A (87.6%). This was in part due to the exclusion of patients who received glycemic rescue therapy during Phase A (5.6%, 3.6% and 3.2% for ertugliflozin 5 mg, ertugliflozin 15 mg and glimepiride, respectively), who were not permitted to enter Phase B, per protocol.
5. Conclusions
In summary, 2 years of treatment with ertugliflozin as add-on to metformin provided improved glycemic control and additional benefits compared with glimepiride in terms of reduced body weight and SBP, and lower incidence of hypoglycemia. A higher incidence of GMIs was reported with ertugliflozin compared with glimepiride.
Transparency
Declaration of funding
This manuscript was funded by Merck Sharp & Dohme Corp., a subsidiary of Merck & Co. Inc., Kenilworth, NJ, USA, in collaboration with Pfizer Inc.
Author contributions: J.H., J.J., G.G., J.P.M., .S.G.T. and S.S.E. contributed to the conception and design of the study. J.H., J.L. and B.L. collected data. P.H., J.J., J.L., Z.W.J., G.G., S.H., S.G.T., J.P.M., S.S.E. and B.L. contributed to the analysis and interpretation of data. All authors drafted the article or revised it critically for important intellectual content and provided final approval of the published version.
Declaration of financial/other relationships
P.H. has disclosed that she received funding and honoraria from Merck & Co. Inc., Kenilworth, NJ, USA, and Novo Nordisk. J.L., J.H., J.J., G.G., S.H. and S.S.E. have disclosed that they are employees of Merck Sharp & Dohme Corp., a subsidiary of Merck & Co. Inc., Kenilworth, NJ, USA, and may own stock and/or hold stock options in the company. Z.W.J. has disclosed that he was an employee of MSD R&D (China) Co. Ltd., a subsidiary of Merck & Co. Inc., Kenilworth, NJ, USA, at the time the study was conducted and may own stock and/or hold stock options in the company. B.L. has disclosed that he was an employee of Merck Sharp & Dohme Corp., a subsidiary of Merck & Co. Inc., Kenilworth, NJ, USA at the time the study was conducted, and may own stock and/or hold stock options in the company. S.G.T. and J.P.M. have disclosed that they are employees and shareholders of Pfizer Inc.
A reviewer on this manuscript has disclosed that they are an employee of Janssen R&D. A second reviewer has disclosed that they are involved in an investigator initiated study with ertugliflozin. CMRO peer reviewers on this manuscript have no other relevant financial or other relationships to disclose.
Supplemental Materials
Download MS Word (210.7 KB)Acknowledgements
The authors would like to thank the patients, their families and all investigators involved in this study. The results from this study were presented at the Annual European Association for the Study of Diabetes (EASD) Congress 2018. Critical reviewing and approval of a late draft was provided by Deng Wang MSc, an employee of MSD R&D (China) Co. Ltd., a subsidiary of Merck & Co. Inc., Kenilworth, NJ, USA, at the time the study was conducted. Statistical support was provided by Yanping Qiu MSc of MSD R&D (China) Co. Ltd., a subsidiary of Merck & Co. Inc., Kenilworth, NJ, USA, at the time the study was conducted. Medical writing support, including assisting authors with the development of the initial draft and incorporation of comments was provided by Laila Guzadhur PhD and Camille Bonomelli PhD; editorial support, formatting, proofreading and submission was provided by Nicola Jenkins MA, all of Scion, London, UK. This assistance was supported by Merck Sharp & Dohme Corp., a subsidiary of Merck & Co. Inc., Kenilworth, NJ, USA. Edward A. O’Neill PhD (Merck Sharp & Dohme Corp., a subsidiary of Merck & Co Inc., Kenilworth, NJ, USA) provided additional editing. The sponsor was involved in the study design, collection, analysis and interpretation of data, as well as data checking of information provided in the manuscript. However, ultimate responsibility for opinions, conclusions and data interpretation lies with the authors.
Data sharing
MSD’s data sharing policy, including restrictions, is available at http://engagezone.merck.com/ds_documentation.php. Requests for access to the clinical study data can be submitted through the EngageZone site or via email to [email protected].
Related Research Data
References
- American Diabetes Association. Pharmacologic approaches to glycemic treatment: standards of medical care in diabetes. Diabetes Care. 2018;41:S73–S85.
- Paneni F, Luscher TF. Cardiovascular protection in the treatment of type 2 diabetes: a review of clinical trial results across drug classes. Am J Cardiol. 2017;120:S17–S27.
- Zinman B, Wanner C, Lachin JM, et al. Empagliflozin, cardiovascular outcomes, and mortality in type 2 diabetes. N Engl J Med. 2015;373:2117–2128.
- Neal B, Perkovic V, Mahaffey KW, et al. Canagliflozin and cardiovascular and renal events in type 2 diabetes. N Engl J Med. 2017;377:644–657.
- Wanner C, Inzucchi SE, Lachin JM, et al. Empagliflozin and progression of kidney disease in type 2 diabetes. N Engl J Med. 2016;375:323–334.
- Merck Sharp & Dohme Corp a subsidiary of Merck & Co Inc. Steglatro (ertugliflozin). Prescribing information. 2017 [cited 2018 Jun 22]. Available from: https://www.accessdata.fda.gov/drugsatfda_docs/label/2017/209803s000lbl.pdf
- Merck Sharp & Dohme Corp a subsidiary of Merck & Co Inc. Steglatro summary of product characteristics. 2018 [cited 2018 Jun 22]. Available from: http://www.ema.europa.eu/docs/en_GB/document_library/EPAR_-_Product_Information/human/004315/WC500246918.pdf
- Terra SG, Focht K, Davies M, et al. Phase III, efficacy and safety study of ertugliflozin monotherapy in people with type 2 diabetes mellitus inadequately controlled with diet and exercise alone. Diabetes Obes Metab. 2017;19:721–728.
- Rosenstock J, Frias J, Pall D, et al. Effect of ertugliflozin on glucose control, body weight, blood pressure and bone density in type 2 diabetes mellitus inadequately controlled on metformin monotherapy (VERTIS MET). Diabetes Obes Metab. 2018;20:520–529.
- Dagogo-Jack S, Liu J, Eldor R, et al. Efficacy and safety of the addition of ertugliflozin in patients with type 2 diabetes mellitus inadequately controlled with metformin and sitagliptin: the VERTIS SITA2 placebo-controlled randomized study. Diabetes Obes Metab. 2018;20:530–540.
- Miller S, Krumins T, Zhou H, et al. Ertugliflozin and sitagliptin co-initiation in patients with type 2 diabetes: the VERTIS SITA randomized study. Diabetes Ther. 2018;9:253–268.
- Pratley RE, Eldor R, Raji A, et al. Ertugliflozin plus sitagliptin versus either individual agent over 52 weeks in patients with type 2 diabetes mellitus inadequately controlled with metformin: the VERTIS FACTORIAL randomized trial. Diabetes Obes Metab. 2018;20:1111–1120.
- Aronson R, Frias J, Goldman A, et al. Long-term efficacy and safety of ertugliflozin monotherapy in patients with inadequately controlled T2DM despite diet and exercise: VERTIS MONO extension study. Diabetes Obes Metab. 2018;20:1453–1460.
- Hollander P, Liu J, Hill J, et al. Ertugliflozin compared with glimepiride in patients with type 2 diabetes mellitus inadequately controlled on metformin: the VERTIS SU randomized study. Diabetes Ther. 2018;9:193–207.
- Miettinen O, Nurminen M. Comparative analysis of two rates. Stat Med. 1985;4:213–226.
- Goldberg RB, Holvey SM, Schneider J. A dose–response study of glimepiride in patients with NIDDM who have previously received sulfonylurea agents. The Glimepiride Protocol #201 Study Group. Diabetes Care. 1996;19:849–856.
- Kahn SE, Haffner SM, Heise MA, et al. Glycemic durability of rosiglitazone, metformin, or glyburide monotherapy. N Engl J Med. 2006;355:2427–2443.
- Hickman M, Patel S, Lauring B, et al. Incidence of urinary tract infections in patients with type 2 diabetes mellitus receiving ertugliflozin, placebo or active comparator. Poster presented at the 100th Annual Meeting of the Endocrine Society; 2018 Mar 17–20; Chicago, IL.
- Bolinder J, Ljunggren O, Johansson L, et al. Dapagliflozin maintains glycaemic control while reducing weight and body fat mass over 2 years in patients with type 2 diabetes mellitus inadequately controlled on metformin. Diabetes Obes Metab. 2014;16:159–169.
- Ferrannini E, Berk A, Hantel S, et al. Long-term safety and efficacy of empagliflozin, sitagliptin, and metformin: an active-controlled, parallel-group, randomized, 78-week open-label extension study in patients with type 2 diabetes. Diabetes Care. 2013;36:4015–4021.
- Leiter LA, Yoon KH, Arias P, et al. Canagliflozin provides durable glycemic improvements and body weight reduction over 104 weeks versus glimepiride in patients with type 2 diabetes on metformin: a randomized, double-blind, phase 3 study. Diabetes Care. 2015;38:355–364.
- Kohan DE, Fioretto P, Tang W, et al. Long-term study of patients with type 2 diabetes and moderate renal impairment shows that dapagliflozin reduces weight and blood pressure but does not improve glycemic control. Kidney Int. 2014;85:962–971.
- Zinman B, Inzucchi SE, Lachin JM, et al. Empagliflozin and cerebrovascular events in patients with type 2 diabetes mellitus at high cardiovascular risk. Stroke. 2017;48:1218–1225.