
Abstract
Objective
To evaluate the long-term safety and effectiveness of biosimilar insulin glargine (GLY) in real-world clinical practice.
Methods
This prospective, non-interventional, multicenter, observational, post-marketing safety study (PMSS) enrolled Japanese patients with type 1 or 2 diabetes mellitus (T1DM or T2DM) starting GLY therapy, and was required by Japanese Pharmaceutical Affairs Law mandating post-marketing safety surveillance to acquire safety and effectiveness data of biosimilar products. Data collected from the 12-month observation included patient characteristics, adverse events, and blood glucose control.
Results
The study enrolled 141 patients with T1DM and 1104 patients with T2DM. Pre-study insulin was used by 94.1% of patients with T1DM and 75.0% with T2DM. 65.4% of patients with T1DM and 64.3% with T2DM switched from the reference product (GLY-switched), while 25.0% with T2DM were insulin-naive. Adverse events were reported by 5.7% and 8.5% in T1DM and T2DM, respectively. Similar incidences were reported in GLY-switched. Adverse events were reported by 10.7% in insulin-naive T2DM. Baseline mean hypoglycemic events/month were 1.8 and 0.1 in T1DM and T2DM, respectively: the mean change from baseline (CFB) was –1.2 (p = .066) and 0.0 (p = .915), respectively. Baseline mean HbA1c was 8.4% and 8.7% in T1DM and T2DM, respectively; the mean CFB was –0.5% (p < .001) and –0.9% (p < .001), respectively, and –1.5% (p < .001) in insulin-naive T2DM.
Conclusions
This first long-term Japanese PMSS of GLY demonstrated adverse events, hypoglycemia, and glycemic control consistent with the known GLY profile for T1DM and T2DM patients, in routine clinical practice.
Introduction
Insulin access and economic burden
Globally, approximately 100 million people with diabetes require insulin, including all patients with type 1 diabetes mellitus (T1DM) and 10% to 25% of patients with type 2 diabetes mellitus (T2DM)Citation1. Insulin has been used to treat diabetes for nearly a century, and advanced technologies have markedly improved the potential for adequate glucose control in patients with diabetes, as evidenced by decreased postprandial glucose levels and sustained basal insulin levels.
Lack of insulin access precludes optimal diabetes management, and many patients who do have access are burdened by limited healthcare coverage coupled with the high cost of insulin, creating a significant barrier to glycemic controlCitation2,Citation3.
One practical approach to addressing this critical need is to introduce less expensive biosimilar insulins to global markets. Incremental innovation has repeatedly precluded formation of a generic insulin industry when patents expire, but biosimilar insulins that are biologically similar copies of marketed products have begun to fill this voidCitation1,Citation3. Surveys of healthcare providers and insulin-using patients have shown positive attitudes toward biosimilar insulins. In the European Union and United States, use of biosimilar insulins (or the comparable definition in the United States, based on the regulatory abbreviated licensure pathway) has been predicted to reduce prices within the range of 20% to 40%Citation1,Citation3. The cost reduction associated with biosimilar insulin may improve access to insulin globally, including in countries with major economic and healthcare barriers to insulin therapy.
Biosimilar insulin glargine use globally and in Japan
In 2014, Insulin Glargine BS Injection [Lilly] (Eli Lilly and Company, Indianapolis, IN, USA)Citation4, biosimilar insulin glargine hereafter referred to as GLY, became the first biosimilar insulin to receive marketing authorization in the European Union based on similarity to its originator reference product, LANTUSCitation5,Footnotei. GLY is a long-acting, human insulin analogue indicated to improve glycemic control in patients with diabetes who need insulin therapy, and has the same amino acid sequence and similar pharmacokinetic and pharmacodynamic properties as its reference product LANTUSCitation6–9. GLY was approved in the United States in 2014, where it is not designated as a biosimilar due to the regulatory approval pathway involved in its approvalCitation4,Citation10. In 2015, GLY became the first biosimilar insulin approved in JapanCitation1.
Registration studies established that GLY had a safety and efficacy profile similar to that of its reference product. This was based on 2 clinical studies: ELEMENT-1 which evaluated 535 patients with T1DM, including 100 Japanese patients, and ELEMENT-2 which evaluated 756 patients with T2DM, including 64 Asian patientsCitation11–13. Common adverse events reported for patients enrolled in GLY clinical trials have included hypoglycemia, allergic reactions, injection site reactions (such as pitting at the injection site, pruritus, and rash), edema, and weight gain. Clinical studies have shown the adverse event profiles of GLY and its reference product are similar.
Diabetes poses a significant healthcare and economic burden in Japan, illustrated over the past decade by diabetes diagnoses in an estimated 7.1 million Japanese adultsCitation14. In 2017, Japan was among the top 10 countries worldwide in total diabetes-related healthcare expenditureCitation15. Contemporaneous real-world data and evidence-based optimization of diabetes treatment are essential tools to address the expected rise in diabetes prevalence in the coming decades.
A Japanese post-marketing safety study (PMSS) of GLY was therefore undertaken, with the primary objective of evaluating long-term safety in routine clinical practice for Japanese patients with T1DM or T2DM, which also satisfied regulatory requirements of the Japanese health authority. Here we report results from this first Japanese PMSS that show long-term, real-world data on GLY use in the clinical setting. These data include safety and effectiveness outcomes for patients who had T1DM or T2DM, or who were insulin-naive.
Methods
Study design
This prospective, non-interventional, single-arm, multicenter, observational PMSS was conducted between August 2015 and July 2018 (following the approval of GLY in Japan in 2015). The study included 258 sites in Japan, primarily in endocrinology and metabolism or diabetes internal medicine departments.
In each patient, the duration of observation was 12 months from the start of GLY administration or until the day of early discontinuation if applicable, hence not all patients had a 12-month follow-up period.
Patient enrollment
Enrollment eligibility included Japanese patients diagnosed with diabetes mellitus who had never used GLY, for whom GLY was considered by the attending physician to be an appropriate therapy, and for whom self-monitored blood glucose levels could be obtained.
Patients were enrolled using a centralized registration method. Enrollment had to occur before GLY use started or within 14 days from the start of GLY administration. Inclusion criteria are described for patients with diabetes mellitus fulfilling all of the following criteria: patients who have never used GLY, for whom treatment with GLY is considered to be appropriate by a physician before enrollment, and for whom self-monitored blood glucose levels can be obtained. Patients with diabetes mellitus were excluded if they had any contraindications to GLY.
The target enrollment was 1000 patients for the safety endpoint analysis, including at least 100 patients with T1DM and at least 500 patients with T2DM. The planned sample size was estimated to be 1050 patients, which assumed a dropout rate of 5% and took into consideration assumptions regarding hypoglycemia incidence based on prior results in the clinical program.
This study was conducted in compliance with the Good Post-Marketing Study Practice (GPSP Ordinance) issued by the Ministry of Health, Labour and Welfare in Japan. The study protocol adhered to applicable local and country-specific laws and regulations pertaining to protection of patient privacy and safety. In accordance with these laws and regulations, the non-interventional, observational study did not obtain written informed consent from enrolled patients and was exempt from World Health Organization registration criteria.
GLY treatment
Patients were administered GLY in accordance with approved product labeling and as advised by their attending physician. In general, GLY doses were administered by subcutaneous injection once daily at the same time each day, in accordance with the Japanese guideline for diabetes treatmentCitation16.
Data collection
Data were collected using an electronic data capture system designed to collect patient data transmitted from medical institutions via the Internet. Investigators entered patient data into an electronic case report form in this system where it was stored in a database until the time of analysis. The authors confirm that the data supporting the findings of this study are available within the article.
Patient characteristics at baseline were recorded including demographics, diabetes diagnosis, medical history, and prior medications. Over the 12-month observation period, data collection included GLY doses and usage; concomitant therapies; adverse events; patient-reported hypoglycemia incidence; body weight; blood lipids, including total cholesterol, high-density lipoprotein (HDL), low-density lipoprotein (LDL), and triglycerides; hemoglobin A1c (HbA1c); and fasting plasma glucose (FPG). Note that laboratory values were determined at local laboratories; no central laboratory was used.
Adverse events were coded by preferred term per the Medical Dictionary for Regulatory Activities (MedDRA) Version 21.1. Adverse events were categorized as: any adverse events, which were any unfavorable or unintended disease or sign in a patient given GLY, with or without a causal relationship to GLY; possibly treatment-related adverse events, which were considered possibly related to study treatment in the opinion of the investigator; serious adverse events, which included one or more of the following: death, a life-threatening condition, initial or prolonged inpatient hospitalization, a persistent or significant disability, a congenital anomaly or birth defect, or any other medically important condition; and adverse events leading to discontinuation.
Adverse events of special interest (hypersensitivity reactions, injection site reactions, and hypoglycemia) were required to be collected by authority and were summarized descriptively. Data for the adverse events of special interest of hypoglycemia were collected as patient-reported presence or absence and number of episodes within the month preceding the time point. Hypoglycemic episodes assessed by the investigator as severe (that is, requiring the assistance of another person) were treated as serious adverse events. In the analyses of this study, non-severe episodes were included in hypoglycemia incidence rate calculations but were not treated as adverse events.
Statistical methods
Sample size was determined on the basis of the results from clinical trials. The incidence rates of severe hypoglycemia in this study were assumed to be 3.7% in T1DM and 0.5% in T2DM, with a 95% confidence interval (CI) of ≤ 7.4% for T1DM and ≤ 1.2% for T2DM. The incidence rates of hypersensitivity reactions were assumed to be 7.5% in T1DM and 5.6% in T2DM, with a 95% CI of ≤ 10.4% for T1DM and ≤ 4.0% for T2DM.
This study was designed to enroll patients with T1DM and T2DM and collect data for safety analysis from 1000 cases. Assuming a dropout rate of 5%, the enrolled patients were set to 1050. This sample size would include at least 100 patients with T1DM and at least 500 patients with T2DM. Assuming a true incidence rate of 50% for a given event, a sample size of 1000 would produce a two-sided 95% confidence interval for the incidence rate with a width of 6.2%. Data were analyzed using descriptive statistics. Continuous variables were summarized by calculated values such as mean with standard deviation (SD). Categorical or binary variables were summarized by calculated values such as frequency and incidence rates. Reported values include median with minimum and maximum values (range), mean with SD, incidence rate, and point estimate with change from baseline calculated with a 95% CI. For comparisons made between baseline and post-baseline within each group, a paired t-test was conducted using a 5% significance level where applicable for reference purposes. No statistical test was conducted for comparison of proportion.
Results are reported for all patients with either T1DM or T2DM, those with either T1DM or T2DM who switched from reference product, LANTUS, to GLY (GLY-switched) at the start of the study, and patients with T2DM who entered the study as insulin-naive. An insufficient number of patients diagnosed as T1DM (n = 14) entering the study as insulin-naive at the time of enrollment were excluded for the purpose of subgroup analysis in order to conduct meaningful analyses. These analyses included adverse events, hypoglycemia, HbA1c, and FPG and focused on patients that were GLY-switched for effectiveness measures of blood glucose control.
Results
Patient characteristics
Enrollment
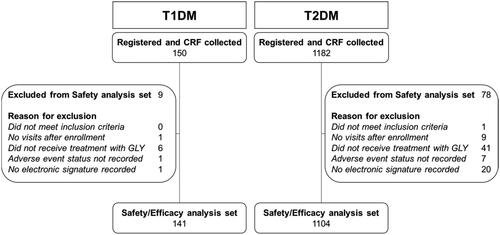
Enrollment in the study is summarized in . A total of 1385 patients with diabetes mellitus registered to participate in this study. After excluding patients who did not meet study criteria or who had inadequate data or documentation, safety and effectiveness analyses included 141 patients with T1DM and 1104 patients with T2DM. One patient with T2DM who switched from reference product to GLY was not counted in analyses as GLY-switched due to GLY administration occurring on the same day as prior treatment discontinuation as recorded on the case report form.
Figure 1. Patient disposition. For T1DM and T2DM, registered patients and CRF collected are presented with a breakdown of the inclusion and non-inclusion criteria, and resultant safety and efficacy analysis set. Abbreviations. CRF, case report form; GLY, biosimilar insulin glargine; T1DM, type 1 diabetes mellitus; T2DM, type 2 diabetes mellitus.
Demographics
Patient characteristics are summarized in . Consistent with disease epidemiology, patients with T1DM were generally younger than those with T2DM (median ages of 50.3 and 62.9 years, respectively). Consistent with this observation, elderly patients (age ≥65 years) comprised a smaller proportion of the T1DM population (19.9%) than the T2DM population (51.8%). Two pediatric patients (age <15 years) were enrolled in the study, both of whom had T1DM. Gender balance and body mass index were not meaningfully different between T1DM and T2DM populations.
Table 1. Patient characteristics at baseline.
Prior and concomitant diabetes therapies
Prior anti-diabetic regimens are summarized in . Patients with T1DM included 94.1% with prior insulin use before entering the study, and 5.9% who were insulin-naive at baseline. Patients with T2DM included 75.0% with prior insulin use, and 25.0% who were insulin-naive. Among patients with T1DM or T2DM who had used any prior insulin regimen, the majority (85.0% and 83.1%, respectively) reported having previously used a basal insulin regimen. Similar proportions of patients with T1DM or T2DM had previously used the reference product (65.4% or 64.3%, respectively), all of whom switched to GLY at baseline per study entry criteria.
The prior non-insulin diabetes medications most commonly reported for patients with T1DM included dipeptidyl peptidase-4 (DPP-4) inhibitors (12.6%), alpha glucosidase inhibitors (9.6%), and biguanides (6.7%). For patients with T2DM they included DPP-4 inhibitors (53.2%), alpha glucosidase inhibitors (19.5%), and biguanides (38.9%). Among patients who had previously used oral anti-diabetic agents, most patients with either T1DM or T2DM had used 1 to 2 agents.
The majority of patients with either T1DM or T2DM reported concomitant non-insulin therapy use during the study (82.3% or 85.7%, respectively), which was similar for GLY-switched patients and insulin-naive patients with T2DM. Among patients who reported concomitant therapy, anti-diabetic medications were used by a majority of patients with either T1DM (93.1%) or T2DM (87.4%), which was similar for GLY-switched patients and insulin-naive patients with T2DM. Among patients with either T1DM or T2DM who used concomitant anti-diabetic medications in combination with GLY, the most commonly reported were DPP-4 inhibitors (15.5% or 50.4%, respectively) and biguanides (9.5% or 37.1%, respectively), which was similar to patterns of prior pre-study anti-diabetic medication use.
Other insulins used in combination with GLY during the study were reported by 75.9% of patients with T1DM and 31.7% of patients with T2DM, which was similar for GLY-switched patients. A small proportion of previously insulin-naive patients with T2DM (6.1%) used other insulins in combination with GLY. Concomitant insulins were mainly rapid-acting insulins used as bolus administration.
Smaller subsets of patients with T1DM or T2DM used non-medication therapies during the study (19.1% or 22.9%, respectively). These were primarily for the purpose of diabetes management, and included exercise and diet therapies.
GLY dosing
GLY doses
For patients with T1DM, the GLY mean daily dose (SD) for the duration of the treatment period was 14.9 (9.5) U/day, including 16.4 (10.0) U/day for those who were GLY-switched. For patients with T2DM, the GLY mean daily dose (SD) was 11.8 (8.5) U/day, including 12.9 (8.0) U/day for GLY-switched patients and 8.9 (5.5) U/day for those who were insulin-naive. The majority of patients with T1DM or T2DM used between 4 and 20 U/day of GLY (76.6% or 83.4%, respectively), which was similar for GLY-switched patients and insulin-naive patients with T2DM.
Bolus insulin doses administered in combination with GLY
For patients who used a basal-bolus regimen consisting of concomitant insulin bolus administered in addition to basal GLY, the mean daily dose (SD) of bolus insulin use for the duration of the treatment period was 23.2 (12.1) U/day for patients with T1DM, including 24.7 (11.3) U/day for those who were GLY-switched. The mean daily bolus insulin dose (SD) was 18.9 (12.4) U/day for patients with T2DM, including 20.7 (12.8) U/day for those who were GLY-switched and 11.8 (6.3) U/day for those who were insulin-naive.
GLY continuation rate
The continuation rate was used as an indicator of therapy persistence and defined as the proportion of patients who continued to receive GLY at 12 months. The 12-month continuation rates for GLY use, which were used as a surrogate indicator of GLY persistence, were 85.0% for patients with T1DM and 71.1% for patients with T2DM.
Safety observations
Adverse events
provides an overview of adverse events by category including any adverse events, possibly treatment-related adverse events, serious adverse events, and adverse events leading to discontinuation. For patients with T1DM, the incidence of any adverse events was 5.7% for the overall group of patients, including 6.0% for the subgroup of GLY-switched patients. For patients with T2DM, the incidence of any adverse events was 8.5% for both the overall group of patients and the subgroup of GLY-switched patients and 10.7% for those who were insulin-naive.
Table 2. Overview of adverse events by category.
Possibly treatment-related adverse events, as determined by the investigator, were reported in 0.7% of the overall group of patients with T1DM and 1.2% of the overall group of patients with T2DM, which was similar for GLY-switched patients and insulin-naive patients with T2DM.
Serious adverse events were reported at similar incidences of 3.5% overall in patients with T1DM and 3.4% overall in those with T2DM, and were similar for GLY-switched and insulin-naive patients with T2DM. Two events of hypoglycemia (occurring in 1 patient each with T1DM or T2DM) were considered severe and reported as serious adverse events per the protocol definition, and were also counted as adverse events of special interest. Serious adverse events considered as possibly treatment-related included 1 of the severe hypoglycemic episodes in an insulin-naive patient with T2DM, 1 event of altered consciousness in a GLY-switched patient with T2DM, and 1 event of cerebellar tumor in a GLY-switched patient with T1DM.
The incidence of adverse events leading to discontinuation was low at 0.7% and 1.4% for both overall patients with T1DM and T2DM, respectively, and was similar for GLY-switched patients and insulin-naive patients with T2DM.
The overall incidence of adverse event by preferred term for events reported in 2 or more patients is summarized in . Among patients with T1DM, there were no adverse events reported in more than 1 patient. The most frequently reported adverse events for patients with T2DM included diabetes mellitus inadequate control and hypertension, which were similar for GLY-switched patients and insulin-naive patients with T2DM.
Table 3. All adverse events reported in 2 or more patients with T1DM or T2DM.
Adverse events of special interest included hypersensitivity reactions, injection site reactions, and hypoglycemia. One injection site reaction was reported during the study; injection site pruritus in 1 patient with T2DM who was insulin-naive, and was considered by the investigator to be possibly treatment-related. Hypersensitivity reactions reported during the study included 2 events of pruritus reported in GLY-switched patients with T2DM, of which 1 event was considered by the investigator to be possibly treatment-related, and 2 events of peripheral edema in patients with T2DM, of which 1 event in an insulin-naive patient was considered by the investigator to be possibly treatment-related. Hypoglycemic episodes meeting serious adverse event criteria were reported for 2 patients, including 1 patient with T1DM who was GLY-switched, and 1 insulin-naive patient with T2DM for whom the event was considered by the investigator to be possibly treatment-related.
Hypoglycemia incidence
Hypoglycemia incidence rates at baseline were 33.1% or 3.1%, respectively, for overall patients with T1DM or T2DM. Mean hypoglycemia incidences over the 12-month observation period are shown in .
Figure 2. Hypoglycemia incidence rates over 12-month observation. Hypoglycemia incidence rates (%) at baseline and up to 12-months postbaseline for patients with T1DM overall and those who were GLY-switched, or with T2DM overall and those who were either GLY-switched or insulin-naive. Abbreviations. GLY, biosimilar insulin glargine; mo, month.
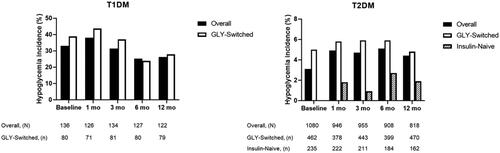
Hypoglycemia was further evaluated as events per month within the patient populations. Baseline mean hypoglycemic events per month (SD) were 1.8 (5.9) and 0.1 (0.6) among patients with T1DM or T2DM, respectively, with mean changes from baseline to 12 months of –1.2 (95% CI: −2.4, 0.1; p = .066) or 0.0 (95% CI: 0.0, 0.1; p = .915). Patients with either T1DM or T2DM, respectively, who were GLY-switched had mean decreases from baseline in hypoglycemia incidence of -1.0 (95% CI: −1.5, −0.4; p < .001) or 0.0 (95% CI: −0.12, 0.03; p = .236).
Body weight
For patients with T1DM, the mean body weight (SD) at baseline was 61.3 (11.8) kg. At 12 months, the mean change in body weight was a small but significant increase of +1.1 kg (95% CI: 0.3, 1.9; p = .006). Among those who were GLY-switched, the baseline mean body weight (SD) was 62.9 (12.1) kg, and the 12-month mean change in body weight was a small increase of +0.7 kg (95% CI: −0.2, 1.5; p = .112).
For patients with T2DM, the mean body weight (SD) at baseline was 66.2 (15.3) kg. At 12 months, the mean change in body weight was a small but significant increase of +0.4 kg (95% CI: 0.1, 0.7; p = .011). Among those who were GLY-switched, the baseline mean body weight (SD) was 67.9 (14.9) kg, and the 12-month mean change in body weight was a small but significant decrease of –0.4 kg (95% CI: −0.7, −0.1; p = .020). Patients with T2DM who were insulin-naive had a baseline mean body weight (SD) of 64.5 (16.3) kg, and the 12-month mean body weight change was a small but significant increase of +1.1 kg (95% CI: 0.5, 1.7; p < .001).
Lipids
Analysis of lipid levels was conducted for patients with available data at each time point. For patients with T1DM, baseline mean lipid laboratory values (SD) were 200.3 (37.4) mg/dL total cholesterol, 64.6 (17.3) mg/dL HDL, 109.8 (30.3) mg/dL LDL, and 110.1 (62.3) mg/dL triglycerides. The 12-month mean changes from baseline were generally small and variable: −1.1 (95% CI: −9.9, 7.8; p = .808) for total cholesterol, +0.9 (95% CI: −1.9, 3.7; p = .514) for HDL, +0.1 (95% CI: −5.8, 6.1; p = .961) for LDL, and –2.3 (95% CI: −17.4, 12.8; p = .761) for triglycerides. GLY-switched patients with T1DM had similar baseline levels and variable 12-month changes from baseline.
For patients with T2DM, baseline mean lipid laboratory values (SD) were 193.5 (46.2) mg/dL total cholesterol, 52.9 (15.9) mg/dL HDL, 109.1 (35.2) mg/dL LDL, and 182.9 (156.3) mg/dL triglycerides. The 12-month mean changes from baseline were a significant decrease of –8.3 (95% CI: −13.0, −3.5; p < .001) for total cholesterol, a small increase of +0.2 (95% CI: −0.8, 1.2; p = .750) for HDL, a significant decrease of –4.5 (95% CI: −7.2, −1.8; p = .001) for LDL, and a significant decrease of –20.7 (95% CI: −31.0, −10.3; p < .001) for triglycerides. GLY-switched and insulin-naive patients with T2DM had similar baseline levels and variable 12-month changes from baseline, which included significant decreases in triglycerides for each subgroup.
Effectiveness of GLY
HbA1c
Mean baseline HbA1c (SD) was 8.4 (2.1)% for patients with T1DM and 8.7 (2.3)% for patients with T2DM. Mean HbA1c values over the 12-month observation period are shown in .
Figure 3. Hemoglobin A1c over 12-month observation. Hemoglobin A1c (HbA1c) mean values and standard deviations (error bars) at baseline (0 months) and up to 12-months postbaseline for patients with T1DM overall and those who were GLY-switched, or with T2DM overall and those who were either GLY-switched or insulin-naive. The statistical comparison was performed to mean difference between baseline vs post-baseline within each group. For T1DM: *p < .05 versus baseline on overall, **p < .001 versus baseline on overall, #p < .01 versus baseline on GLY-switched. For T2DM: **p < .001 versus baseline on overall, #p < .01 versus baseline on GLY-switched, and ϕϕ p < .001 versus baseline on insulin-naive.
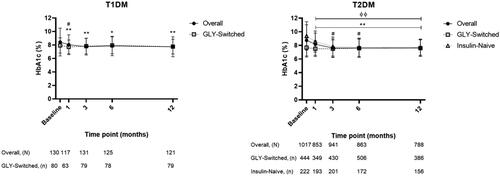
HbA1c values were further evaluated for changes from baseline within the patient populations. Patients with T1DM or T2DM had significant mean decreases from baseline to 12 months of –0.5% (95% CI: −0.8, −0.2; p < .001) or –0.9% (95% CI: −1.0, −0.7; p < .001), respectively. Patients with T1DM or T2DM who were GLY-switched had baseline mean HbA1c (SD) of 7.9 (1.1)% or 7.7 (1.4)%, and 12-month mean decreases from baseline of –0.2% (95% CI: −0.4, 0.0; p = .089) or 0.0% (95% CI: −0.2, 0.1; p = .420), respectively. Patients with T2DM who were insulin-naive had baseline mean HbA1c (SD) of 9.4 (2.1)%, and a significant mean decrease from baseline of –1.5% (95% CI: −1.9, −1.2; p < .001).
Fasting plasma glucose
Mean baseline FPG (SD) was 149.5 (77.9) mg/dL for patients with T1DM and 192.0 (107.7) mg/dL for patients with T2DM. Mean FPG values over the 12-month observation period are shown in .
Figure 4. Fasting plasma glucose over 12-month observation. Fasting plasma glucose (FPG) mean values and standard deviations (error bars) at baseline (0 months) and up to 12-months postbaseline for patients with T1DM overall and those who were GLY-switched, or with T2DM overall and those who were either GLY-switched or insulin-naive. The statistical comparison was performed to mean difference between baseline vs post-baseline within each group. For T2DM: **p < .001 versus baseline on overall, and ##p < .001 versus baseline on insulin-naive.
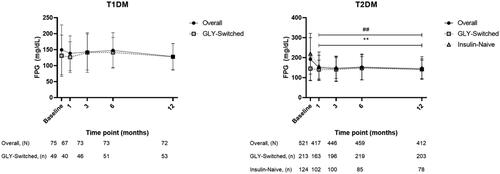
The FPG values were further evaluated for changes from baseline within the patient populations. Patients with T1DM or T2DM had a small mean decrease from baseline to 12 months of –5.7 mg/dL (95% CI: −18.0, 6.6; p = .356) or a large significant decrease of –42.1 mg/dL (95% CI: −52.9, −31.4; p < .001), respectively. Patients with T1DM or T2DM who were GLY-switched had baseline mean FPG (SD) of 131.0 (64.6) mg/dL or 145.1 (58.5) mg/dL, and small 12-month mean decreases from baseline of –8.0 mg/dL (95% CI: −22.8, 6.9; p = .285) or –6.5 mg/dL (95% CI: −16.0, 3.0; p = .176). Patients with T2DM who were insulin-naive had baseline mean FPG (SD) of 219.4 (102.1) mg/dL, and a significant mean decrease from baseline of –74.5 mg/dL (95% CI: −98.2, −50.8; p < .001).
Discussion
Key study findings in context of the literature
Here, we report findings from the first real-world study evaluating the safety and effectiveness of the first biosimilar insulin introduced to clinical practice in Japan. Findings from this study are of interest for clinicians, patients, payers, and regulators as biosimilar insulins are anticipated to become more commonly used in diabetes care, and to date no data of these kind have been reported in Japan.
Results of this first-ever study of biosimilar insulin using real-world data in Japan are meaningful as they demonstrate that the GLY clinical profile was comparable for patients including those switching from the reference product to GLY, during treatment in the routine clinical setting.
In this non-interventional, prospective, multicenter, observational PMSS, safety and effectiveness profiles were evaluated during 12-month administration of GLY in 141 patients with T1DM and 1104 patients with T2DM who had not previously taken GLY. No new or additional safety issues were observed relative to the reference product profile, compared with previous clinical studies, or with regard to switching to GLY from the reference product or being insulin-naive at the start of the study.
Hypoglycemic episodes
Patients with either T1DM or T2DM had a mean hypoglycemia incidence at baseline of 33.1% or 3.1%, respectively. During the 12-month observation period, hypoglycemia incidence ranged from 25.2% to 38.1% for patients with T1DM but remained relatively unchanged for patients with T2DM. The incidence of hypoglycemia generally remained near baseline levels from 3 to 12 months of observation. For insulin-naive patients with T2DM, the mean hypoglycemia incidence was less than 3% at each observation point.
In the literature, non-severe hypoglycemic episodes (defined as self-treated hypoglycemia) have been reported to range between 31.2 and 83.2 episodes per year in T1DM, and between 4.16 and 15.6 episodes per year for insulin-treated patients with T2DMCitation17. This includes data from a recent study of 411 Japanese respondents on the impact of non-serious hypoglycemic episodes on daily functioning reporting a mean 3-month rate of 7.1 episodes in the daytime and 1.9 episodes during the nighttime. Our results were generally within these previously reported ranges if extrapolated to events per year.
In a PMSS conducted in Japanese patients with T2DM, the “Add-on LANTUS to Oral Hypoglycemic Agents 2” (ALOHA-2) study, 140 patients (5.4%) out of 2602 patients in the safety analysis population reported hypoglycemic events as adverse events, including 11 patients (0.4%) with severe hypoglycemic events for the insulin glargine-naive T2DM populationCitation18. Serious hypoglycemia considered to be possibly treatment-related was reported for 8 patients, as well as serious events of hypoglycemic seizures and hypoglycemic unconsciousness reported in 1 patient each. In our study, only 2 patients (0.2%) had severe hypoglycemic episodes that were considered as serious adverse events per the protocol definition, and only 1 of these patients (0.1%) had a severe episode considered by the investigator to be possibly treatment-related.
The published hypoglycemia data are useful for reference purposes but cannot be directly compared with our own. However, we do note that our study reported fewer severe hypoglycemic episodes than the ALOHA-2 study in Japanese patientsCitation18. This may be due in part to different methods in counting and classifying hypoglycemic events. In general, the prior study categorized hypoglycemic episodes for analysis as severe (serious or requiring assistance of another person), documented symptomatic (typical symptoms of hypoglycemia accompanied by a plasma glucose concentration ≤70 mg/dL), or nocturnal (reported as nocturnal hypoglycemia by the attending physician). Our study collected data on patient-reported hypoglycemia without glucose level criteria, and categorized severe episodes as serious adverse events; all non-serious episodes were counted for hypoglycemia incidence and change from baseline analyses, but were not categorized as adverse events.
Frequency and severity of hypoglycemic episodes can be affected by whether patients achieve and maintain glycemic control and adhere to their insulin therapy. The HbA1c and FPG data in our study demonstrated mean glycemic control improvements over baseline that persisted over the 12-month observation period. Mean GLY dosing and adherence data showed patients were taking doses within the labelled and approved range, and that most patients adhered to GLY therapy for the entirety of the 12-month period of the study. These factors may have contributed to the observed hypoglycemia incidence rates.
Hypersensitivity reactions
With regard to the safety profile and adverse events of interest during the 12-month observation period, there were few hypersensitivity reactions reported in our study.
In an immunogenicity analysis across ELEMENT-1 and ELEMENT-2 studies, data from evaluable patients showed no significant differences between GLY and its reference product with regard to insulin antibody levels or relationship to efficacy or safety outcomes including adverse events of special interest such as allergic reactions (comparable to hypersensitivity reactions)Citation19. Similarly, a post hoc analysis of ELEMENT-2 that stratified patients by age evaluated insulin antibody levels and showed no difference between GLY and its reference product overall or by age groupCitation20. In the context of these prior reports on immunogenicity and hypersensitivity in large global populations, our Japanese PMSS data suggest no new or notable difference in immunogenic concerns.
Glycemic control
For patients with T1DM, HbA1c significantly decreased at each observation point compared with baseline values, and patients with T1DM who were GLY-switched maintained near-baseline levels throughout the observation period in our 12-month study. The FPG values showed decreases in patients with T1DM, including those who were GLY-switched, and remained at near-baseline levels over 12 months. Patients with T2DM had significant decreases in HbA1c and FPG over 12 months. For patients with T2DM who were GLY-switched, near-baseline levels for both HbA1c and FPG were maintained throughout the observation period, and blood glucose appeared to be well-controlled. For insulin-naive patients with T2DM, both HbA1c and FPG significantly decreased at each observation point compared with baseline.
In the “Japanese Diabetes Attitudes, Wishes and Needs” (DAWN) study, findings from background information for 11,656 patients treated by 134 surveyed physicians indicated that the mean HbA1c at which physicians would recommend insulin to their patients was 8.7%Citation21. For 236 patients who were recommended to initiate insulin therapy, the mean HbA1c was 9.6%. In the ALOHA-2 Japanese PMSS, mean baseline HbA1c was 9.6% in the efficacy analysis population of 1629 patients with T2DM and initiation of insulin glargine U-100 at baselineCitation18. In our study, mean baseline HbA1c was 8.4% for patients with T1DM, 8.7% for patients with T2DM, and 9.4% for patients with T2DM who were insulin-naive. Effectiveness in our study was in accordance with these previous reports, with a similar burden of insulin initiation with regard to baseline HbA1c.
To address another obstacle to insulin initiation, patient psychological burden, the “accEpting insulin treatMent for reluctant peOple with Type 2 dIabetes mellitus: a glObal study to ideNtify effective strategies” (EMOTION) study examined patient barriers to insulin initiation with the aim of formulating evidence-based recommendations to healthcare providersCitation22. In this global study of 594 evaluable patients that included 99 Japanese patients, the mean baseline HbA1c for patients with T2DM was 9.8%, which was similar to populations in our study and ALOHA-2Citation23. Recommendations included adoption of communication styles and education practices that increase the likelihood of overcoming patient reluctance to start therapy, which could ultimately lead to initiating insulin at a lower HbA1c, better subsequent treatment compliance, and maintenance of glycemic control.
A recent review of diabetes therapies in East Asian populations concluded that insulin glargine 100 U/mL as therapy for T2DM should be considered the treatment standard for insulin initiation in East Asian patients based on patient demographics, clinical experience, and PMSS outcomesCitation15. Studies in this review included patient cohorts in China and Japan who switched from other insulins to GLY and saw improved HbA1c and FPG for durations up to 3 years. Our PMSS data add to the growing body of evidence that Japanese patients may benefit from GLY use for insulin initiation, switching to GLY from other insulins, and adding GLY to their oral anti-diabetic medication regimen, as well as the role of GLY in maintenance of glycemic control.
Metabolic changes
Mean body weight changes were small and variable for patients with either T1DM or T2DM, with both populations experiencing within approximately 1 kg of weight change after 12 months of observation in our study. Few of the small changes in lipid values among patients with T1DM were significant. Patients with T2DM had small but significant decreases in total cholesterol that were similar but mostly nonsignificant for GLY-switched or insulin-naive patients. All patients with T2DM, including GLY-switched and insulin-naive patients, had large significant reductions in triglycerides.
Serum lipids are known to be significantly impacted by insulinCitation24. Hypertriglyceridemia is a common serum lipid abnormality associated with diabetes, due either to insulin resistance or deficiency. Recent evidence from a study with a Japanese cohort suggested triglycerides are a leading predictor of cardiovascular risk in patients with diabetes, comparable to HbA1c and stronger than hyperglycemia as predictors, even for patients with very high blood glucose levels. Cardiovascular disease is further exacerbated by kidney disease, which is also a common comorbidity of diabetes, and hypertriglyceridemia contributes to both kidney and widespread vascular endothelial damage. Lowering triglyceride levels is therefore an indicator of metabolic improvement in patients with diabetes, and may lower cardiovascular and kidney risks.
Safety in higher-risk populations
The overall safety and effectiveness profile for patients in higher-risk subgroups (the elderly, or those with renal or hepatic dysfunction) was investigated as required by authority in our study, and was generally similar to the overall T1DM or T2DM populations. As might be expected, patients of advanced age or with renal or hepatic dysfunction did have a higher incidence of adverse events, but mean changes from baseline in hypoglycemia incidence were small and variable in higher-risk subgroups compared with the larger T1DM or T2DM populations (data not shown).
Furthermore, our study aligns with data from the ALOHA-2 PMSS, where Japanese patients with T2DM who initiated LANTUS in combination with an oral anti-hyperglycemic medication were analyzed for hypoglycemia incidence rates across a wide variety of patient characteristics strataCitation18. In general, patients with diabetes complications did not have higher hypoglycemia incidence rates, showing no particular safety concerns with regard to hypoglycemia in elderly patients or those with hepatic or renal dysfunction.
Jeong et al. compared insulin lispro twice daily with glargine U-100 plus prandial insulin lispro once daily in East Asian (Chinese and Korean) and Caucasian patients with T2DM in real-world practiceCitation25. Although the mean (± SD) body mass index (BMI) at baseline (25.8 [± 3.3] vs 31.5 [± 4.7] kg/m2, respectively) and the mean (± SD) total daily basal insulin dose at the endpoint (29.1 [± 14.1] vs 42.5 [± 19.7] IU, respectively) were different for East Asians compared with Caucasians, the decreases in HbA1c and incidence of hypoglycemic episodes were similar regardless of ethnicity and treatmentCitation25. In the randomized controlled trial setting, when comparing the dose of insulin glargine U-100 in a Caucasian population (EDITION 2) versus a Japanese population (EDITION JP2), using the same titration algorithm (target of 4.4–5.6 mmol/L [79–101 mg/dL]), there was a higher insulin glargine U-100 dose at 6 months in Caucasian versus Japanese patients (0.84 vs 0.30 U/kg/day)Citation26,Citation27. The patients’ baseline BMI was also different, as expected, and in both studies there was a similar HbA1c decrease from baseline (–0.56 [± 0.09]% vs −0.55 [± 0.06]%) and any hypoglycemia at any time (79.3% vs 80.0%)Citation26,Citation27. Furthermore, subcutaneous injection of insulin glargine (0.4 U/kg) in Japanese subjects with T1DM resulted in a similar time-action profile of blood glucose compared with that in Caucasian subjects with T1DMCitation28. Ethnic differences between East Asians and Caucasians in T2DM have been reported, characterized primarily by differences in the degree of β cell dysfunction and insulin resistance in each populationCitation29. In addition, other economic, cultural, and social differences might have some impact on how antidiabetic medications, including insulins, contribute to treatment outcomes and overall clinical experienceCitation15.
Limitations of the study
Results of this study were descriptive, and should be interpreted in that context. It is important to note that PMSS collects real-world data and our study collected hypoglycemia data as a patient-reported outcome. While a recall bias is a limitation, the strength of our study is in the collection of information from patients in the real-world setting.
No control groups were included in this observational study. Data analyses did not control for effects of pre-treatment or confounding baseline characteristics. No formal statistical inference was made and multiplicity for statistical tests was not corrected. Data collection and clinical laboratory testing was conducted at each study site and was not centralized. The number of patients planned to be enrolled and analyzed in the study was based on the incidence and features of adverse events of interest; however, the number of patients in subgroup analyses was dependent on data availability and in some cases included a limited number of patients. The statistical power of subgroup results is therefore limited. The observation period for this observational study was 12 months, and it remains possible that additional adverse events would be identified over longer-term treatment and observation. Individual patients with lower compliance for GLY administration could have impacted interpretation of aggregate safety and effectiveness results, including off-label and oral anti-hyperglycemic medications taken among the insulin-naive T1DM patient population. This may have been due to the T1DM group including patients with slowly progressive insulin-dependent diabetes mellitus or latent autoimmune diabetes in adults, however these diagnoses were not collected for the T1DM patients in this observational study.
The hypoglycemia event data collected in this study were directly assessed by patients as patient-reported outcomes. As such, some data for hypoglycemia may be incorrect as they were reported following a symptomatic case and may have been collected differently, such as from a device-based blood glucose measurement or an assessment by a physician.
Clinical relevance of study findings
This observational study is the first to investigate real-world data on safety and effectiveness from a large number of patients using the first biosimilar insulin approved in Japan. This study is unique in addressing important clinical questions about long-term use of the biosimilar insulin after patients with T1DM or T2DM switched from the reference product to GLY, or in patients with T2DM who were insulin-naive. In both cases, switching to and initiation of GLY, safety and effectiveness outcomes were generally in line with prior reportsCitation12,Citation13,Citation18. Long-term GLY administration in these populations of Japanese patients with diabetes was associated with blood glucose control maintenance, with no new safety concerns.
Subgroup analyses of patients with T1DM or T2DM confirmed there were no concerns related to GLY safety and effectiveness in patients who were GLY-switched, insulin-naive, or elderly and there were no cases of investigator-reported renal or hepatic dysfunction. This is in line with outcomes for comparable patient populations in prior studiesCitation12,Citation13,Citation18.
Overall, results of this study demonstrated the safety and effectiveness of GLY over a 12-month observation period for patients with T1DM or T2DM, including those who switched from the reference product, a subset who was previously insulin-naive. These findings are important in the context of medical management of diabetes with insulin in routine clinical practice, and support the potential for reduced financial burden on patients able to use a lower-cost biosimilar.
Conclusion
This first long-term post-marketing safety study of biosimilar insulin glargine in Japan demonstrated hypoglycemia, other adverse events, and glycemic control were in line with the known safety profile for insulin glargine U-100 for patients with T1DM or T2DM, including GLY-switched patients, in routine clinical practice. The findings of long-term GLY administration in Japanese patients with diabetes support the safety, effectiveness, and potential gold standard basal insulin therapy with the reduced financial burden on patients able to use a lower-cost biosimilar in real clinical practice.
Transparency
Declaration of funding
This study was sponsored and funded by Eli Lilly Japan K.K. and Nippon Boehringer Ingelheim.
Declaration of financial/other relationships
All authors are full-time employees at Eli Lilly Japan K. K. and shareholders at Eli Lilly and Company. Peer reviewers on this manuscript have no relevant financial or other relationships to disclose.
Author contributions
TS contributed to the conception and design of the study. MK contributed to acquisition of the study data. TS and SN contributed to analysis of the study data. All authors contributed to interpretation of the data, drafting or critical revision of the article, approved the final version to be published, and agree to be accountable for all aspects of the work.
Acknowledgements
The authors thank the study patients and their families, and the site investigators and clinical staff. The authors thank Jennifer Bodie, PhD, Gina M. Coudriet, PhD, Andrew Sakko, PhD, CMPP, Antonia Baldo, and Noelle Gasco (Syneos Health Clinical, Morrisville, NC, USA) for compensated contract assistance with manuscript preparation.
Notes
i LANTUS is a registered trade name of Sanofi K.K., Tokyo, Japan.
References
- Health Action International: Biosimilar Insulin Regulatory Profile [Internet]. Amsterdam (The Netherlands): Health Action International, April 2017; [cited 2019 May 28]. Available from: http://haiweb.org/wp-content/uploads/2017/04/Regulatory_Report_ACCISS_2017.pdf.
- Yamada T, Kamata R, Ishinohachi K, et al. Biosimilar vs originator insulins: systematic review and meta-analysis. Diabetes Obes Metab. 2018;20(7):1787–1792.
- Heinemann L. Biosimilar insulin and costs: what can we expect? J Diabetes Sci Technol. 2016;10(2):457–462.
- Eli Lilly and Company: FDA grants tentative approval for Lilly and Boehringer Ingelheim’s Basaglar™ (insulin glargine injection) [Internet]. Indianapolis (IN): Eli Lilly and Company, 2014, Aug 18; [cited 2019 May 28]. Available from: https://investor.lilly.com/releasedetail.cfm?ReleaseID=866751
- European Medicines Agency: Abasaglar (previously Abasria) [Internet]. London (United Kingdom): European Medicines Agency, 2014, Oct 14; [cited 2019 May 28]. Available from: http://www.ema.europa.eu/ema/index.jsp?curl=/pages/medicines/human/medicines/002835/human_med_001790.jsp&mid=WC0b01ac058001d124
- Byrd RA, Blackbourne JL, Schultze AE, et al. Comparative subchronic toxicity studies in rats of LY2963016 (LY), an insulin glargine product, with USA sourced Lantus® (US-L) and EU-sourced Lantus® (EU-L). Toxicologist. 2014;138:1650.
- Linnebjerg H, Lam EC, Zhang X, et al. Duration of action of two insulin glargine products, LY2963016 insulin glargine and Lantus insulin glargine, in subjects with type 1 diabetes mellitus. Diabetes Obes Metab. 2017;19(1):33–39.
- Linnebjerg H, Lam EC, Seger ME, et al. Comparison of the pharmacokinetics and pharmacodynamics of LY2963016 insulin glargine and EU- and US-approved versions of Lantus insulin glargine in healthy subjects: three randomized euglycemic clamp studies. Dia Care. 2015;38(12):2226–2233.
- Zhang X, Lam ECQ, Seger ME, et al. LY2963016 insulin glargine and insulin glargine (Lantus) produce comparable pharmacokinetics and pharmacodynamics at two dose levels. Clin Pharmacol Drug Dev. 2017;6(6):556–563.
- Food and Drug Administration: Drug Approval Package: Lantus (Insulin Glargine [rDNA Origin]). NDA #21-081 2000 [Internet]. Silver Spring (MD): U.S. Food and Drug Administration. 2001, Nov 20; [cited 2019 May 28]. Available from: http://www.accessdata.fda.gov/drugsatfda_docs/nda/2000/21081_Lantus.cfm
- Nishiyama H, Shingaki T, Suzuki Y, et al. Similar intrapatient blood glucose variability with LY2963016 and Lantus® insulin glargine in patients with type 1 (T1D) or type 2 diabetes, including a Japanese T1D subpopulation. Diabetes Ther. 2018;9(4):1469–1476.
- Blevins TC, Dahl D, Rosenstock J, et al. Efficacy and safety of LY2963016 insulin glargine compared with insulin glargine (Lantus®) in patients with type 1 diabetes in a randomized controlled trial: the ELEMENT 1 study. Diabetes Obes Metab. 2015;17(8):726–733.
- Rosenstock J, Hollander P, Bhargava A, et al. Similar efficacy and safety of LY2963016 insulin glargine and insulin glargine (Lantus®) in patients with type 2 diabetes who were insulin-naïve or previously treated with insulin glargine: a randomized, double-blind controlled trial (the ELEMENT 2 study). Diabetes Obes Metab. 2015;17(8):734–741.
- Shaw JE, Sicree RA, Zimmet PZ. Global estimates of the prevalence of diabetes for 2010 and 2030. Diabetes Res Clin Pract. 2010;87(1):4–14.
- Hirose T, Chen CC, Ahn KJ, et al. Use of insulin glargine 100 U/mL for the treatment of type 2 diabetes mellitus in East Asians: a review. Diabetes Ther. 2019;10(3):805–833.
- Haneda M, Noda M, Origasa H, et al. Japanese Clinical Practice Guideline for Diabetes 2016. J Diabetes Investig. 2018;9(3):657–697.
- Ohashi Y, Wolden ML, Hyllested-Winge J, et al. Diabetes management and daily functioning burden of non‐severe hypoglycemia in Japanese people treated with insulin. J Diabetes Investig. 2017;8(6):776–782.
- Kobayashi M, Tsukube S, Ikeda Y, et al. Safety and efficacy of combination therapy with insulin glargine and oral hypoglycaemic agents including DPP-4 inhibitors in Japanese T2DM patients: ALOHA 2 study, a post-marketing surveillance for Lantus®. J Diabetes Mellitus. 2014;04(04):273–289.
- Ilag LL, Costigan TM, Deeg MA, et al. Clinical outcomes of patients with diabetes who exhibit upper-quartile insulin antibody responses after treatment with LY2963016 or Lantus® insulin glargine. Diabetes Ther. 2017;8(3):545–554.
- Pollom RK, Costigan T, Lacaya LB, et al. Similar efficacy and safety of Basaglar® and Lantus® in patients with type 2 diabetes in age groups (<65 years, ≥65 years): a post hoc analysis from the ELEMENT-2 study. Diabetes Ther. 2018;9(2):827–837.
- Ishii H, Iwamoto Y, Tajima N. An exploration of barriers to insulin initiation for physicians in Japan: findings from the Diabetes Attitudes, Wishes and Needs (DAWN) JAPAN study. PLoS One. 2012;7(6):e36361.
- Polonsky WH, Fisher L, Hessler D, et al. Identifying solutions to psychological insulin resistance: an international study. J Diabetes Complications. 2019;33(4):307–314.
- Okazaki K, Shingaki T, Cai Z, et al. Successful healthcare provider strategies to overcome psychological insulin resistance in Japanese patients with type 2 diabetes. Diabetes Ther. 2019;10(5):1823–1834.
- Hirano T. Pathophysiology of diabetic dyslipidemia. J Atheroscler Thromb. 2018;25(9):771–782.
- Jeong IK, Chung CH, Zhou Z, et al. Comparison of insulin intensification strategies with insulin lispro low mixture twice daily versus basal insulin glargine and prandial insulin lispro once daily in East Asian and Caucasian patients with type 2 diabetes mellitus. J Diabetes. 2017;9(4):396–404.
- Yki-Järvinen H, Bergenstal R, Ziemen M, et al. New insulin glargine 300 units/mL versus glargine 100 units/mL in people with type 2 diabetes using oral agents and basal insulin: glucose control and hypoglycemia in a 6-month randomized controlled trial (EDITION 2). Dia Care. 2014;37(12):3235–3243.
- Terauchi Y, Koyama M, Cheng X, et al. New insulin glargine 300 U/ml versus glargine 100 U/ml in Japanese people with type 2 diabetes using basal insulin and oral antihyperglycaemic drugs: glucose control and hypoglycaemia in a randomized controlled trial (EDITION JP 2). Diabetes Obes Metab. 2016;18(4):366–374.
- Shiramoto M, Eto T, Irie S, et al. Single-dose new insulin glargine 300 U/mL provides prolonged, stable glycaemic control in Japanese and European people with type 1 diabetes. Diabetes Obes Metab. 2015;17(3):254–260.
- Yabe D, Seino Y, Fukushima M, et al. β cell dysfunction versus insulin resistance in the pathogenesis of type 2 diabetes in East Asians. Curr Diab Rep. 2015;15(6):602.