
Abstract
Objective: Prior evaluations of ulcerative colitis (UC)-related costs are dated or encompassed limited follow-up. This study assessed the incremental direct and indirect work loss-related costs of privately-insured patients with UC in the United States, overall and in specific subgroups.
Methods: In this retrospective matched cohort study, the OptumHealth Care Solutions, Inc (formerly Optum Health Reporting and Insights employer) database (01 January 1999–31 March 2017) was used to identify adult patients with ≥2 claims for UC, who were matched 1:5 to patients with no claims for inflammatory bowel disease (IBD). UC subgroups were identified based on indicators during the observation period (i.e. use of biologics, opioids, or corticosteroids; UC-related surgery; moderate-to-severe disease; UC-related comorbidities). Healthcare resource utilization (HRU), work loss days, and direct and work loss-related costs were compared between matched cohorts. Descriptive analyses of direct and work loss-related costs were conducted within each UC subgroup.
Results: Compared to the non-IBD cohort (n = 46,765), the UC cohort (n = 9353) incurred higher HRU, including 128% more inpatients visits, resulting in $11,029 higher direct costs per patient per year (PPPY; $7170 vs. $18,198; p < .001). Patients in the UC cohort also incurred more work loss days, resulting in $2142 higher work loss-related costs PPPY ($3165 vs. $5307; p < .001). Direct and work loss-related costs were particularly high in the UC subgroups, with patients undergoing UC-related surgery incurring the highest costs.
Conclusions: Over ∼5 years follow-up, patients with UC had significantly higher all-cause direct healthcare and indirect work loss-related costs compared to matched patients without IBD.
Introduction
Ulcerative colitis (UC), one of two major types of inflammatory bowel disease (IBD), is a chronic inflammatory condition of the colon and rectum with an estimated 907,000 affected individuals in the United States (US) in 2014Citation1 and a prevalence that is increasingCitation2. Clinically, UC can alternate from episodes of active disease to periods of remissionCitation1,Citation3.
With no curative medical options, treatment aims to achieve and maintain corticosteroid-free symptomatic and endoscopic remissionCitation4. A step-up approach is often used, with mild-to-moderate disease being treated with 5-aminosalicylates (5-ASA) and/or corticosteroids (e.g. prednisone, budesonide). Patients with moderate-to-severe UC may need immunomodulators (e.g. azathioprine, 6-mercaptopurine), with others requiring treatment with advanced therapies such as biologic (e.g. adalimumab, infliximab, golimumab, vedolizumab, ustekinumab), or small molecule (e.g. tofacitinib) therapyCitation4–6. While biologic therapy is efficacious at inducing and maintaining remission in many patientsCitation7,Citation8, some patients may continue to use corticosteroids, and may ultimately require surgery (e.g. total proctocolectomy) if the disease cannot be controlled or severe complications ariseCitation3,Citation5.
Despite treatment, UC is associated with the development of several comorbidities, including persistent pain, rectal bleeding, anemia, anxiety, depression, weight loss, toxic megacolon, and colorectal cancerCitation1,Citation9–12. Management of disease flares may involve frequent use of corticosteroids, with opioids used in some patients to mitigate acute abdominal pain symptoms, both of which may lead to further complicationsCitation9,Citation13,Citation14. In the UC population, this results in morbidity and excess healthcare resource utilization (HRU), including both direct and indirect (e.g. loss in work productivity) costsCitation1,Citation15. Accordingly, the total annual direct and indirect cost burden in the US was estimated to be $8.1–14.9 billion in 2008, which is likely underestimating the current economic burden given the increasing prevalence of UCCitation2 and evolution of the UC treatment landscape over the last decade. Prior cost assessments are similarly outdated and present relatively short-term data, with the latest study evaluating the one-year incremental costs of UC relying on data from up to 2013Citation15,Citation16,Citation17. In addition, there is a lack of information on the burden among specific subgroups of patients, such as those undergoing surgery or chronic users of opioids or corticosteroids, signaling a need to provide contemporary, long-term estimates of the costs of UC. Therefore, this study assessed the incremental direct and indirect work loss-related economic burden of patients with UC compared to patients without IBD (i.e. without UC or Crohn’s disease [CD]), and that of specific subgroups of patients with UC.
Methods
Data source
An analysis of the OptumHealth Care Solutions, Inc employer claims database (formerly Optum Health Reporting and Insights employer claims) was conducted from 1 January 1999 to 31 March 2017 (18-year period). The OptumHealth Care Solutions, Inc employer claims database includes administrative claims for over 19.9 million privately-insured individuals covered by 84 self-insured Fortune 500 companies in the United States. The data include claims for all of the companies’ beneficiaries (i.e. employees, spouses, dependents, and retirees) nationwide. In addition, for 42 of the 84 companies, work loss data are available for their employees (approximately 4.4 million lives), including short- and long-term disability claims.
Data were de-identified and comply with the patient requirements of the Health Insurance Portability and Accountability Act (HIPAA); therefore, no reviews by an institutional review board were required.
Study design
A retrospective matched cohort design was used. Patients were classified into the UC cohort or non-IBD cohort (i.e. neither UC nor CD) based on claims for UC and/or IBD. For the UC cohort in the main analysis, the index date was the date of the first recorded medical claim with a diagnosis for UC following a 12-month washout (International Classification of Diseases, Ninth Revision, Clinical Modification [ICD-9-CM] code 556.x or International Classification of Diseases, Tenth Revision, Clinical Modification [ICD-10-CM] code K51.x; ), to focus on newly diagnosed patientsCitation18. For the non-IBD cohort (without ICD-9-CM 555.x, 556.x or ICD-10-CM K50.x, K51.x codes), the index date was randomly generated based on the distribution of time between the start of the most recent continuous insurance eligibility episode and the index date in the UC cohort.
Figure 1. Study design for the main analysis. Abbreviations. IBD, inflammatory bowel disease; UC, ulcerative colitis.
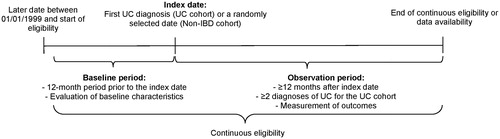
For the subgroup analysis, the subgroup-specific index date (SSID) was the date the indicator for the subgroup (see section “Subgroup sample selection” below) was first observed, on or after the first claim date with a UC ICD code. If a patient presented the subgroup indicator before the index date for the main analysis, the SSID was the index date for the main analysis. In subgroups composed of several indicators, the earliest date among the indicators was used as the SSID.
Patient characteristics were described during the 12-month baseline period before the index date. The observation period spanned from the index date/SSID until the earliest of end of continuous health plan eligibility or data availability (March 31, 2017 for direct costs and the latest date associated with a disability claim for each employer for indirect costs).
Study sample
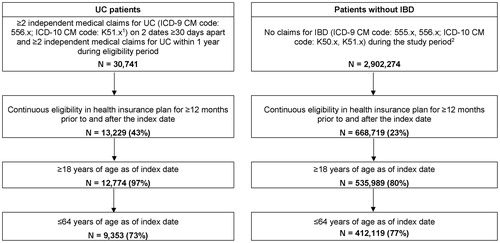
Using the most recent continuous period of health plan eligibility, working-aged adults (18–64 years) with ≥12 months of continuous health plan eligibility before and after the index date were selected (). Patients in the UC cohort were required to present ≥2 claims on different days with a UC diagnosis ≥1 and ≤12 months apart. Since UC is related to CD, an algorithm based on a majority of ICD codes was used to differentiate between the two conditionsCitation19,Citation20. Patients were classified as UC if (a) they had more UC-related inpatient (IP) admissions than CD-related IP admissions; (b) they had an equal number of UC- and CD-related IP admissions but more UC-related outpatient (OP) visits than CD-related OP visits; or (c) they had an equal number of UC- and CD-related IP admissions and OP visits (representing 74 patients or <1% of the study sample). Patients in the non-IBD cohort were required to have no diagnoses of IBD during the study period. No other exclusion based on diagnoses were implemented; patients in both cohorts were allowed to present with comorbidities and other diseases.
Figure 2. Sample selection for the UC and non-IBD cohorts. Abbreviations. IBD, inflammatory bowel disease; ICD-9-CM, International Classification of Disease, 9th revision, Clinical Modification; ICD-10-CM, International Classification of Disease, 10th revision, Clinical Modification; UC, ulcerative colitis. Notes: (1) Unspecified colitis (ICD-9 CM code: 558.xx, ICD-10 CM code: K52.xx) was not used to identify patients with UC. (2) A random sample of 20% of patients without a recorded diagnosis of IBD during the study period (1 January 1999 to 31 March 2017) was selected from the OptumHealth Care Solutions, Inc employer claims database.
Patients in the UC cohort were matched 1:5 to patients in the non-IBD cohort based on propensity score and exact matching. The propensity score was based on age at index date, sex, geographical region, Medicare coverage, insurance plan type, year and month of index date, type of beneficiary, Quan–Charlson Comorbidity Index (Quan-CCI)Citation21, and recorded diagnosis of cardiovascular diseases as independent variables. Five percentile calipers were used for the matching and exact matching factors included the availability of work loss data and year of index date.
Subgroup sample selection
Among patients with UC, the following non-mutually exclusive subgroups were identified based on indicators during the observation period of the main analysis: (a) UC-related surgery; (b) use of biologics; (c) ≥1 episode of ≥3 months of continuous use of opioids; (d) ≥1 episode of ≥3 months of continuous use of corticosteroids; (e) moderate-to-severe disease (defined as use of biologics, use of immunomodulators, ≥1 episode of ≥3 months of continuous use of intravenous or oral corticosteroids [excluding topical preparations but including all oral corticosteroids regardless of systemic absorption], or UC-related hospitalization, including UC-related surgery)Citation15,Citation17; and (f) UC-related comorbidities (i.e. anemia, anxiety or depression)Citation11,Citation12.
Outcome measures
Study outcomes measured during the observation period included HRU, direct healthcare costs, work loss days, indirect work loss-related costs, medication use, and comorbidities. Costs were assessed during the first 12 months post-index and over the entire observation period. HRU and direct healthcare costs (private payers’ perspective) were reported as medical (IP admissions and days, emergency department [ED] visits, OP visits, and other services not included in the other categories) and pharmacy components.
Indirect costs were estimated from the employer perspective. Work loss days and indirect costs were reported for a subset of patients with work loss data available based on previously published methodologyCitation22–25. Work loss days included medical-related absenteeism days and disability days. Absenteeism days on weekdays were imputed based on length of stay for IP admissions, one day for ED visits, or a half-day each for OP and other visits. Days when the patient was eligible for disability but not yet receiving the benefits were also included as absenteeism days. The number of disability days corresponded to the number of weekdays covered by the employer during the disability episode(s). Indirect work loss-related costs included medical-related absenteeism costs and short-term and long-term disability costs. Absenteeism costs were imputed based on the time absent from work multiplied by the employee’s daily wage. Disability costs were calculated as the number of weekdays covered by the employer during the disability episode(s) multiplied by the employee’s daily wage. Each employee’s actual daily wage was calculated as the annual wage (obtained from the employer) divided by the number of work days in a year (i.e. 5/7 of 365 days).
Medication use and comorbidities were also reported during the observation period and included the proportion of patients with the use of corticosteroids, opioids, 5-ASAs, immunomodulators, and biologics; UC-related hospitalization (i.e. IP stay with a primary or secondary UC code); UC-related surgeries; moderate-to-severe disease; and UC-related comorbidities during the observation period.
Statistical analysis
Patient baseline characteristics were summarized as means with standard deviation (SD) for continuous variables, and frequencies with proportions for categorical variables. The balance of patient characteristics between the cohorts was assessed using standardized differences (i.e. standardized difference <10% considered well-balanced)Citation26.
HRU, work loss days, and direct and indirect costs were reported per patient per year (PPPY) and compared between the matched UC and non-IBD cohorts. Incremental HRU and work loss days between the cohorts were estimated using negative binomial regression, with results reported as incidence rate ratios (IRRs) with 95% confidence intervals (CIs) and p-values. Incremental direct and indirect costs between the UC and non-IBD cohorts were estimated using ordinary least square models with a non-parametric bootstrap (499 resamples) used to obtain the 95% CIs and p-values. Costs were inflated using the medical care component of the US Consumer Price Index for Urban Consumers and reported in 2017 USD.
Medication use and comorbidities of patients in the UC cohort were described during the observation period using means, SDs, and medians for continuous variables and frequencies and proportions for binary variables.
Within the UC subgroups, a descriptive analysis of direct and indirect costs was conducted; no statistical comparisons were made.
All analyses were conducted using SAS EG 7.1 (SAS Institute, Cary, NC).
Results
Baseline characteristics
After matching, 9353 patients in the UC cohort and 46,765 patients in the non-IBD cohort were included in the study sample; based on standardized differences, the cohorts were well balanced. The mean age was 46.1 and 46.3 years in the UC and non-IBD cohorts, respectively, and ∼50% were female (). IBD-related comorbidities were present at baseline in 5778 (61.8%) and 22,245 (47.6%) patients in the UC and non-IBD cohorts, respectively. Work loss data was available for 1763 (18.8%) and 8815 (18.8%) patients in the UC and non-IBD cohorts, respectively. The observation period was 4.9 years in the UC cohort and 4.7 years in the non-IBD matched cohort for direct costs and 5.4 and 5.0 years for indirect work loss-related costs, respectively. The Quan-CCI was 0.3 in both cohorts, signaling that the cohorts were balanced at baseline for these comorbidities.
Table 1. Baseline characteristics in the UC and non-IBD cohorts.
HRU among matched cohorts
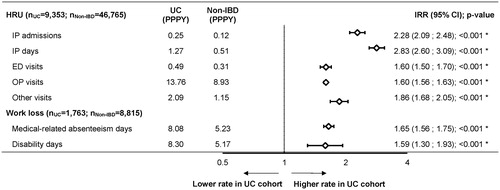
Over the observation period and on a PPPY basis, patients in the UC cohort incurred 128% more IP admissions (IRR [95% CI]: 2.28 [2.09; 2.48]; p < .001), 183% more IP days (IRR [95% CI]: 2.83 [2.60; 3.09]; p < .001), 60% more ED visits (IRR [95% CI]: 1.60 [1.50; 1.70]; p < .001), and 60% more OP visits (IRR [95% CI]: 1.60 [1.56; 1.63]; p < .001; ) compared to patients in the non-IBD cohort.
Figure 3. All-cause HRU and work loss days in the UC and non-IBD cohorts. *Statistical significance at the .05 level. Abbreviations. CI, confidence interval; ED, emergency department; HRU, healthcare resource utilization; IBD, inflammatory bowel disease; IP, inpatient; IRR, incidence rate ratio; OP, outpatient; PPPY, per patient per year; UC, ulcerative colitis.
Direct healthcare costs among matched cohorts
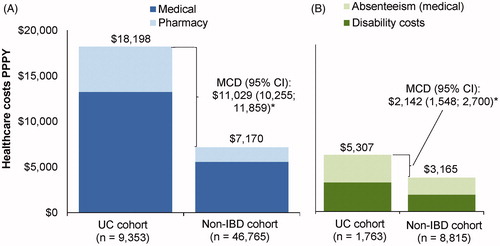
Over the observation period, patients in the UC cohort incurred $11,029 ($18,198 vs $7170; [95% CI: $10,255; $11,859]; p < .001) more in annualized direct total healthcare costs PPPY compared to the non-IBD cohort, including $7660 ($13,234 vs. $5574; [95% CI: $6981; $8498]; p < .001) more in medical costs PPPY, which comprised $3712 ($5814 vs. $2101; [95% CI: $3196; $4377]; p < .001) more in IP costs, $336 ($639 vs. $303; [95% CI: $284; $383]; p < .001) more in ED costs, and $3427 ($6427 vs. $3000; [95% CI: $3157; $3722]; p < .001) more in OP costs; as well as $3368 ($4964 vs. $1596; [95% CI: $3185; $3539]; p < .001) more in prescription drug costs ().
Figure 4. Direct (A) and indirect (B) healthcare costs (2017 USD) among patients in the UC and non-IBD cohorts. *Statistical significance at the .05 level. Abbreviations. CI, confidence interval; IBD, inflammatory bowel disease; MCD, mean cost difference; PPPY, per patient per year; UC, ulcerative colitis.
During the first 12 months after the first diagnosis of UC, direct incremental costs between the UC and non-IBD cohorts were numerically larger than those of the full observation period. Indeed, in the first 12 months after the first diagnosis of UC patients in the UC cohort incurred $14,261 ($20,727 vs. $6466; [95% CI: $13,232; $15,426]; p < .001) more in direct total healthcare costs PPPY compared to patients in the non-IBD cohort respectively, including $11,089 ($16,121 vs. $5032; [95% CI: $10,099; $12,200]; p < .001) more in medical costs PPPY and $3172 ($4605 vs. $1433; [95% CI: $3011; $3325]; p < .001) more in prescription drug costs.
Work loss among matched cohorts
Over the observation period and on a PPPY basis, patients in the UC cohort had 65% more medical-related absenteeism days (IRR [95% CI]: 1.65 [1.56; 1.75]; p < .001) and 59% more disability days (IRR [95% CI]: 1.59 [1.30; 1.93]; p < .001; ) compared to patients in the non-IBD cohort. Accordingly, patients in the UC cohort incurred $2142 ($5307 vs $3165; [95% CI: $1548; $2700]; p < .001) more in annualized indirect costs PPPY compared to the non-IBD cohort, including $1002 ($2592 vs. $1590; [95%CI: $845; $1164]; p < .001) more in absenteeism costs PPPY, with over half of the absenteeism cost difference due to OP visits only ($588; $1729 vs. 1140 [95% CI: $486; $702]; p < .001), and $1140 ($2714 vs. $1575; [95% CI: $593; $1692]; p < .001) more in disability costs ().
During the first 12 months after the first diagnosis of UC, patients in the UC cohort incurred $2214 ($4784 vs. $2570; [95% CI: $1637; $2798]; p < .001) more in indirect costs PPPY compared to the non-IBD cohort, including $1478 ($2993 vs. $1515; [95% CI: $1286; $1681]; p < .001) more in absenteeism costs and $736 ($1791 vs. $1055; [95% CI: $180; $1287] p = .008) more in disability costs.
Medication use and comorbidities
During the observation period, corticosteroids were used by 6800 (72.7%) patients in the UC cohort, of whom 1230 (18.1%) had ≥3 months of continuous corticosteroid use. Opioids were used by 6340 (67.8%) patients, with 660 (10.4%) of those having an episode of ≥3 months opioid continuous use (). Biologics were used by 889 (9.5%) patients in the UC cohort, of whom 192 (21.6%) had ≥3 months of continuous use of corticosteroids following the first record of biologic use. In a subset of 7047 patients with UC and end of eligibility ≥2012 (year of adalimumab approval for the treatment of UC), 798 (11.3%) patients were treated with biologics.
Table 2. Medication use and comorbidities of patients in the UC cohort (indicators for subgroups).
Based on the indicators, 3652 (39.0%) patients were considered to have moderate-to-severe disease. Regarding comorbidities, 2635 (28.2%) patients in the UC cohort had at least one recorded claim for anemia and 2614 (27.9%) had at least one recorded claim for anxiety or depression.
Costs within subgroups of patients with UC
Direct total healthcare costs PPPY were numerically higher in the subgroups compared to the whole UC cohort, and ranged from $41,173 among patients with anxiety or depression to $114,535 among patients with a UC-related surgery (). The subgroups of patients with biologics use and ≥3 months of corticosteroid use incurred direct costs of $77,510 (>50% of which were pharmacy costs) and $49,191 PPPY, respectively. Among the 400 patients with UC-related surgeries, 50 (12.5%) had all-cause direct costs exceeding $200,000 PPPY.
Figure 5. Direct and indirect healthcare costs (2017 USD) among subgroups of patients with UC. Abbreviations. PPPY, per patient per year; UC, ulcerative colitis
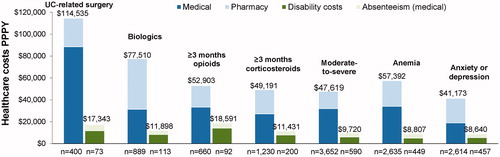
Similarly, indirect costs PPPY were numerically higher in the subgroups compared to the whole UC patient cohort and ranged from $8640 among patients with anxiety or depression to $18,591 among patients with ≥3 months of opioid use (). The subgroups of patients with a UC-related surgery and ≥3 months of corticosteroid use incurred indirect costs of $17,343 and $11,431 PPPY, respectively.
Discussion
In this large, retrospective cohort study of real-world data with an average follow-up of approximately 5 years over all US census regions, patients with UC incurred higher HRU, work loss days, and all-cause direct and indirect work loss-related costs compared to matched patients without IBD.
Our study provides insight on the healthcare services contributing to the high costs of patients with UC. Although medical healthcare costs were mostly due to IP and OP visits, medical absenteeism costs were largely driven by OP visits. The few IP stays were expensive, but a substantial cost was also incurred by work loss for frequent OP appointments and procedures. Indeed, as a chronic disease, even patients in remission still require frequent OP visits to monitor for signs of relapse and for routine health maintenance and surveillance for colon cancerCitation3,Citation4.
While the association between UC and high HRU and costs has been demonstrated in the literatureCitation15–18,Citation27,Citation28, aside from a study by Cohen et al.Citation15, most comparative studies conducted in the US are now outdated (e.g. direct cost studies published in 2008Citation16,Citation17,Citation28) or evaluated IBD as a wholeCitation18, with short follow-up periods that did not encompass the introduction of biologic therapy in the last decade. The present study identified a substantially higher economic burden in patients with UC compared to patients without IBD in the current treatment era, which is consistent with the results presented in the analysis conducted by Cohen et al.Citation15. The authors found that patients with UC had significantly more HRU and work loss, resulting in $10,753 higher average annual direct costs and $2192 higher average annual work loss-related costs versus matched patients without IBD (2013 USD). While these cost differences align well with the current results, the one-year observation period used by Cohen et al. may not have captured the same chronic burden of UC measured in the 4–5-year follow-up of the current study. Indeed, results of this study show that although the first year direct healthcare costs were higher (i.e. $20,727 PPPY), the annualized costs were sustained and comparable over the full follow-up (i.e. $18,198 PPPY in the UC cohort). To our knowledge, this is the first US study with such a long follow-up capturing the chronic aspects of the disease. Indeed, while many patients achieve remissions lasting more than a year, fluctuating disease activity is a well-known characteristic of UCCitation29. Consequently, HRU and costs associated with the relapsing and remitting disease course may also vary over time, with long-term costs potentially differing substantially compared to those captured over a shorter period.
Older studies also compared direct costs of privately or self-insured patients with and without UC, albeit encompassing only one-year follow-upsCitation16,Citation17. Accounting for inflation, both studies reported incremental direct costs associated with UC comparable to the present study, signaling that UC has remained a significant burden over the last decadeCitation16,Citation17. In contrast, Kappelman et al. reported lower incremental direct costs than the present study, possibly because of differences in patient selection, notably the use of a combination of diagnosis and pharmacy claims to identify patients with UCCitation28.
In contrast to direct costs, the literature on indirect work loss costs associated with UC is limited. In a review of indirect UC costs, Kawalec identified four studies (two US-based) published between 1990 and 2014Citation27. There was considerable variability between yearly indirect costs per patient ($926–$6583 in 2013 USD), due to differences in cost calculations and components, making comparisons between studies challenging. Therefore, the current study addresses an unmet need by providing a comprehensive and up-to-date assessment of indirect costs in patients with UC in the US.
A recent claims-based study by Park et al. focused on the direct and indirect costs of patients with vs without IBD (i.e. UC and CD combined) and is thus not directly comparable with this UC-focused study. The direct incremental costs reported by Park et al. were higher ($16,031 per member per year in 2016 USD) than in the present study, probably because of the typically-higher costs of CD. Conversely, the incremental indirect costs reported by Park et al. were similar (∼$2100) despite lower absolute indirect costs. This may be because wages were estimated from the Bureau of Labor Statistics, and disability costs were not measured, thereby missing a component included in the current studyCitation18.
In addition to the economic burden of the overall UC population, we also identified specific subgroups incurring higher costs. Despite the reported reduction in direct costs following surgeryCitation30, patients who underwent UC-related surgery incurred considerable direct and indirect costs, likely from the cost of surgery itself and after-care including complications, as well as a more severe stage of the diseaseCitation31–33. There were 889 (9.5%) patients using biologics, in range with Yu et al., who reported a proportion of 5.1–16.2% over 2007–2015Citation34. Among patients treated with biologics in the present study, high direct costs were observed and were driven by pharmacy costs, representative of the higher drug costs. However, similar to the subgroup treated with surgery, patients receiving biologics may also have had more severe disease since biologics are typically used to treat patients with moderate-to-severe UC that is not responsive to conventional therapy. Indeed, 21.6% of biologic users (192 out of 889 patients) had ≥3 months of continuous use of corticosteroids and 12.8% (114 patients out of 889) had a UC-related surgery following the biologic, which may represent patients with refractory disease who required the use of more than one drug or of surgery to control symptoms, underlining the challenges associated with UC management. Using a more conservative approach to identify patients with highly active disease, the moderate-to-severe subgroup incurred numerically lower healthcare costs than the biologics subgroup, but costs were still 2.6- and 1.8-times higher than the direct and indirect costs of the overall UC cohort, respectively. Finally, the highest indirect costs were observed among patients with at least one episode of ≥3 months of opioid use, signaling considerable disability and absenteeism in this subgroup, even when excluding presenteeism costs that were not quantified.
Limitations
This study is subject to some limitations. First, the study design was observational and retrospective, potentially leading to residual confounding due to unmeasured confounders. Second, absenteeism was imputed based on days with a medical visit claim, so absenteeism unrelated to a medical visit was not observed, unless it was captured as short- or long-term disability. Additionally, indirect costs due to presenteeism were not assessed, leading to an underestimation of the total UC-related economic burden. Third, as in any claims database, there may be coding inaccuracies, and the first recorded claim for a UC diagnosis may not represent the actual first diagnosis, which implies that the baseline costs for the UC cohort may include costs related to colitis not yet classified as UC. A recorded prescription fill also does not imply that the medication was taken as prescribed. In addition, the costs to the private payer may be overestimated as the database did not include potential rebates. Fifth, without access to patient medical files, and notably the unavailability of clinical scores and endoscopic assessments, the severity of UC could not be ascertained to confirm moderate-to-severe disease. Of note, the proportion of patients with moderate-to-severe disease identified in this study was not directly comparable to that found in the literature given the use of clinical indicesCitation35. A validation study using patient medical files linked to insurance claims would be an interesting avenue of future research. Lastly, the results of this study may not be generalizable to the population at large given the focus on working-aged adults in a privately-insured patient population (pediatric and elderly patients excluded) where indirect cost data were available only in a subset of patients.
Conclusions
In this real-world, contemporary analysis of patients with UC, direct healthcare and indirect work loss-related costs were substantially higher compared to matched patients without IBD. The elevated economic burden of UC over an average of almost 5 years of observation suggests that direct and indirect costs remain chronically high following UC diagnosis. In particular, the subgroups of patients with UC-related surgery and those who used biologics incurred the highest costs. This elevated economic burden, along with the observed chronic use of corticosteroids and opioids ≥3 months, emphasizes the unmet need for new therapeutic approaches that may help to reduce the burden of this chronic and debilitating disease.
Transparency
Declaration of funding
This study was funded by Janssen Scientific Affairs, LLC. The study sponsor was involved in several aspects of the research, including the study design, the interpretation of data, the writing of the manuscript, and the decision to submit the manuscript for publication.
Declaration of financial/other relationships
DP, AMM, FK, MHL and PL are employees of Analysis Group, Inc., which provided paid consultancy services to Janssen Scientific Affairs, LLC for the conduct of the present study. CO, ZD, JV, and EM are employees of Janssen Scientific Affairs, LLC and stockholders of Johnson and Johnson, Inc. Peer reviewers on this manuscript have received an honorarium from CMRO for their review work but have no other relevant financial relationships to disclose.
Author contributions
DP, AMM, FK, MHL, and PL contributed to study conception and design, collection and assembly of data, and data analysis and interpretation. CO, ZD, JV, and EM contributed to study conception and design, as well as interpretation. All authors reviewed and approved the final content of this manuscript.
Previous presentation
Part of the material in this manuscript was presented on May 19 at Digestive Disease Week held from May 18–21, 2019 in San Diego, CA, and on October 27 at the American College of Gastroenterology meeting 2019 held from October 25–30, 2019 in San Antonio, TX.
Acknowledgements
Medical writing assistance was provided by Christine Tam, and assistance in the analysis was provided by Maryia Zhdanava. Both are employees of Analysis Group, Inc., which provided paid consultancy services to Janssen Scientific Affairs, LLC for the conduct of the present study.
References
- Crohn’s & Colitis Foundation of America [Internet]. 2014. [cited 2018 May 15]. Available from: http://www.crohnscolitisfoundation.org/assets/pdfs/updatedibdfactbook.pdf
- Kappelman MD, Moore KR, Allen JK, et al. Recent trends in the prevalence of Crohn's disease and ulcerative colitis in a commercially insured US population. Dig Dis Sci. 2013;58(2):519–525.
- Ungaro R, Mehandru S, Allen PB, et al. Ulcerative colitis. Lancet. 2017;389(10080):1756–1770.
- Rubin DT, Ananthakrishnan AN, Siegel CA, et al. ACG clinical guideline: ulcerative colitis in adults. Am J Gastroenterol. 2019;114(3):384–413.
- Arora Z, Shen B. Biological therapy for ulcerative colitis. Gastroenterol Rep (Oxf). 2015;3(2):103–109.
- Sands BE, Sandborn WJ, Panaccione R, et al. Ustekinumab as induction and maintenance therapy for ulcerative colitis. N Engl J Med. 2019;381(13):1201–1214.
- Sandborn WJ, van Assche G, Reinisch W, et al. Adalimumab induces and maintains clinical remission in patients with moderate-to-severe ulcerative colitis. Gastroenterology. 2012;142(2):257–265.
- Rutgeerts P, Sandborn WJ, Feagan BG, et al. Infliximab for induction and maintenance therapy for ulcerative colitis. N Engl J Med. 2005;353(23):2462–2476.
- Bielefeldt K, Davis B, Binion DG. Pain and inflammatory bowel disease. Inflamm Bowel Dis. 2009;15(5):778–788.
- Jess T, Rungoe C, Peyrin-Biroulet L. Risk of colorectal cancer in patients with ulcerative colitis: a meta-analysis of population-based cohort studies. Clin Gastroenterol Hepatol. 2012;10(6):639–645.
- Mikocka-Walus A, Pittet V, Rossel J-B, et al. Symptoms of depression and anxiety are independently associated with clinical recurrence of inflammatory bowel disease. Clin Gastroenterol Hepatol. 2016;14(6):829–835.e1.
- Wilson A, Reyes E, Ofman J. Prevalence and outcomes of anemia in inflammatory bowel disease: a systematic review of the literature. Am J Med. 2004;116(7):44–49.
- Waljee AK, Wiitala WL, Govani S, et al. Corticosteroid use and complications in a US inflammatory bowel disease cohort. PLoS One. 2016;11(6):e0158017.
- Lin X, Lofland J, Zhang L, et al. Opioid use in patients with inflammatory bowel disease. Crohn’s & Colitis 360. 2020;2(1):otaa009.
- Cohen R, Skup M, Ozbay AB, et al. Direct and indirect healthcare resource utilization and costs associated with ulcerative colitis in a privately-insured employed population in the US. J Med Econ. 2015;18(6):447–456.
- Gibson TB, Ng E, Ozminkowski RJ, et al. The direct and indirect cost burden of Crohn’s disease and ulcerative colitis. J Occup Environ Med. 2008;50(11):1261–1272.
- Hillson E, Dybicz S, Waters HC, et al. Health care expenditures in ulcerative colitis: the perspective of a self-insured employer. J Occup Environ Med. 2008;50(8):969–977.
- Park KT, Ehrlich OG, Allen JI, et al. The cost of inflammatory bowel disease: an initiative from the Crohn’s & Colitis Foundation. Inflamm Bowel Dis. 2020;26(1):1–10.
- Bernstein CN, Blanchard JF, Rawsthorne P, et al. Epidemiology of Crohn's disease and ulcerative colitis in a central Canadian province: a population-based study. Am J Epidemiol. 1999;149(10):916–924.
- Shaw SY, Blanchard JF, Bernstein CN. Association between the use of antibiotics and new diagnoses of Crohn’s disease and ulcerative colitis. Am J Gastroenterol. 2011;106(12):2133–2142.
- Quan H, Li B, Couris CM, et al. Updating and validating the Charlson comorbidity index and score for risk adjustment in hospital discharge abstracts using data from 6 countries. Am J Epidemiol. 2011;173(6):676–682.
- Amos TB, Tandon N, Lefebvre P, et al. Direct and indirect cost burden and change of employment status in treatment-resistant depression: a matched-cohort study using a US commercial claims database. J Clin Psychiatry. 2018;79(2):17m11725.
- Pilon D, Teeple A, Zhdanava M, et al. The economic burden of psoriasis with high comorbidity among privately insured patients in the United States. J Med Econ. 2019;22(2):196–203.
- Ramasamy A, Laliberte F, Aktavoukian SA, et al. Direct and indirect cost of obesity among the privately insured in the United States: a focus on the impact by type of industry. J Occup Environ Med. 2019;61(11):877–886.
- Sarrel P, Portman D, Lefebvre P, et al. Incremental direct and indirect costs of untreated vasomotor symptoms. Menopause. 2015;22(3):260–266.
- Austin PC. An introduction to propensity score methods for reducing the effects of confounding in observational studies. Multivariate Behav Res. 2011;46(3):399–424.
- Kawalec P. Indirect costs of inflammatory bowel diseases: Crohn's disease and ulcerative colitis. A systematic review. Arch Med Sci. 2016;12(2):295–302.
- Kappelman MD, Rifas–Shiman SL, Porter CQ, et al. Direct health care costs of Crohn's disease and ulcerative colitis in US children and adults. Gastroenterology. 2008;135(6):1907–1913.
- Timmer A, Patton PH, Chande N, et al. Azathioprine and 6-mercaptopurine for maintenance of remission in ulcerative colitis. Cochrane Database Syst Rev. 2016;18(5):CD000478.
- Holubar S, Long K, Loftus E, et al. Long-term direct costs before and after proctocolectomy for ulcerative colitis: a population-based study in olmsted County, Minnesota. Dis Colon Rectum. 2009;52:1815–1823.
- Andersson P, Soderholm JD. Surgery in ulcerative colitis: indication and timing. Dig Dis. 2009;27(3):335–340.
- Loftus EV, Leonard P, Yang M, et al. 1099 A retrospective study of colectomy complications and their associated costs for patients with ulcerative colitis. Gastroenterology. 2012;142(5):S-198.
- Peyrin-Biroulet L, Germain A, Patel AS, et al. Systematic review: outcomes and post-operative complications following colectomy for ulcerative colitis. Aliment Pharmacol Ther. 2016;44(8):807–816.
- Yu H, MacIsaac D, Wong JJ, et al. Market share and costs of biologic therapies for inflammatory bowel disease in the USA. Aliment Pharmacol Ther. 2018;47(3):364–370.
- Fumery M, Singh S, Dulai PS, et al. Natural history of adult ulcerative colitis in population-based cohorts: a systematic review. Clin Gastroenterol Hepatol. 2018;16(3):343–356.e3.