
Abstract
Objective
To investigate the predictive factors associated with physical impairment among older patients with type 2 diabetes mellitus (T2DM) in Japan and to examine the potential impact of physical impairment on patient-reported health outcomes in this population.
Methods
A cross-sectional analysis was conducted using patient-reported data from the 2012–2014 Japan National Health and Wellness Survey. Physical impairment was measured using the Physical Component Summary (PCS) score of the Short-Form 36-Item Health Survey (SF-36) three-component model (using Japanese norms). Older T2DM patients (≥65 years old; n = 1511) were dichotomized into physically impaired (PCS ≤ 25th percentile; n = 378) and non-physically impaired (PCS > 25th percentile; n = 1133). Work productivity (absenteeism, presenteeism and overall work impairment), activity impairment and healthcare resource utilization were compared between these groups.
Results
Age, female sex, low and high body mass index (BMI), diabetes-related complications, cardiovascular events, unawareness of having hypoglycemic events in the past 3 months, and lack of regular exercise were significant factors associated with physical impairment in multivariable analysis. The physically impaired group reported significantly more regular outpatient visits (13.48 vs. 10.16, respectively, p < .001), 1% or greater absenteeism (16.7% vs. 4.1%, p = .005), greater presenteeism (27.8% vs. 12.2%, p = .001), overall work impairment (30.0% vs. 13.0%, p = .001) and overall activity impairment (39.5% vs. 17.2%, p < .001) than the non-physically-impaired group after adjusting for covariates.
Conclusions
This study identified age, BMI, diabetes-related comorbidities, history of cardiovascular events and lack of exercise as key predictors associated with physical impairment in older patients with T2DM in Japan, which predicted low work productivity as well as activity impairment. This study provides support that physical impairment in patients with T2DM may lead to low work productivity and activity impairment.
Supplemental data for this article is available online at https://doi.org/10.1080/03007995.2020.1846170.
Introduction
Type 2 diabetes mellitus (T2DM) is characterized by hyperglycemia due to multiple abnormalities that include impaired insulin secretion and peripheral insulin resistanceCitation1,Citation2. In Japan, the population of people living with diabetes amounts to about 7.9% of adults aged 20–79 yearsCitation1. The proportion of people over the age of 65 in Japan is rapidly increasing due to increased longevity and lifestyle changesCitation3,Citation4. In 2014, the population in Japan over the age of 65 and 75 years accounted for approximately 70% and 35% of the patients with diabetes, respectivelyCitation5.
Older patients with T2DM tend to exhibit reduced physical and cognitive functionCitation6, as well as greater vulnerability to hypoglycemiaCitation7,Citation8 and other geriatric syndromesCitation9. Aging, diabetic microvascular and macrovascular complications, hyperglycemia, hypoglycemia, comorbidities, and lack of social support are risk factors for geriatric syndrome. Some elements of geriatric syndrome, such as depression, adversely affect these risk factors, forming a vicious cycle, which leads to increased mortalityCitation10.
Increasing evidence suggests that older individuals with T2DM are at increased risk of frailtyCitation11,Citation12. Frailty, the hallmark of the aging process, has been defined by the Cardiovascular Health Study (CHS; hereinafter referred to as the CHS criteria) as having at least three of the following: weakness (grip strength), unintentional weight loss, slow walking speed, self-reported exhaustion and low physical activityCitation13. There is a lack of consensus on the definition of frailty or how frailty should be assessedCitation14. Since frailty based on the CHS criteria requires clinical assessment of muscle mass and strength, alternative methods to measure frailty based on self-report have been used, including the physical function scale of the Short-Form 36-Item Health Survey (SF-36) questionnaire, which showed lower scores in frail individuals compared to non-frail and pre-frail individualsCitation15, and the Physical Component Summary (PCS) score of the SF-36 to define physical functioning, which significantly predicted mortalityCitation16.
Physical function impairment is one of the core components of frailtyCitation6,Citation17. In general, physical impairment and frailty have been associated with lower health-related quality of life (HRQoL), including physical domainsCitation18–20. Indeed, in one study, while pre-frail individuals had a mean PCS score of 42.6, frail individuals had a mean PCS score of 29.6Citation18. In a sample of Chinese elderly patients with prediabetes, lower adjusted PCS scores were associated with being physically inactive, another component of frailtyCitation21. Decline in physical performance was also observed in a large-scale prospective study of older Japanese T2DM patientsCitation22. Using the 5-item FRAIL scale, a significant association was found between frailty and diabetic nephropathy, activities of daily living (ADL) disability, and greater number of hospitalizations after adjusting for covariates in a sample of Chinese older people with T2DMCitation23.
Given the important role of physical impairment in frailty and outcomes of older patients with T2DM, the current study aimed to help inform by: (1) identifying patient characteristics associated with physical impairment in older patients with T2DM in Japan; and (2) examining the potential impact of physical impairment on patient-reported outcomes, such as work productivity and overall activity impairment.
Methods
Sample
This retrospective, cross-sectional, internet-based study included respondents (aged 18 years or older) who completed the 2012–2014 Japan National Health and Wellness Survey (NHWS). In cases where respondents participated in multiple survey years, the most recent data were retained for analyses. Respondents age 65 and older were identified from adults who self-reported a diagnosis of T2DM in the NHWS. The data from all three years were combined to maximize the sample size of older respondents with T2DM. Information regarding survey sampling is presented in .
Figure 1. Survey sampling.
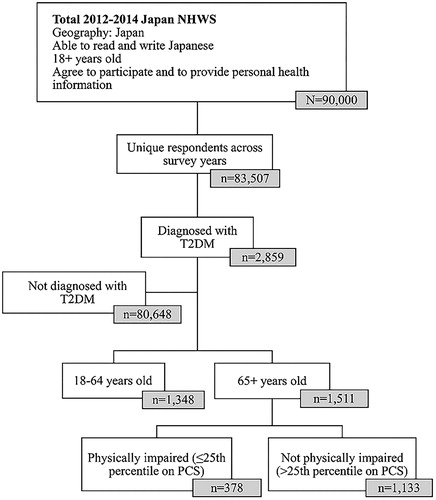
Potential respondents were identified through the general panel of Lightspeed Research (LSR), who were recruited through opt-in e-mail, co-registration with LSR partners, e-newsletter campaigns, banner placements, and both internal and external affiliate networks. All potential panelists registered through a unique e-mail address and password, explicitly agreed to join the panel, and received invitations to participate in a limited number of online surveys per year. The NHWS uses a stratified random sample framework with quotas approximating the gender and age distribution of the Japan general population. More details on the Japan NHWS participant recruitment procedures and sampling framework have been published elsewhereCitation24. Respondents provided informed consent to participate in the NHWS and received points that were exchanged for prizes for their participation. The NHWS received Essex Institutional Review Board (Lebanon, NJ, USA) approval (approval numbers: KH-NHWS-JP2012-396 in 2012; KH-NHWS-JP13 in 2013) and Pearl Institutional Review Board (Indianapolis, IN) approval (approval number: 14-KAN-106 in 2014), and all respondents were informed about confidentiality in the statement of informed consent. Representativeness of NHWS data has been validated and weighted against reliable sources, including government health statistics and unaffiliated third partiesCitation24. The following measures about physical impairment, demographics, health history, T2DM characteristics, healthcare resource utilization, work productivity and overall activity impairment were extracted from the Japan NHWS database.
Measures
Physical impairment
Physical impairment was measured using the PCS score of the SF-36 three-component model (Japanese norms)Citation25. Physical impairment was defined by a score equal to or less than the 25th percentile on the PCSCitation26. Comparison groups were defined using this PCS score. Older T2DM patients were grouped into those who were physically impaired (PCS ≤25th percentile) and those who were not physically impaired (PCS > 25th percentile).
Demographics
Patient characteristics included age, sex (male or female), marital status (married/living with partner vs. not), educational level (university degree vs. not), employment status (employed vs. not), and income (less than ¥3 million, from ¥3 million to less than ¥5 million and ¥5 million or greater).
Health history
Health history included body mass index (BMI: underweight, normal weight, overweight, obese or unknown), exercise (vigorous exercise for 20 or more minutes at least 3 times per week in the past month), alcohol consumption (consumes alcohol over 2–3 times week or more vs. not), smoking status (current smoker vs. not), Charlson comorbidity index (CCI) scoresCitation27 (a measure assessing comorbidity mortality), diagnosis of any cancer (breast, cervical, colorectal, leukemia, lymphoma, metastatic solid tumor, non-small cell lung, ovarian, prostate, skin, small cell lung, uterine or other cancers vs. no cancer), and diagnosis of cardiovascular event (heart attack, stroke, peripheral vascular disease or congestive heart failure vs. none).
Type 2 diabetes mellitus characteristics
Clinical T2DM characteristics included years from diagnosis, hemoglobin A1c (HbA1c; ≤6.4%, 6.5% to 6.9%, 7.0% to 7.4%, 7.5% to 7.9%, 8.0% to 8.4% or ≥8.5%), diabetes-related complications (foot or leg ulcer, kidney disease, macular edema or diabetic retinopathy, neuropathic pain, or end organ damage vs. no comorbidities), history of any hypoglycemia and its severity (never experienced, none in past 3 months, non-severe, severe or don’t know). Treatment information included current treatment for managing diabetes, including insulin usage (yes vs. no), number of oral hypoglycemic medications and adherence to diabetes medications using the Morisky Medication Adherence Scale 8-item (©MMAS-8) measureCitation28.
Healthcare resource utilization
Outcome measures included healthcare resource utilization, namely number of regular outpatient visits (general internist, allergist, cardiologist, dentist, dermatologist, diabetologist, endocrinologist, gastroenterologist, hepatologist, neurologist, nephrologist, oncologist, ophthalmologist, orthopedist, otolaryngologist, plastic surgeon, psychiatrist, psychologist/therapist, pulmonologist, rheumatologist, urologist and other medical specialist), whether or not the patient was hospitalized, and whether or not the patient had an emergency room (ER) visit in the last 6 months.
Work productivity and activity impairment
The Work Productivity and Activity Impairment (WPAI) – General Health Questionnaire Version 2Citation29 generates four subscales assessing work productivity and activity impairment. Absenteeism represents the percentage of time missed from work, while presenteeism represents the percentage of time impaired while at work. Overall work impairment is a weighted combination of absenteeism and presenteeism. Activity impairment represents the percentage of impairment in daily activities. The WPAI subscales are scored in the form of percentages; higher values indicate greater impairment as a result of the patient’s health in the past 7 days. Absenteeism, presenteeism and overall work impairment were only calculated for respondents who were currently employed (full-time, part-time or self-employed). Furthermore, absenteeism and overall work impairment were not calculated for those who worked 0 h and missed 0 h in the past 7 days (n = 433), and presenteeism is only asked among those who worked >0 h in the last 7 days (n = 439). Activity impairment was calculated for all respondents.
Statistical analysis
Descriptive statistics were calculated for the study variables, using frequencies and percentages for categorical variables and means and standard deviations for continuous variables. Bivariate analyses were used to examine differences between the physically impaired and non-physically-impaired groups on demographics, patient health history and characteristics, healthcare resource utilization, and work and activity impairment, using chi-square tests for categorical variables and independent samples t tests for continuous variables.
Multivariable analysis was used to determine predictors of physical impairment. A generalized linear model, specifying a binomial distribution and log-link function, was used to assess physical impairment (dichotomous), as a function of patient demographics and clinical characteristics and treatment: for example, older age, vigorous exercise, smoking, alcohol, history of cancer, hypoglycemic severity in the last 3 months, diagnosis with diabetes-related comorbidity, diagnosis with cardiovascular event, insulin usage, low or medium adherence, HbA1c category, sex, years from diagnosis, and BMI. All variables identified as significantly different between groups in the bivariate analyses, plus those of a priori interest due to their scientific relevance, were included as predictors.
To test whether the level of physical impairment predicts patient-reported health outcomes, multivariable models analyzed outcomes of interest (healthcare resource utilization, work productivity and activity impairment) as a function of physical impairment (reference = no physical impairment), using generalized linear models and adjusting for covariates. Covariates included all variables significantly different between the two groups plus those of a priori interest due to their scientific relevance: age, sex, BMI, HbA1c, CCI scores, years from diagnosis, diagnosed diabetes-related comorbidity, history of diagnosed cardiovascular event, hypoglycemic severity, insulin usage and treatment adherence. We also examined whether physical impairment and age would interact to predict outcomes of interest. In instances where the interaction was not a significant predictor of the outcome, the interaction term was dropped from the final model. Owing to the high frequency of zeros, absenteeism, hospitalizations and ER visits were categorized into dichotomous variables (0% worked missed vs. 1% or more work missed; no visits vs. one or more visits); therefore, binary logistic generalized linear models were used to predict these outcomes as a function of physical impairment status, controlling for covariates. The presenteeism, work impairment, activity impairment and regular outpatient visit variables were highly skewed, so generalized linear models specifying a negative binomial distribution were used, applying additional corrections to the standard errors as needed. Statistical significance was set at two-tailed p < .05. All study comparisons were a priori; therefore, post-hoc adjustments were not conducted.
Results
Demographics and characteristics of diabetic patients
Among 83,507 unique respondents to the Japan NHWS for years 2012–2014, 2859 (3.4%) respondents self-reported a physician’s diagnosis of diabetes. Of these 2859 patients, 1511 were 65 years of age or older with average PCS score of 43.25. Among these 1511 patients, 378 were classified as physically impaired (had a PCS score ≤37.08, ≤25th percentile) (). On average, respondents were 69.3 years old. A majority of these respondents were male (82.9%), married/living with a partner (86.0%) and college educated (57.2%). Approximately half of respondents reported drinking alcohol two or more times a week (51.2%). A minority were employed (30.4%), had an income ≥¥5 million (39.7%), were overweight or obese (30.0%), reported smoking (19.9%), and reported exercising vigorously for more than three times a week for 20 plus minutes in the past month (35.5%). Respondents had a mean comorbidity burden of 0.19, as measured by the CCI ().
Table 1. Sociodemographic and health characteristics as a function of physical impairment.
Variables associated with physical impairment
Bivariate analysis
Respondents reporting physical impairment were significantly more likely to be older, underweight, overweight or obese, experience non-severe hypoglycemia in the past 3 months, report an HbA1c level of 8.0% to 8.4%, use insulin, have a long duration of diabetes, diabetes-related complications and cardiovascular events, and a high CCI index (for all p < .05; ). Those reporting non-physical-impairment were more likely to be male, be married, report a higher income, be of normal weight, exercise and drink alcohol (for all p < .05; ).
Multivariable analysis
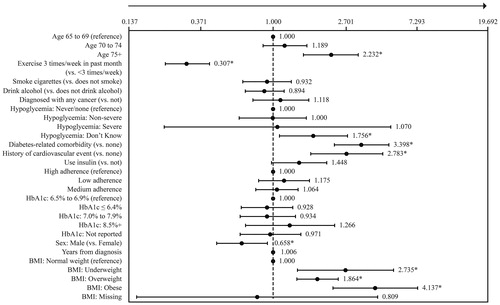
Results of the multivariable analysis predicting physical impairment indicated significantly higher adjusted odds of impairment with age, lack of regular exercise, unawareness of having hypoglycemic events in the past 3 months, diabetes-related comorbidities, cardiovascular events, female sex and BMI (). BMI, diabetes-related complications, lack of regular exercise, cardiovascular events and age were the greatest factors associated with significantly higher adjusted odds of being physically impaired. In particular, obese BMI and underweight BMI were associated with 4.1 and 2.7 times the odds of being physically impaired than those with normal BMI, respectively. In addition, the presence of diabetes-related complications, lack of regular exercise (<3 times per week in the past month), and a history of cardiovascular events were associated with 3.4, 3.3 and 2.8 times the odds of being physically impaired compared with those without diabetes-related comorbidities, who exercise regularly and without a history of cardiovascular events, respectively. Furthermore, being 75 years of age and older was associated with 2.2 times the odds of being physically impaired compared with those 65–69 years of age ().
Figure 2. Physical impairment as a function of patient characteristics. Odds ratios (ORs) and 95% confidence intervals from a binary logistic generalized linear model examining physical impairment (impaired vs. non-impaired) as a function of patient characteristics are shown. The arrow towards the higher number means that higher values indicate higher adjusted odds of physical impairment. Due to missing data for years from diagnosis for three respondents, this model was run with n = 1508 respondents (n = 378 physically impaired; n = 1130 non-physically-impaired). *p < .05 for the statistical significance of the OR. Abbreviations. CV event, Cardiovascular event; HbA1c, Hemoglobin A1c level; Yrs, Years; BMI, Body mass index. Definitions. Exercise, 20+ minutes of vigorous exercise in the past month (3+ days per week); Hypoglycemia: non-severe, Non-severe hypoglycemia: managed the episode by oneself in last three months; Hypoglycemia: severe, Severe hypoglycemia: requiring assistance from another individual in last three months; Hypoglycemia: don’t know, Don’t know if ever experienced hypoglycemia; Diagnosed diabetes-related comorbidity, Yes to foot or leg ulcer, kidney disease, macular edema or diabetic retinopathy, neuropathic pain, end organ damage; Diagnosed cardiovascular event, Yes to heart attack, stroke, peripheral vascular disease, congestive heart failure; Adherence: low, ©MMAS-8 adherent to diabetes medication score <6; Adherence: medium, ©MMAS-8 adherent to diabetes medication score between 6 and <8; Adherence: high, ©MMAS-8 adherent to diabetes medication score = 8.
Healthcare resource use as a function of physical impairment
Bivariate analysis
The physically impaired vs. non-physically-impaired group reported significantly more regular outpatient visits (14.7 visits vs. 10.1 visits) and significantly more frequently had a hospitalization (15.9% vs. 10.9%) and an ER visit (8.7% vs. 5.0%) in the past 6 months (for all p < .05; ).
Table 2. Work impairment and healthcare usage as a function of physical impairment.
Multivariable analysis
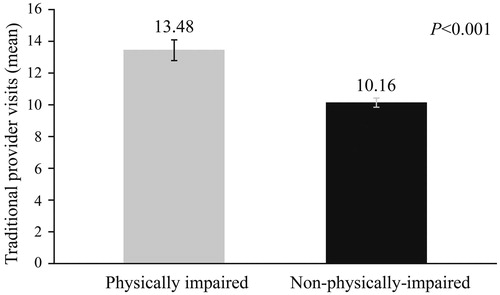
Generalized linear models indicated that physical impairment significantly predicted the number of regular outpatient visits, when controlling for covariates (age, sex, BMI, HbA1c, CCI scores, years from diagnosis, diagnosed diabetes-related comorbidity, history of diagnosed cardiovascular event, hypoglycemic severity, insulin usage and treatment adherence). Physically impaired individuals reported significantly more regular outpatient visits than non-physically-impaired ones (13.48 ± 0.64 vs.10.16 ± 0.27, p < .001) (). They had 1.3 times higher risk of regular outpatient visits than non-physically-impaired patients (Supplementary Table ST1).
Figure 3. Number of regular outpatient visits as a function of physical impairment. p < .001. Physically impaired: Mean = 13.48, SE = 0.64; n = 378. Non-physically impaired: Mean = 10.16, SE = 0.27; n = 1130. Estimated marginal means and standard errors of the number of regular outpatient visits in the past 6 months as a function of physical impairment, adjusting for covariates, are presented.
However, physical impairment was no longer a significant predictor of hospitalization or ER visits after adjusting for covariates.
Work productivity and activity impairment as a function of physical impairment
Bivariate analysis
The physically impaired group significantly more frequently reported absenteeism (25.3% vs. 5.3% had 1% or greater absenteeism) and were more likely to have presenteeism (32.2% vs.12.5%), overall work impairment (36.3% vs. 13.2%) and overall activity impairment (44.0% vs.17.3%) than the non-physically-impaired group (for all p < .05; ).
Multivariable analysis
Physical impairment was found to be a significant predictor of absenteeism, presenteeism, overall work impairment and activity impairment after adjusting for covariates (same as healthcare resource use), excluding history of cardiovascular event for analysis of absenteeism (Supplementary Table ST2).
The original model for absenteeism described above failed to converge because no individuals with a history of a cardiovascular event reported any absenteeism; therefore, history of cardiovascular event was removed as a covariate from this model. The binary logistic generalized linear model indicated that higher adjusted odds of absenteeism were associated with physical impairment, when controlling for covariates. Older T2DM patients who were physically impaired had 4.7 times the odds of absenteeism compared with those who were not physically impaired (Supplementary Table ST2).
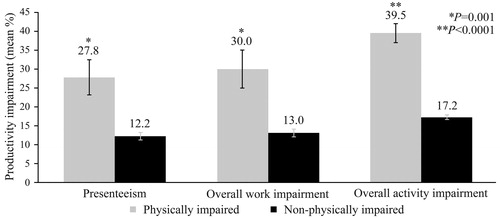
Generalized linear models indicated a higher adjusted rate of presenteeism, overall work impairment and overall activity impairment among those with physical impairment, when controlling for covariates. Older T2DM patients who were physically impaired had 2.3 times the odds of presenteeism, overall work impairment and overall activity impairment compared with those who were not physically impaired (Supplementary Table ST2). Estimated marginal means for absenteeism (16.7% ± 4.5 vs. 4.1% ± 1.1, p = .005), presenteeism (27.8% ± 4.6 vs. 12.2% ± 1.0, p = .001), overall work impairment (30.0% ± 5.1 vs. 13.0% ± 1.1, p = .001) and overall activity impairment (39.5% ± 2.5 vs. 17.2% ± 0.6, p < .001) as a function of physical impairment are shown in and .
Figure 4. Absenteeism as a function of physical impairment. p = .005. Physically impaired: Mean = 16.7%, SE = 4.5%; n = 95. Non-physically-impaired: Mean = 4.1%, SE = 1.1%; n = 336. Estimated marginal means and standard errors of the percentage of respondents with absenteeism (1%+ vs. 0%) as a function of physical impairment, adjusting for covariates, are presented.
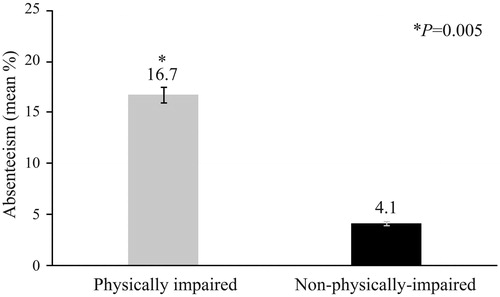
Figure 5. Productivity impairment as a function of physical impairment. Presenteeism. p = .001. Physically impaired: Mean = 27.8%, SE = 4.6%; n = 97. Non-physically-impaired: Mean = 12.2%, SE = 1.0%; n = 340. Overall work impairment. p = .001. Physically impaired: Mean = 30.0%, SE = 5.1%; n = 95. Non-physically-impaired: Mean = 13.0%, SE = 1.1%; n = 336. Overall activity impairment. p < .001. Physically impaired: Mean = 39.5%, SE = 2.5%; n = 378. Non-physically-impaired: Mean = 17.2%, SE = 0.6%; n = 1130. Estimated marginal means and standard errors of the percentage of respondents with presenteeism, overall work impairment and overall activity impairment (0%–100%) as a function of physical impairment, adjusting for covariates, are presented.
Discussion
The present study provided evidence regarding the predictors of physical impairment in Japanese older patients with T2DM. BMI, diabetes-related comorbidities, lack of regular exercise, cardiovascular events and age were the main predictors associated with physical impairment. The physically impaired group reported significantly more regular outpatient visits, greater absenteeism, increased presenteeism, increased overall work impairment and increased activity impairment compared with the non-physically-impaired group. This study is the first to report the potential impact of physical impairment on patient-reported health-related outcomes in Japanese older patients with T2DM.
In the current study, respondents were classified as physically impaired if they had a PCS score ≤37.08 (≤25th percentile). This cutoff score is consistent with low PCS scores (39.5, 42.56) of SF-36 in Taiwanese cross-sectional studies that demonstrated that the presence of frailty (determined by the CHS criteria) was associated with reduced HRQoL in the older populationCitation30,Citation31, and is below the average PCS score found among samples of pre-frail individuals in Mexico (42.6) and China (39.8)Citation18,Citation21. In this study, the average PCS of overall older patients with T2DM was 43.25, which is relatively lower than that of Fujiwara-kyo study, 46.0Citation26.
The present study showed that age, BMI, diabetes-related complications, history of cardiovascular events and lack of exercise were significantly associated with physical impairment in older patients with T2DM. These findings are consistent with previous research linking physical impairment with diabetes-related complications, higher BMI, smoking, abstinence from alcohol, lack of regular exercise, risk of hypoglycemia, insulin usage, obesity, older age, female sex, lower income and lower formal educationCitation7,Citation32–34. The biphasic distribution of BMI (J curve) indicated that both low and high body weight observed in our study were linked to physical impairment, which is consistent with previous research that showed a significant association between lower or higher BMI and incident frailty defined by the CHS criteriaCitation35. We could not investigate more detailed patient characteristics comparing the groups with lower and higher BMI in patients with T2DM, due to the small numbers of patients who were underweight. Further studies are required to examine the association of patient characteristics with low and high BMI in physically impaired patients with T2DM.
The presence of diabetes-related complications was associated with poorer HRQoL when measured using the EQ-5D scale in JapanCitation36 and other countriesCitation37, which is consistent with our study using SF-36.
Physical function is a predictive factor of poorer health outcomesCitation23. In the present study, when controlling for covariates, physical impairment was significantly associated with more regular outpatient visits, absenteeism, presenteeism, overall work impairment and activity impairment. However, physical impairment was not a significant predictor of hospitalizations or ER visits, when controlling for covariates. That may be due to the frequent and routine healthcare utilization among the physically impaired group, which may have reduced the risk of emergent conditions requiring ER visits and/or hospitalization in the Japanese setting. In contrast, frailty predicted a greater number of hospitalizations in an exploratory study involving Chinese older patients with T2DM and an observational study among US older diabetic patientsCitation38. While the former study assessed frailty as a risk factor for hospitalizationCitation23, the latter assessed sarcopenia along with frailty as predictors of hospitalizationCitation38.
The present study also showed higher levels of absenteeism, presenteeism, overall work impairment and activity impairment, after adjusting for covariates, in physically impaired older T2DM patients. These findings are in line with another study that found loss of work productivity in a quarter of patients with T2DM (mean age = 55.08) and 1.5 times use of sick leave in patients with T2DM compared with patients with hypertensionCitation39. Other studies have shown loss of work productivity is greater in patients with T2DM who experience diabetic neuropathy compared to patients with T2DM who do not experience diabetic neuropathyCitation40 and that non-severe hypoglycemia is associated with lost work productivityCitation41. However, this is the first study to report the influence of physical impairment or frailty on work productivity and activity impairment even in older T2DM patients after adjusting for severe hypoglycemia and painful neuropathy. Future research is needed to understand the drivers of loss of productivity among patients with physical impairment.
The present research has some notable strengths. Although the physical function scale of SF-36 was previously used as a criterion to reflect the mobility–disability dimension of frailty in older menCitation15, this study is the first to evaluate physical impairment as a component of frailty by means of PCS in Japanese patients with T2DM using a broad range of sociodemographic and health characteristics. In addition, the current study provides a novel, unified examination of the potential impact of physical impairment on patient-reported health outcomes.
However, it is important to note a few limitations of the present study. Causal conclusions could not be established due to the cross-sectional study design. Study responses were self-reported, thereby increasing the chances of response bias and errors in recall. Also, due to the self-reported nature of the study, patient responses regarding diagnosis and treatment could not be verified. Furthermore, as very frail older patients are less likely to complete the survey, this study may selectively under-represent the older T2DM population who had cognitive impairment or limited access to the internet. Finally, the proportion of individuals with T2DM in our sample does not mirror the proportion of T2DM patients in Japan, which decreases the generalizability of the current findings to the entire T2DM patient population.
Conclusions
In conclusion, physical impairment, a core component of frailty, is significantly associated with age, being female, low and high BMI, diabetes-related complications, cardiovascular events, and lack of regular exercise. Also, Japanese older patients with T2DM who have physical impairment are more likely to experience more economic burden, such as frequent regular outpatient visits, reduced work productivity and greater activity impairment. Therefore, in the management of older patients with diabetes, comprehensive geriatric assessment including physical dysfunction and multidisciplinary intervention are necessary to maintain better HRQoL. In the randomized trials of older patients with T2DM, physical assessment as well as HRQoL should be included as an outcome.
Transparency
Declaration of funding
This study was funded by Eli Lilly Japan KK. Kantar Health received funding from Eli Lilly Japan KK to conduct the analysis.
Declaration of financial/other relationships
A.A. has disclosed that he has received lecture fees from Eli Lilly Japan KK, MSD KK, Mitsubishi Tanabe Pharma Corporation, Kyowa Hakko Kirin Co. Ltd, Nippon Boehringer Ingelheim Co. Ltd, Kissei Pharmaceutical Co. Ltd, Sumitomo Dainippon Pharma Co. Ltd and Takeda Pharmaceutical Co. Ltd. H.U. has disclosed that he has received lecture fees from Daiichi Sankyo Co. Ltd and Sumitomo Dainippon Pharma Co. Ltd. T.S. has disclosed that he has received lecture fees from AstraZeneca KK, Daiichi Sankyo Co. Ltd and Eli Lilly Japan KK; and laboratory funds as a donation from Daiichi Sankyo Co. Ltd, Kracie Pharma Ltd and Takeda Pharmaceutical Co. Ltd. M.M. has disclosed that she has received lecture fees from Tsumura & Co. K.Yokote has disclosed that he received lecture fees from Amgen Astellas BioPharma KK, Astellas Pharma Inc., AstraZeneca KK, Daiichi Sankyo Co. Ltd, Eli Lilly Japan KK, Pfizer Japan Inc., Kowa Company Ltd, Kowa Pharmaceutical Co. Ltd, Mitsubishi Tanabe Pharma Corporation, Mochida Pharmaceutical Co. Ltd, MSD KK, Nippon Boehringer Ingelheim Co. Ltd, Novo Nordisk Pharma Ltd, Ono Pharmaceutical Co. Ltd, Sanofi KK, Sanwa Kagaku Corp, Shionogi & Co. Ltd, Sumitomo Dainippon Pharma Co. Ltd, Taisho Toyama Pharmaceutical Co. Ltd and Takeda Pharmaceutical Co. Ltd; funds for contracted or collaborative research from Astellas Pharma Inc.; and laboratory funds as a donation from Astellas Pharma Inc., AstraZeneca KK, Daiichi Sankyo Co. Ltd, Eli Lilly Japan KK, Pfizer Japan Inc., Kyowa Hakko Kirin Co. Ltd, Mitsubishi Tanabe Pharma Corporation, Mochida Pharmaceutical Co. Ltd, MSD KK, Nippon Boehringer Ingelheim Co. Ltd, Ono Pharmaceutical Co. Ltd, Sanofi KK, Shionogi & Co. Ltd, Sumitomo Dainippon Pharma Co. Ltd, Taisho Toyama Pharmaceutical Co. Ltd, Takeda Pharmaceutical Co. Ltd, Teijin Pharma Limited and Terumo Corporation. K.Yokono has disclosed that he has received lecture fees from Astellas Pharma Inc., Eli Lilly Japan KK, Nippon Boehringer Ingelheim Co. Ltd, Ono Pharmaceutical Co. Ltd, Sanofi KK and Takeda Pharmaceutical Co. Ltd. M.I. has disclosed that he is an employee of Eli Lilly Japan KK and a stockholder of Eli Lilly and Company. S.S. has disclosed that he was an employee of Eli Lilly Japan KK at the time of manuscript development and is a minor stockholder of Eli Lilly and Company. M.J.C.M. has disclosed that she is an employee of Kantar which received funding from Eli Lilly Japan KK to conduct the analysis. No potential conflict of interest was reported by Y.M. and T.O. CMRO peer reviewers on this manuscript have no relevant financial or other relationships to disclose.
Author contributions
A.A., H.U., T.S., Y.M., M.M., M.I., S.S., K. Yokote, T.O. and K. Yokono contributed to the conception of the study. All authors contributed to the design of the study. M.J.C.M. analyzed data. S.S., M.J.C.M. and A.A. wrote the draft of the manuscript. All authors contributed to data interpretation and critical review of the manuscript. All authors provided final approval of the manuscript and agreed to be accountable for all aspects of the work.
icmo_a_1846170_sm5720.docx
Download MS Word (24.4 KB)Acknowledgements
The authors acknowledge Ramu Periyasamy PhD, Indegene Pvt Ltd, Bangalore, India for his medical writing assistance and critical evaluation of the supporting literature while drafting this manuscript. The authors also acknowledge Amir Goren PhD, previously an employee at Kantar, who assisted in analysis and review of earlier versions of this manuscript. Use of the ©MMAS is protected by US copyright laws. Permission for use is required. A license agreement is available from: Donald E. Morisky, 294 Lindura Court, Las Vegas, NV 89138-4632; [email protected].
References
- International Diabetes Federation. IDF Diabetes Atlas, 9th ed. [Internet]. Brussels: Belgium; 2019 [cited 2020 Mar 26]. Available from: https://www.diabetesatlas.org
- Lin Y, Sun Z. Current views on type 2 diabetes. J Endocrinol. 2010;204(1):1–11.
- Muramatsu N, Akiyama H. Japan: Super-aging society preparing for the future. Gerontologist. 2011;51(4):425–432.
- Ministry of Internal Affairs and Communications. Statistics Topics No.72: Japan’s elderly people (65 years of age or older) from the point of view of statistics [Internet]. 2013 [cited 2018 Jan 22]. Available from: http://www.stat.go.jp/data/topics/topi720.html
- Ministry of Health Labor and Welfare. Patient survey [Internet]. 2014 [cited 2017 Nov 20]. Available from: http://www.mhlw.go.jp/toukei/list/10-20-kekka_gaiyou.html
- Sinclair AJ, Rodriguez-Mañas L. Diabetes and frailty: two converging conditions? Can J Diabetes. 2016;40(1):77–83.
- Abdelhafiz AH, Rodríguez-Mañas L, Morley JE, et al. Hypoglycemia in older people – a less well recognized risk factor for frailty. Aging Dis. 2015;6(2):156–167.
- Huang ES, Laiteerapong N, Liu JY, et al. Rates of complications and mortality in older patients with diabetes mellitus: the diabetes and aging study. JAMA Intern Med. 2014;174(2):251–258.
- Older Adults. American Diabetes Association. 11. Diabetes Care. 2017;40:S99–S104.
- Araki A, Ito H. Diabetes mellitus and geriatric syndromes. Geriatr Gerontol Int. 2009;9(2):105–114.
- Kalyani RR, Tian J, Xue Q-L, et al. Hyperglycemia and incidence of frailty and lower extremity mobility limitations in older women. J Am Geriatr Soc. 2012;60(9):1701–1707.
- Ricci NA, Pessoa GS, Ferriolli E, et al. Frailty and cardiovascular risk in community-dwelling elderly: a population-based study. Clin Interv Aging. 2014;9:1677–1685.
- Fried LP, Tangen CM, Walston J, et al. Frailty in older adults: evidence for a phenotype. J Gerontol A Biol Sci Med Sci. 2001;56(3):M146–M156.
- van Kan GA, Rolland Y, Houles M, et al. The assessment of frailty in older adults. Clin Geriatr Med. 2010;26(2):275–286.
- Sirola J, Pitkala KH, Tilvis RS, et al. Definition of frailty in older men according to questionnaire data (RAND-36/SF-36): the Helsinki Businessmen study. J Nutr Health Aging. 2011;15(9):783–787.
- Ylitalo KR, McEwen LN, Karter AJ, et al. Physical functioning and mortality among individuals with type 2 diabetes: insights from TRIAD. J Diabetes Complications. 2013;27(6):565–569.
- Cesari M, Landi F, Vellas B, et al. Sarcopenia and physical frailty: two sides of the same coin. Front. Aging Neurosci. 2014;6:192.
- Moreno-Aguilar M, García-Lara JMA, Aguilar-Navarro S, et al. The phenotype of frailty and health-related quality of life. J Frailty Aging. 2013;2:2–7.
- Henchoz Y, Büla C, Guessous I, et al. Association between physical frailty and quality of life in a representative sample of community-dwelling Swiss older people. J Nutr Health Aging. 2017;21(5):585–592.
- Mansur H, Colugnati FA, Grincenkov Fr dos S, et al. Frailty and quality of life: a cross-sectional study of Brazilian patients with pre-dialysis chronic kidney disease. Health Qual Life Outcomes. 2014;12:27.
- Xu H, Tang L, Hu Z, et al. Association between physical activity and health-related quality of life in elderly individuals with pre-diabetes in rural Hunan Province, China: a cross-sectional study. BMJ Open. 2018;8(4):e019836.
- Sakurai T, Iimuro S, Sakamaki K, et al. Risk factors for a 6-year decline in physical disability and functional limitations among elderly people with type 2 diabetes in the Japanese Elderly Diabetes Intervention Trial. Geriatr Gerontol Int. 2012;12(Suppl 1):117–126.
- Li Y, Zou Y, Wang S, et al. A pilot study of the FRAIL scale on predicting outcomes in Chinese elderly people with type 2 diabetes. J Am Med Dir Assoc. 2015;16(8):714.e7–714.e12.
- Sadosky A, DiBonaventura M, Cappelleri JC, et al. The association between lower back pain and health status, work productivity, and health care resource use in Japan. J. Pain Res. 2015;8:119.
- Suzukamo Y, Fukuhara S, Green J, et al. Validation testing of a three-component model of Short Form-36 scores. J Clin Epidemiol. 2011;64(3):301–308.
- Nezu S, Okamoto N, Morikawa M, et al. Health-related quality of life (HRQOL) decreases independently of chronic conditions and geriatric syndromes in older adults with diabetes: the Fujiwara-kyo Study. J Epidemiol. 2014;24(4):259–266.
- Quan H, Li B, Couris C, et al. Updating and validating the Charlson comorbidity index and score for risk adjustment in hospital discharge abstracts using data from 6 countries. Am J Epidemiol. 2011;173(6):676–682.
- Morisky DE, Ang A, Krousel-Wood M, et al. Predictive validity of a medication adherence measure for hypertension control. J Clin Hypertension. 2008;10(5):348–354.
- Reilly MC, Zbrozek AS, Dukes EM. The validity and reproducibility of a work productivity and activity impairment instrument. Pharmacoeconomics. 1993;4(5):353–365.
- Lin C-C, Li C-I, Chang C-K, et al. Reduced health-related quality of life in elders with frailty: a cross-sectional study of community-dwelling elders in Taiwan. PLoS One. 2011;6(7):e21841.
- Chang Y-W, Chen W-L, Lin F-G, et al. Frailty and its impact on health-related quality of life: a cross-sectional study on elder community-dwelling preventive health service users. PLoS One. 2012;7(5):e38079.
- Caruso LB, Silliman RA, Demissie S, et al. What can we do to improve physical function in older persons with type 2 diabetes? J Gerontol A Biol Sci Med Sci. 2000;55(7):M372–M377.
- Bourdel-Marchasson I, Druet C, Helmer C, et al. Correlates of health-related quality of life in French people with type 2 diabetes. Diabetes Res Clin Pract. 2013;101(2):226–235.
- Maatouk I, Wild B, Wesche D, et al. Temporal predictors of health-related quality of life in elderly people with diabetes: results of a German cohort study. PLoS One. 2012;7(1):e31088.
- Woods NF, LaCroix AZ, Gray SL, et al. Frailty: emergence and consequences in women aged 65 and older in the women’s health initiative observational study. J Am Geriatr Soc. 2005;53(8):1321–1330.
- Sakamaki H, Ikeda S, Ikegami N, et al. Measurement of HRQL using EQ-5D in patients with type 2 diabetes mellitus in Japan. Value Health. 2006;9(1):47–53.
- Beaudet A, Clegg J, Thuresson P-O, et al. Review of utility values for economic modeling in type 2 diabetes. Value Health. 2014;17(4):462–470.
- Liccini AP, Malmstrom TK. Frailty and sarcopenia as predictors of adverse health outcomes in persons with diabetes mellitus. J Am Med Dir Assoc. 2016;17(9):846–851.
- Krstović-Spremo V, Račić M, Joksimović BN, et al. The effects of diabetes mellitus and hypertension on work productivity. Acta Med Acad. 2014;43(2):122–133.
- Stewart WF, Ricci JA, Chee E, et al. Lost productive time and costs due to diabetes and diabetic neuropathic pain in the US workforce. J Occup Environ Med. 2007;49:672–679.
- Brod M, Christensen T, Thomsen TL, et al. The impact of non-severe hypoglycemic events on work productivity and diabetes management. Value Health. 2011;14(5):665–671.