
Article title: Matching-adjusted indirect comparison of efficacy outcomes for ciltacabtagene autoleucel in CARTITUDE-1 versus idecabtagene vicleucel in KarMMa for the treatment of patients with relapsed or refractory multiple myeloma
Authors: Tom Martin, Saad Z. Usmani, Jordan M. Schecter, Martin Vogel, Carolyn C. Jackson, William Deraedt, Hong Tian, Tzu-min Yeh, Arnob Banerjee, Lida Pacaud, Ashraf Garrett, Anja Haltner, Chris Cameron, Suzy Van Sanden, Joris Diels, Satish Valluri and Imtiaz A. Samjoo
Journal: Current Medical Research and Opinion
Bibliometrics: Volume 37, Number 10, pages 1779–1788
DOI: https://doi.org/10.1080/03007995.2021.1953456
The baseline characteristic “presence of all plasmacytomas” (reported in ) was incorrectly calculated for KarMMa. The current value, 32% (reported in ), should be correctly reported as 40%. “Presence of all plasmacytomas” was one of the four factors included in the base case analysis. Given the error affected the base case analysis, it propagated throughout the manuscript, impacting the values reported in text, tables, figures, and supplemental material. The correction did not appreciably impact any of the reported point estimates and the statistical significance of all base case results was unchanged. However, the correction did have an impact on the DoR sensitivity analysis (all variables adjusted comparison), in which the results shifted from a significant finding to a non-significant finding. Overall, the findings of the manuscript remain valid and robust, and the overall conclusions of the manuscript remain unchanged.
Table 1. Differences in Baseline Characteristics
Table 1. Differences in Baseline Characteristics
The correction is outlined below:
Page 1, Abstract, Paragraph 3 (Results), Lines 1–6:
Original text: Cilta-cel was associated with statistically significantly improved ORR (odds ratio [OR]: 87.99 [95% confidence interval [CI]: 20.32, 381.01; p<.0001]; relative risk [RR]: 1.34), ≥CR rate (OR: 5.96 [95% CI: 2.76, 12.88; p<.0001]; RR: 2.26), DoR (hazard ratio [HR]: 0.48 [95% CI: 0.28, 0.81; p=.0058]), and PFS (HR: 0.36 [95% CI: 0.22, 0.59; p<.0001]) when compared with ide-cel. For OS, the results were in favor of cilta-cel and clinically meaningful but with a CI overlapping one (HR: 0.54 [95% CI: 0.29, 1.01; p=.0527]).
Revised text: Cilta-cel was associated with statistically significantly improved ORR (odds ratio [OR]: 94.93 [95% confidence interval [CI]: 21.86, 412.25; p<.0001]; relative risk [RR]: 1.34), ≥CR rate (OR: 5.49 [95% CI: 2.47, 12.21; p<.0001]; RR: 2.21), DoR (hazard ratio [HR]: 0.50 [95% CI: 0.29, 0.87; p=.0137]), and PFS (HR: 0.37 [95% CI: 0.22, 0.62; p=.0002]) when compared with ide-cel. For OS, the results were in favor of cilta-cel and clinically meaningful but with a CI overlapping one (HR: 0.55 [95% CI: 0.29, 1.05; p=.0702]).
Page 3, Paragraph 7 (Results, Population alignment), Lines 20–27:
Original text: In the comparison that adjusted for the base case variables, the means of the adjusted covariates aligned exactly across the two populations, accompanied by a 39% reduction in ESS for the cilta-cel treated population. Furthermore, the sensitivity analysis which adjusted for all variables improved the overall population alignment compared to the base case; however, it reduced the ESS by 50% for the cilta-cel treated population.
Revised text: In the comparison that adjusted for the base case variables, the means of the adjusted covariates aligned exactly across the two populations, accompanied by a 46% reduction in ESS for the cilta-cel treated population. Furthermore, the sensitivity analysis which adjusted for all variables improved the overall population alignment compared to the base case; however, it reduced the ESS by 57% for the cilta-cel treated population.
Page 3, Paragraph 9 (Results, Overall response and ≥ complete response rate), Lines 4–8:
Original text: After base case adjustment, patients treated with cilta-cel were 1.3-fold more likely to respond (OR: 87.99 [95% CI: 20.32, 381.01; p<.0001]; RR: 1.34) and 2.3-fold more likely to achieve ≥ CR (OR: 5.96 [95% CI: 2.76, 12.88; p<.0001]; RR: 2.26) compared to patients treated with ide-cel.
Revised text: After base case adjustment, patients treated with cilta-cel were 1.3-fold more likely to respond (OR: 94.93 [95% CI: 21.86, 412.25; p<.0001]; RR: 1.34) and 2.2-fold more likely to achieve ≥ CR (OR: 5.49 [95% CI: 2.47, 12.21; p<.0001]; RR: 2.21) compared to patients treated with ide-cel.
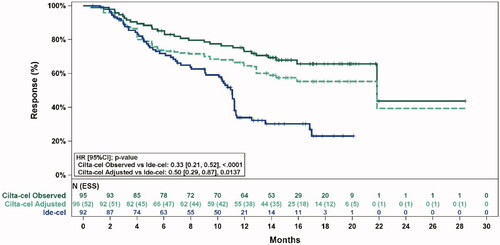
Page 4, Paragraph 2 (Results, Duration of response), Lines 2–5:
Original text: The effect of cilta-cel was statistically significantly superior to ide-cel after base case adjustment (HR: 0.48 [95% CI: 0.28, 0.81; p=.0058]).
Revised text: The effect of cilta-cel was statistically significantly superior to ide-cel after base case adjustment (HR: 0.50 [95% CI: 0.29, 0.87); p=.0137]).
Page 4, Paragraph 3 (Results, Duration of response), Lines 1–4:
Original text: The Grambsch-Therneau test [1] for violation of the proportional hazards assumption was non-significant for the base case adjusted analysis (p=.11), indicating that the proportional hazards assumption was not violated.
Revised text: The Grambsch-Therneau test [1] for violation of the proportional hazards assumption was non-significant for the base case adjusted analysis (p=.12), indicating that the proportional hazards assumption was not violated.
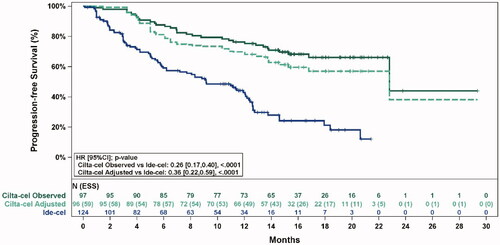
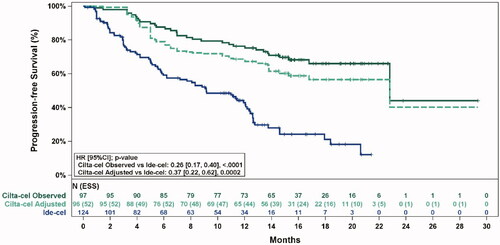
Page 4, Paragraph 5 (Results, Progression-free survival and overall survival), Lines 3–8:
Original text: The effect of cilta-cel for PFS was statistically significantly superior to ide-cel after base case adjustment (HR: 0.36 [95% CI: 0.22, 0.59; p<.0001]). For OS, the estimated treatment effect was in favor of cilta-cel (HR: 0.54 [95% CI: 0.29, 1.01; p=.0527]), but with widened CIs overlapping one.
Revised text: The effect of cilta-cel for PFS was statistically significantly superior to ide-cel after base case adjustment (HR: 0.37 [95% CI: 0.22, 0.62; p=.0002]). For OS, the estimated treatment effect was in favor of cilta-cel (HR: 0.55 [95% CI: 0.29, 1.05; p=.0702]), but with widened CIs overlapping one.
Page 4, Paragraph 6 (Results, Progression-free survival and overall survival), Lines 1–5:
Original text: The Grambsch-Therneau test [1] for violation of the proportional hazards assumption was non-significant for both outcomes in the base case adjusted analysis (PFS: p=.60; OS: p=.17), indicating that the proportional hazard assumption was not violated.
Revised text: The Grambsch-Therneau test [1] for violation of the proportional hazards assumption was non-significant for both outcomes in the base case adjusted analysis (PFS: p=.62; OS: p=.19), indicating that the proportional hazard assumption was not violated.
Page 5, Paragraph 1 (Results, Sensitivity analyses), Lines 5–10:
Original text: Comparative efficacy estimates for the all variables adjusted comparison were as follows: ORR: OR = 66.10 (95% CI: 11.72, 372.92; p<.0001); RR = 1.34; ≥CR rate: OR = 4.65 (95% CI: 2.12, 10.18; p=.0001); RR = 2.11; DoR: HR = 0.55 (95% CI: 0.32, 0.93; p=.0262); PFS: HR = 0.41 (95% CI: 0.25, 0.67; p=.0004); and OS: HR = 0.59 (95% CI: 0.30, 1.14; p=.1162).
Revised text: Comparative efficacy estimates for the all variables adjusted comparison were as follows: ORR: OR = 70.53 (95% CI: 12.23, 406.82; p<.0001); RR = 1.34; ≥CR rate: OR = 4.18 (95% CI: 1.86, 9.43; p=.0006); RR = 2.04; DoR: HR = 0.58 (95% CI: 0.33, 1.02; p=.0600); PFS: HR = 0.43 (95% CI: 0.25, 0.73; p=.0016); and OS: HR = 0.62 (95% CI: 0.31, 1.23; p=.1680). For DoR, the results were in favor of cilta-cel but with a CI overlapping one.
Page 5, Paragraph 3 (Discussion), Lines 16–21:
Original text: Patients treated with cilta-cel were 1.3-fold more likely to respond and 2.3-fold more likely to achieve a ≥ CR when compared with ide-cel, demonstrating a higher likelihood of a deeper response with cilta-cel. Furthermore, cilta-cel reduced the risk of disease progression or death by approximately 52% in responders and 64% in all patients.
Revised text: Patients treated with cilta-cel were 1.3-fold more likely to respond and 2.2-fold more likely to achieve a ≥ CR when compared with ide-cel, demonstrating a higher likelihood of a deeper response with cilta-cel. Furthermore, cilta-cel reduced the risk of disease progression or death by approximately 50% in responders and 63% in all patients.
Page 6, Paragraph 1 (Discussion), Lines 1–4:
Original text: analyses adjusting for additional prognostic factors showed consistent statistically significant estimates for ORR, ≥CR rate, DoR, and PFS in favor of cilta-cel, showing robustnessof findings from the base case analysis.
Revised text: analyses adjusting for additional prognostic factors showed consistent statistically significant estimates for ORR, ≥CR rate, and PFS in favor of cilta-cel, showing robustnessof findings from the base case analysis. For the sensitivity analysis with DoR, the results were in favor of cilta-cel and clinically meaningful but with a CI overlapping one.
Page 6, Paragraph 2 (Discussion), Lines 4–7:
Original text: In the base case adjusted comparison, cilta-cel showed a reduction in the risk of death by approximately 46% compared to ide-cel; however, a limited number of events resulted in low power for the OS outcome.
Revised text: In the base case adjusted comparison, cilta-cel showed a reduction in the risk of death by approximately 45% compared to ide-cel; however, a limited number of events resulted in low power for the OS outcome.
Page 8, Paragraph 2 (Conclusion), Lines 1–3:
Original text: Cilta-cel demonstrated clinically superior results for all outcomes studied (ORR, ≥CR rate, DoR, PFS, and OS), and these were robust across all sensitivity analyses.
Revised text: Cilta-cel demonstrated clinically superior results for all outcomes studied (ORR, ≥CR rate, DoR, PFS, and OS), and these were robust across sensitivity analyses.
Page 4, :
Original table:
Revised table:
Page 5, :
Table 2. Response Rates and Comparative Efficacy for Cilta-cel versus Ide-cel
Table 2. Response Rates and Comparative Efficacy for Cilta-cel versus Ide-cel
Original table:
Revised table:
Page 6, :
Table 3. Estimated Medians and Comparative Efficacy for Cilta-cel versus Ide-cel
Table 3. Estimated Medians and Comparative Efficacy for Cilta-cel versus Ide-cel
Original table:
Revised table:
Page 7, :
Figure 1. Observed (unadjusted) and adjusted (base case) Kaplan–Meier plots of a duration of response. Note. Base case results adjusted for refractory status, cytogenetic profile, revised International Staging System stage, and all plasmacytomas. Abbreviations: ESS, effective sample size.
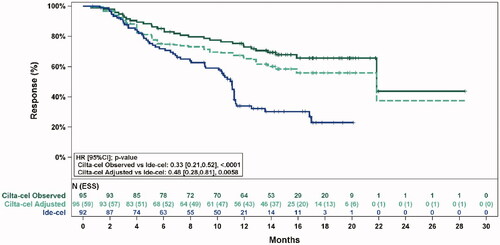
Figure 1. Observed (unadjusted) and adjusted (base case) Kaplan–Meier plots of a duration of response. Note. Base case results adjusted for refractory status, cytogenetic profile, revised International Staging System stage, and all plasmacytomas. Abbreviations: ESS, effective sample size.
Original figure:
Revised figure:
Page 7, :
Original figure:
Figure 2. Observed (unadjusted) and adjusted (base case) Kaplan–Meier plots of progression-free survival. Note. Base case results adjusted for refractory status, cytogenetic profile, revised International Staging System stage, and all plasmacytomas. Abbreviations: ESS, effective sample size.
Revised figure:
Figure 2. Observed (unadjusted) and adjusted (base case) Kaplan–Meier plots of progression-free survival. Note. Base case results adjusted for refractory status, cytogenetic profile, revised International Staging System stage, and all plasmacytomas. Abbreviations: ESS, effective sample size.
Page 8, :
Original figure:
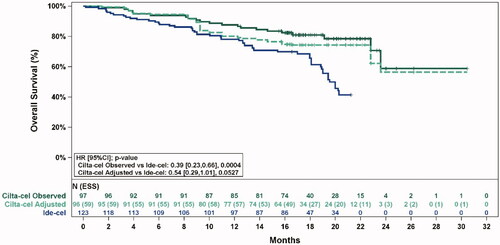
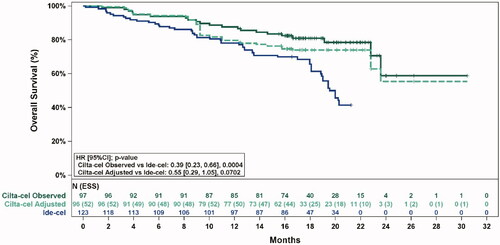
Figure 3. Observed (unadjusted) and adjusted (base case) Kaplan–Meier plots of overall survival. Note. Base case results adjusted for refractory status, cytogenetic profile, revised International Staging System stage, and all plasmacytomas. Abbreviations: ESS, effective sample size.
Revised figure:
Figure 3. Observed (unadjusted) and adjusted (base case) Kaplan–Meier plots of overall survival. Note. Base case results adjusted for refractory status, cytogenetic profile, revised International Staging System stage, and all plasmacytomas. Abbreviations: ESS, effective sample size.
Supplemental Appendix, Page 5, :
Original figure: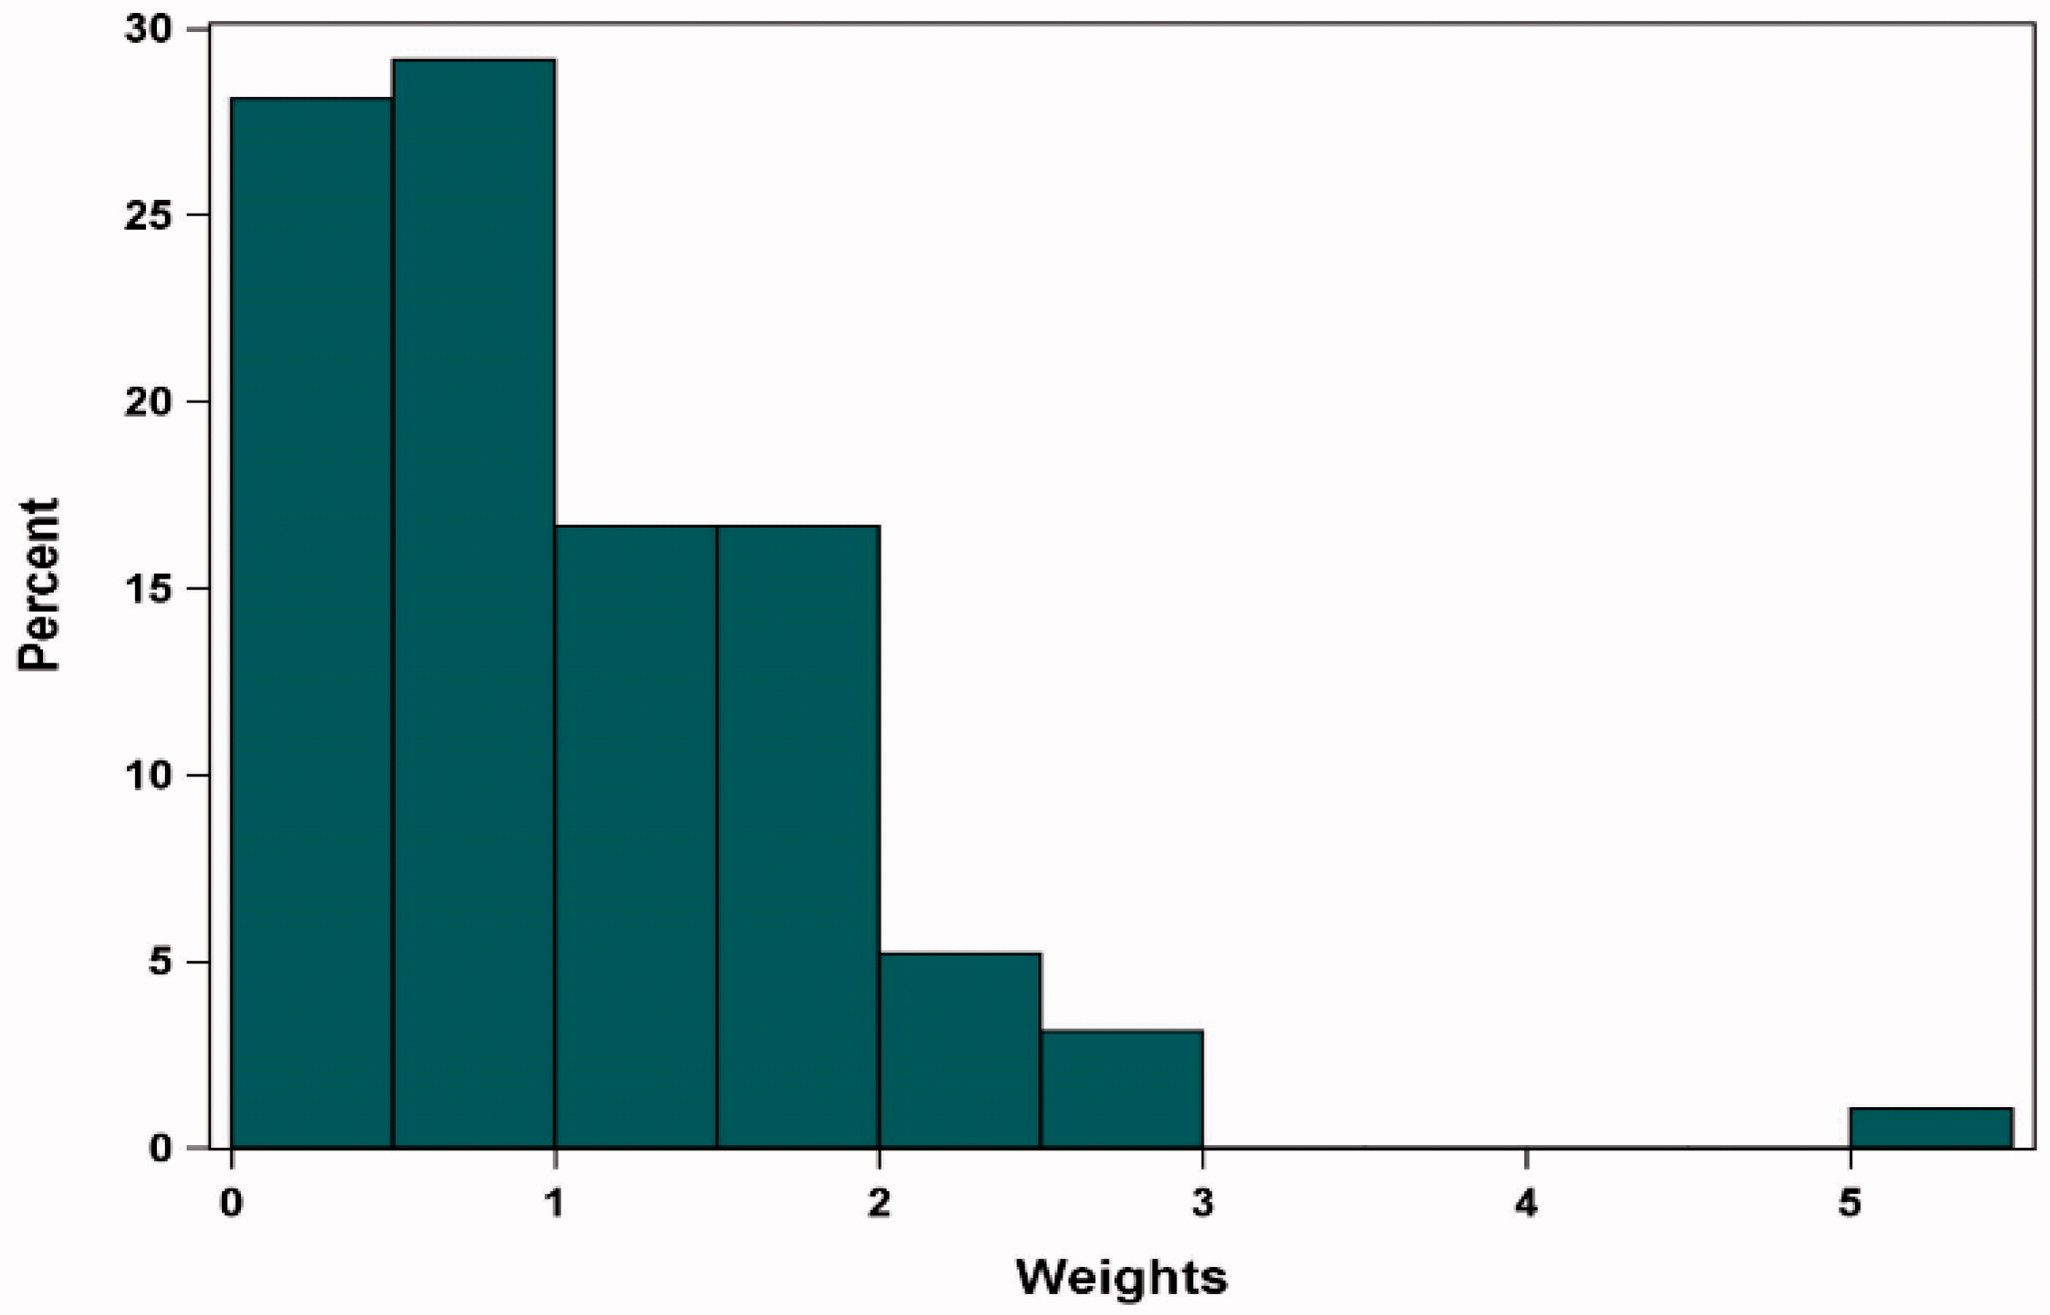
Note: Base case results adjusted for refractory status, cytogenetic profile, revised International Staging System stage, and all plasmacytomas.
Abbreviations: MAIC, matching-adjusted indirect comparison
Revised figure: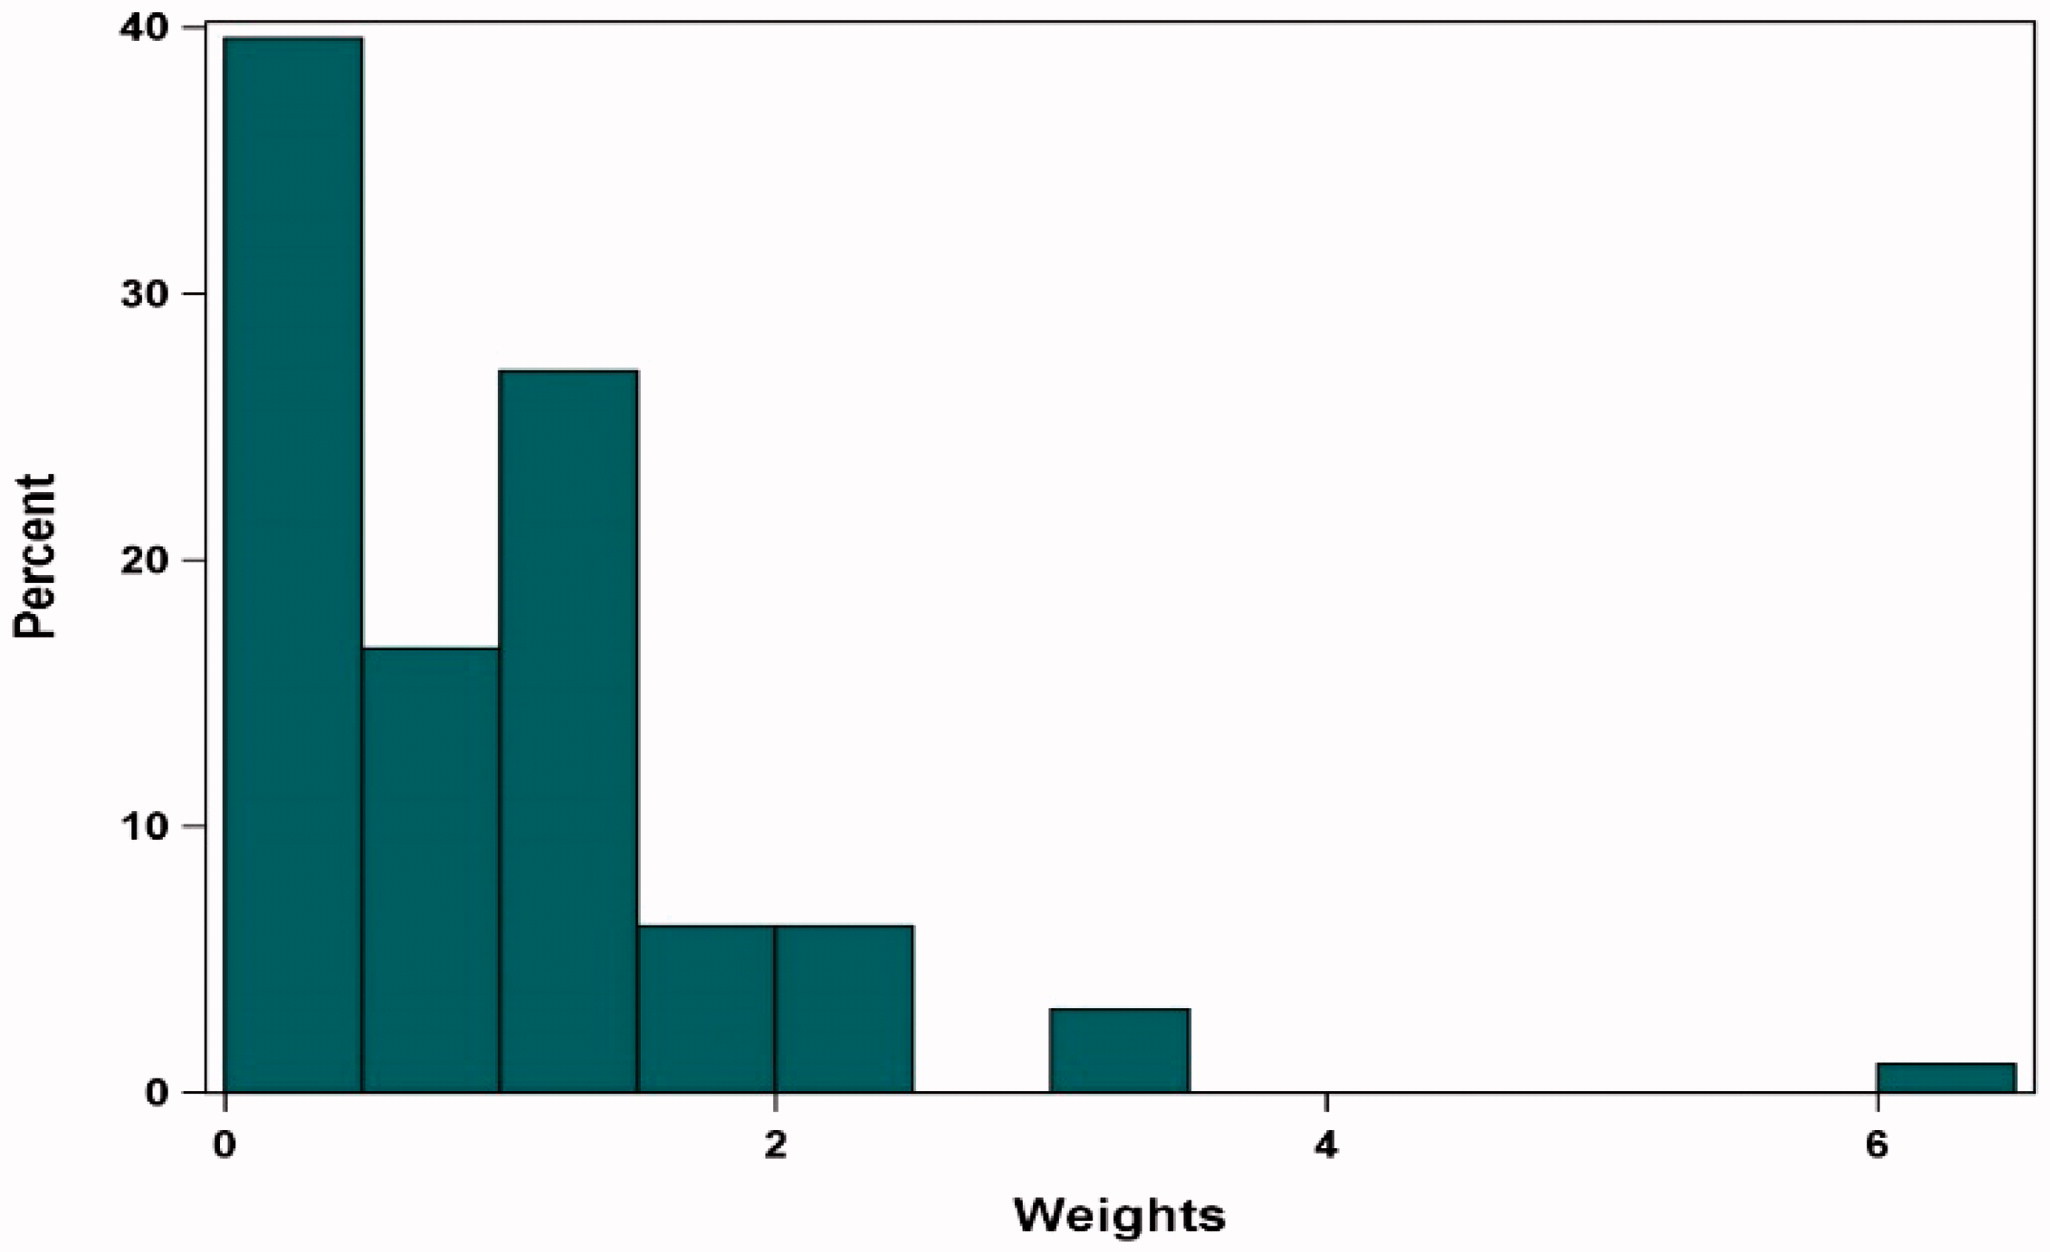
Note: Base case results adjusted for refractory status, cytogenetic profile, revised International Staging System stage, and all plasmacytomas.
Abbreviations: MAIC, matching-adjusted indirect comparison
Supplemental Appendix, Page 6, :
Original figure: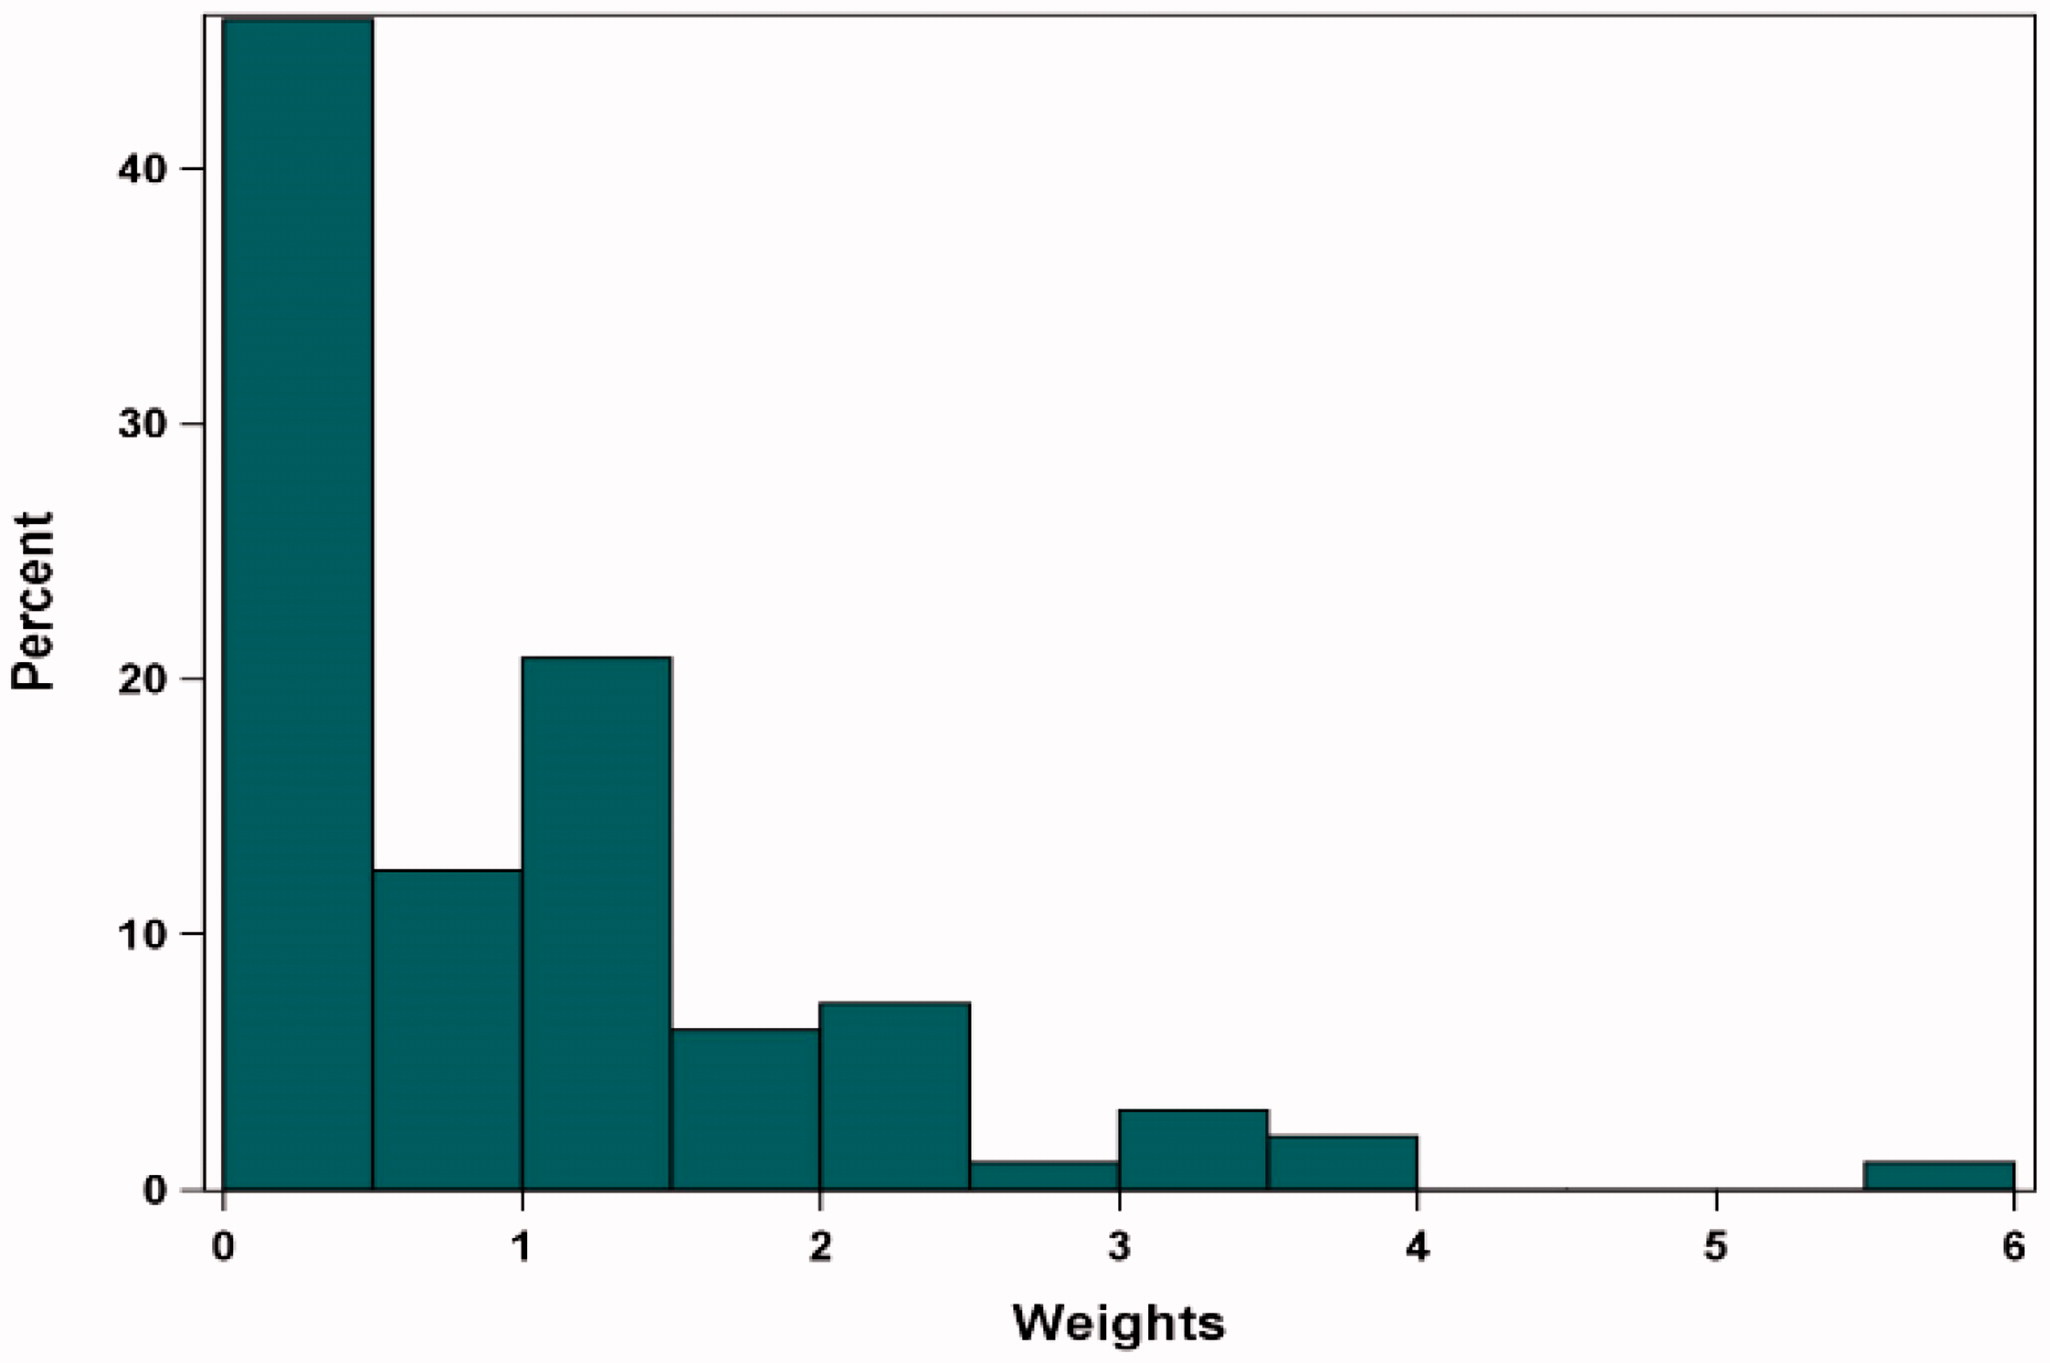
Note: Sensitivity Analysis results adjusted for refractory status, cytogenetic profile, revised International Staging System stage, all plasmacytomas, number of prior lines of therapy, years since multiple myeloma diagnosis, age, prior stem cell transplant, Eastern Cooperative Oncology Group status, and sex.
Abbreviations: MAIC, matching-adjusted indirect comparison
Revised figure: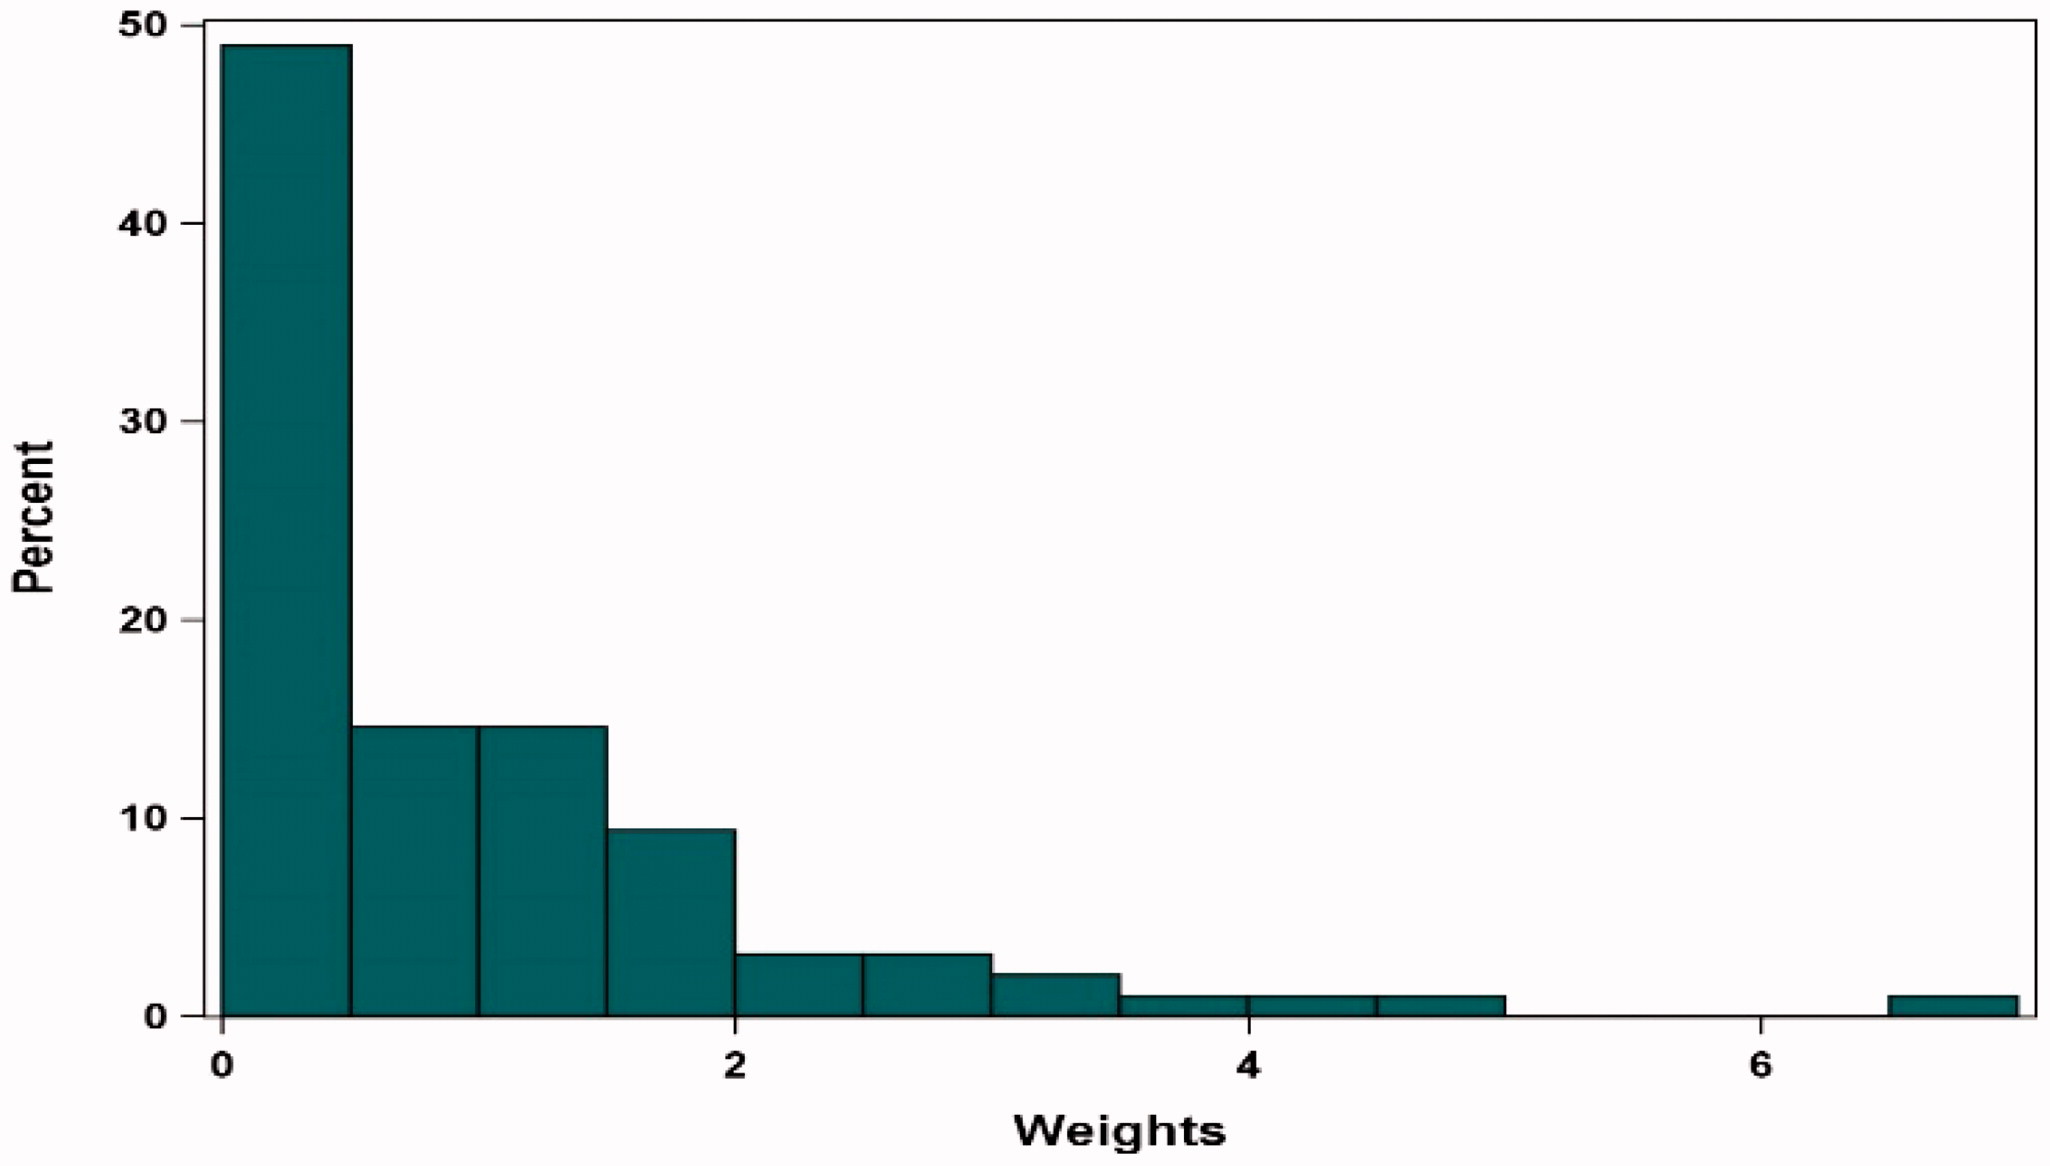
Note: Sensitivity Analysis results adjusted for refractory status, cytogenetic profile, revised International Staging System stage, all plasmacytomas, number of prior lines of therapy, years since multiple myeloma diagnosis, age, prior stem cell transplant, Eastern Cooperative Oncology Group status, and sex.
Abbreviations: MAIC, matching-adjusted indirect comparison
Supplemental Appendix, Page 7, :
Table E.1: Detailed Sensitivity Analysis Results for Overall Response Rate, Complete Response or Better Rate, Duration of Response, Progression-free Survival, and Overall Survival
Table E.1: Detailed Sensitivity Analysis Results for Overall Response Rate, Complete Response or Better Rate, Duration of Response, Progression-free Survival, and Overall Survival
Original table:
Revised table:
References cited in this correction
1. Grambsch PM, Therneau TM. Proportional hazards tests and diagnostics based on weighted residuals. Biometrika. 1994;81(3):515–526.
2. Munshi NC, Anderson LD, Shah N, et al. Idecabtagene vicleucel in relapsed and refractory multiple myeloma. N Engl J Med. 2021;384(8):705–716.