
Abstract
Objective
The SPUR (Social, Psychological, Usage, and Rational) Adherence Profiling Tool is a recently developed adaptive instrument for measuring key patient-level risk factors for adherence problems. This study describes the SPUR questionnaire’s psychometric refinement and evaluation.
Methods
Data were collected through an online survey among individuals with type 2 diabetes in the United States. 501 participants completed multiple questionnaires, including SPUR and several validated adherence measures. A Partial Credit Model (PCM) analysis was performed to evaluate the structure of the SPUR tool and verify the assumption of a single underlying latent variable reflecting adherence. Partial least-squares discriminant analyses (PLS-DA) were conducted to identify which hierarchically-defined items within each dimension needed to be answered by a given patient. Lastly, correlations were calculated between the latent trait of SPUR adherence and other patient-reported adherence measures.
Results
Of the 45 candidate SPUR items, 39 proved to fit well to the PCM confirming that SPUR responses reflected one underlying latent trait hypothesized as non-adherence. Correlations between the latent trait of the SPUR tool and other adherence measures were positive, statistically significant, and ranged from 0.32 to 0.48 (p-values < .0001). The person-item map showed that the items reflected well the range of adherence behaviors from perfect adherence to high levels of non-adherence. The PLS-DA results confirmed the relevance of using four meta-items as filters to open or close subsequent items from their corresponding SPUR dimensions.
Conclusions
The SPUR tool represents a promising new adaptive instrument for measuring adherence accurately and efficiently using the digital behavioral diagnostic tool.
Introduction
Non-adherence to treatment for chronic disease is common and a major driver of poor disease outcomesCitation1. Several questionnaires have been developed to assess non-adherence, including the widely-used 4- or 8-item Morisky Medication Adherence Scales (MMAS-4 or MMAS-8)Citation2, the Medication Adherence Report Scale (MARS)Citation3, the Beliefs About Medication Questionnaire (BMQ)Citation4 and the Adherence Starts with Knowledge (ASK) questionnaireCitation5. However, these tools provide little information about the drivers of non-adherence, and none of them allow for adaptive or hierarchical administration in order for more efficient administration via digital tools.
The SPUR (Social, Psychological, Usage, and Rational) adherence profiling tool was developed using an iterative, user-centered process including patient interviews in multiple countries and relevant behavioral theories. The framework itself is based on a categorization of previously studied drivers of non-adherence for patients with chronic diseaseCitation6. SPUR categorizes drivers for adherence to chronic treatments into four broad dimensions: Social which includes both the impact on adherence of how the patient perceives the support of those close to them as well as the patient’s perceptions of how the treatment affects their place in society; Psychological which includes items measuring the respondent’s self-concept, reactance and the discounting of future benefits; Usage which corresponds to practical and control elements such as access to medication, the complexity of administration, perceived self-efficacy and other unintentional drivers of non-adherence; and Rational which focuses on perceptions of the treatment’s benefits, the seriousness of the illness, and the individual’s perceived risk for bad outcomes, including fear of side effects.
The SPUR adherence profiling tool consists of 45 items and four meta-items. The meta-items are asked first and have been developed to be used to quickly assess the risk of non-adherence and as filters to open or close subsequent items from their corresponding SPUR dimensions. An adaptive algorithm based on empirical analysis of the SPUR tool is needed to streamline the digital administration of the questionnaire in order to quickly focus on gathering detailed information within the range of adherence issues experienced by the respondent while focusing less on less relevant issues. In this way, the SPUR algorithm could be used in the growing field of Digital Adherence Technology (DAT) to provide personalized digital behavioral interventions. The questions were designed in such a way as not to be specific to any one pathology or healthcare system, in order to retain sufficient flexibility to be incorporated into DATs for a variety of situations.
The most common approach used to develop and validate an instrument like SPUR is Classical Test Theory (CTT)Citation7,Citation8. However, while CTT can provide unbiased estimates of the target construct, random measurement error can make those estimates unreliable in practice. Rasch-family models can improve the precision of scale scores while minimizing the number of itemsCitation9. While sharing the fundamental assumptions of Item Response Theory, Rasch-family models have specific psychometric propertiesCitation10, such as “specific objectivity,” which allows consistent estimation of the parameters associated with the latent trait independently from the items used for these estimations. Indeed, even if some patients do not respond to all items, estimates of the latent trait parameters are unbiasedCitation11–13. In brief, Rasch-family models explain the probability of a response to an item as a function of the latent trait (true non-adherence for a patient in the case of the SPUR tool) and item parameters (difficulties). The lower the item difficulty, the higher the probability of a positive answerCitation14. The SPUR adherence profiling tool contains polytomous response options, it, therefore, uses a form of Rasch modeling called the Partial Credit Model (PCM)Citation15. Digital administration makes these models much more feasible and preferable for respondents to allow real-time customization of the questionnaire administration and computation of valid scores even if some items go unanswered.
The current study presents the analyses and results of the psychometric process of developing the SPUR algorithm. Our goal was to develop an algorithm for calculating summary adherence measures accurately even in the context of missing data on some of the itemsCitation6. Specifically, we describe analyses of the structure of the SPUR tool using a PCM and verify the assumption of a single unique latent trait representing “medication adherence.” Partial least-squares discriminant analyses were conducted to confirm the four SPUR dimensions (S, P, U, R) and identify which hierarchically-defined items within each dimension needed to be answered by a patient. Lastly, correlations were calculated between the latent trait of SPUR with other patient-reported adherence measures. The study used data collected via an online survey of type 2 diabetes patients living in the United States.
Methods
Study design and population
All study methods were reviewed and approved by the University of Michigan Medical School Institutional Review Board. Study participants with self-reported diabetes were recruited from Amazon.com’s Mechanical Turk crowdsourcing platform. Eligible respondents had to be 18 years of age or above, and have an Amazon.com account linked to an IP address in the United States. 12,906 respondents completed an initial screener in which they indicated whether or not they had ever been diagnosed by a healthcare provider with several chronic health conditions and when they were diagnosed with each condition. Only respondents who indicated that they had been diagnosed with type 2 diabetes for six months or more were eligible to participate in the subsequent Qualtrics survey focused on adherence behavior and adherence drivers. After providing consent, eligible participants were asked to complete a battery of questionnaires, including the SPUR tool, the MMAS-8 and the BMQ, as well as questions about their sociodemographic and clinical characteristics.
The MMAS-8 is a generic self-administered 8-item scale assessing medication-taking behaviorCitation16, developed from the validated 4-item scale, MMAS-4Citation2. The eight items asked direct questions about different situations leading to not taking treatment and are scored with 0 for a “Yes” and 1 for a “No” answer. The items are summed to give a range of scores from 0 to 8 with cutoffs indicating high adherence (scores of 0), moderate adherence (1–2), and low adherence (3–8).
The BMQ is an 18-item questionnaire evaluating people's beliefs about medicinesCitation4. The first eight items measure general belief about medication-related harms and overuse. The remaining ten items focus on medications that the respondent is currently taking and their beliefs regarding these medications’ necessity and concerns (e.g. side effects). Scores for the general scale range from 4 to 16 and scores for the respondent-specific scale range from 5 to 25.
Analysis
Exploration of the SPUR tool structure and item response option scoring
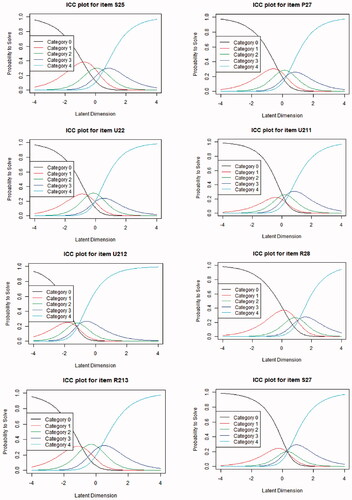
The frequency and percentage of responses were calculated for each item of the SPUR toolCitation17. A PCM analysis was conducted to understand the structure of the SPUR tool and determine whether all items reflect the same underlying concept. Akaike information criterion (AIC) and Bayesian information criteria (BIC) were used to examine the fit of the PCM. AIC and BIC obtained for PCM were compared to those obtained for a Graded Response Model (GRM) with one factor and a GRM with four factors corresponding to the dimensions S, P, U, and R. The fit of each item using p-value (χ2) was also examined. The item characteristic curve (ICC) of each SPUR item was computed to verify whether the response options were ordered in accordance with the scoring function specifications.
In the case of the misfit of an item whose response options are not ordered in accordance with the scoring function specifications, this item was recoded. The recoding consists of combining adjacent response options in the scoring algorithm.
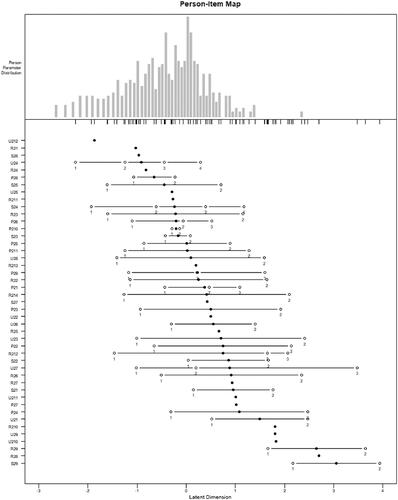
Finally, we constructed the person-item map, which shows the conjoint distribution of the participant measures and the location of the items along with the range of scores defined by the latent dimension, i.e. low non-adherence to high non-adherence. One purpose of the person-item map is to confirm that the SPUR items cover the full range of adherence behaviors in the population. This is determined by examining the distribution of the item difficulties and thresholds (represented in by solid and open circles) along the latent dimension (x-axis) in the person-item map.
Figure 1. Partial credit model – person-item map, locations of item difficulties are displayed with solid circles and thresholds of adjacent category locations with open circles. The participants are represented at the top of the map and the items are at the bottom of the map. The hardest items for participants to endorse are located on the right of the map, and the easiest items for participants to endorse are on the leftCitation18.
Validation of the meta-items
Four meta-items (one for each of the four S, P, U, R dimensions) were developed and tested for their ability to predict responses in further items. If these questions prove to be predictive of later responses they can be used in an operational version of SPUR as filters to open or close subsequent items, thereby reducing the testing burden. These meta-items employ the vignette techniqueCitation19 and describe prototypical chronic illness patients:
Social meta-item – “Jennifer has type 2 diabetes and is concerned that her treatment will affect her relationships with others.”
Psychological meta-item – “Michael has type 2 diabetes. He does not believe that he needs to take his medications just because his doctor says so.”
Usage meta-item – “Jeff has type 2 diabetes and is worried that it will be difficult to take his diabetes medication as prescribed by his doctor.”
Rational meta-item – “Theresa has type 2 diabetes. She does not believe that her medication is as important as her doctor seems to think.”
For each meta-item, along with the above, two statements are given for which participants are asked if they agree with each statement using a 5-point scale ranging from 1 (“strongly disagree”) to 5 (“strongly agree”). The hypothesis is that disagreement with these statements indicates that the participant has a higher probability of being adherent to their medication treatment. As such, the response options were classified into two categories: response options 1 and 2 were considered positive to indicate probable adherence whereas response options 3, 4, and 5 were considered negative. Negative response options indicate a need to delve deeper using all items of the corresponding dimension.
Due to the multicollinearity of the four SPUR dimensions, partial least-squares discriminant analysis (PLS-DA) was particularly well-suited to test the relevance of using the meta-items. PLSCitation20 allows exploring the fundamental relations between two matrices: in this case, the first matrix was the answers collected for the independent categorical variable (the considered meta-item with response options recoded as “1” when they were considered positive and as “0” when they were considered negative) that would be explained using the second matrix composed by data collected for the dependent variables (the subsequent items linked to this meta-item). Four PLS-DA were performed, one for each of the four meta-items.
Concurrent validity
Finally, Spearman’s correlation coefficients were calculated between the latent trait of SPUR-measured adherence and the MMAS-8 score and the four BMQ dimension scores.
Statistical analyses software
Statistical analyses were performed using SAS software for Windows (Version SAS Studio 3.7; SAS Institute, Inc., Cary, NC, USA) and the PCM and PLS-DA were performed using R (R version 3.6.2; 2019 The R Foundation for Statistical Computing).
Results
Population characteristics
Five hundred and one participants completed the SPUR items and were included in the analysis. Most participants were women (56%) and white (81%). The participant had a mean age of 45 years and 14% had at most a high school education (). All participants self-reported a diagnosis of type 2 diabetes with a time since diagnosis ranging from six months to one year for 13%; one to five years for 46% and more than five years for 41%.
Table 1. Description of participants.
Most respondents reported being diagnosed with type 2 diabetes between 1 and 5 years (45.7%) or >5 years (41.2%) prior to study. Nearly half of the sample reported using insulin (43.5%). Nearly all respondents reported using oral antidiabetic medications (88.7%). In terms of comorbidities, 19.5% of respondents reported having been diagnosed with heart disease, 30.8% reported a prior diagnosis of chronic respiratory disease (i.e. asthma and/or COPD), and 46.9% reported a prior diagnosis of depression
The mean MMAS-8 total score was 5.1 (standard deviation (SD) = 2.2), indicating a low level of adherence. The mean BMQ-General Harm subscale, Overuse subscale, Concerns subscale, and Necessity subscale scores were 14.8 (SD = 3.6); 11.3 (SD = 3.5); 11.6 (SD = 3.9); and 11.9 (SD = 4.3), respectively.
Exploration of the SPUR tool using PCM
The PCM fit was good, confirming that SPUR responses reflected one underlying latent trait hypothesized as non-adherence. Only 12 of 45 items did not fit the PCM model (p-value (χ2) < .05). AIC and BIC were 54,934.791 and 55,689.563 for the PCM, 57,809.323 and 58,758.059 for the GRM with one factor and 57,388.646 and 58,362.682 for the GRM with four factors, indicating a better fit of the Rasch model (PCM). Items that did not fit along with their corresponding fit statistics are shown in . The number of items that did not fit was the highest in the Rational dimension (4 items) and the lowest in the Psychological dimension (2 items).
Table 2. Fit statistics of items that did not fit initially.
The PCM ICC () showed that the response options for eight items were not ordered in accordance with the scoring function specifications. These observations led to item recoding. After item recoding, the PCM fit increased significantly and only six items over the initial 12 items did not fit the PCM model: S23; S24; P27; P28; U212, and R28.
Figure 2. Partial credit model – item characteristics curve plots. These curves are plots of the probability for each response option to be answered by the participants (y-axis) depending on the continuum of the latent trait being measured (x-axis representing the non-adherence level).
shows the person-item map which represents the distribution of the sample on the latent trait hypothesized to be non-adherence. Respondents were mainly located on the left of the map, indicating that most participants were moderate to highly adherent. Items located to the right on the map are more “difficult” than those located to the left. The person-item map shows that the “easiest” item was U24 “Too many doctors don’t listen to what patients tell them” and the most difficult item was S29 “My diabetes should be taken seriously.” More generally, the person-item map indicates that the items of the SPUR tool covered the full range of the patient population distribution. Furthermore, the items of the SPUR tool covered also the extreme right of the person-item map (even if no participant is located at this extremity), indicating that high levels of non-adherence also should be well assessed by this tool.
Validation of the meta-items
presents the results from the PLS-DA for each of the four SPUR dimensions. Four items (see ) discriminated the answers obtained for the Social meta-item with an error rate of 21%. Nine items discriminated the answers obtained for the Psychological meta-item with an error rate of 20%, and 14 items U21 shown in discriminated the answers obtained for the Usage meta-item with an error rate of 33%. The remaining items discriminated against the answers obtained for the Rational meta-item with an error rate of 10%.
Table 3. Error rate and very important projection (VIP) were obtained from the partial least-squares discriminant analysis (PLS-DA).
Correlation between the latent trait of SPUR adherence to MMAS-8 and BMQ
As shown in , the latent trait of the SPUR tool presented a slightly higher correlation with the MMAS-8, nearing 0.5 (p-value < .0001) than with the BMQ dimensions (0.32 to 0.48, p-values < .0001).
Table 4. Spearman’s correlation coefficient between the latent trait of the SPUR questionnaire and MMAS-8 and BMQ dimensions.
Discussion
We evaluated key psychometric properties of the SPUR tool in a large diverse sample of people with type 2 diabetes recruited from Amazon.com’s Mechanical Turk online crowd-work platform. Studies have shown that the Mechanical Turk respondent pool broadly represents the general population with respect to educational attainment, income, and other sociodemographic factorsCitation21,Citation22.
The distributions of the responses for the SPUR items demonstrated good use of all response options for each of the 45 items. This indicates that the items seemed to be globally well-understood by respondents and that the options described a wide range of patient adherence experiences.
After recoding 12 items that did not fit the PCM model and for which the response options were not ordered as expected, six of those items still did not fit the final PCM model. Most of these items were designed to investigate the importance of social norms, e.g. “Medications are more expensive than they should beCitation6.” Two items were related to time (projection into the future or attitudes towards current vs. future benefits) and were designed to take into account discounting of future benefits. The poor fit of these items with the PCM model may indicate that these hypothesized drivers of adherence are less important than expected for this population of patients. It may also be that these items are more difficult to understand for some respondents. One cannot either exclude the possible impact of the involvement of the care-taking doctors which could affect the PCM model items that did not fit. Furthermore, it is also important to keep in mind that the sample size of participants who answered all items was relatively high (501 participants), and studies indicate that this can engender item fit issues for items with no real problems because the tests are overpoweredCitation23. For all of these reasons, the performance of these items should be tested further with data collected in other populations with other chronic conditions in order to decide whether they should be kept or dropped. The PCM had a good initial fit and an even better fit after item recoding. The fit results obtained for GRM with four factors were slightly better than those obtained for GRM with one factor but not as good as those obtained for PCM. These results confirm that one underlying latent trait is measured by the SPUR tool. This finding is further supported by the correlation between the latent trait of the SPUR tool to the MMAS-8 nearing 0.5 (p-value < .0001), which was higher than the correlations between the MMAS-8 and the BMQ. This confirms our assumption about the latent trait hypothesized as non-adherence.
The person-item map demonstrates that the items of the SPUR tool covered the entirety of the adherence behavior continuum without gaps. Most respondents’ answers fell on the left of the person-item map, confirming that the population was moderate to highly adherent. This could be linked to the assumption that fewer adherent patients are likely to be under-represented in panels requiring patients to actively participate in studies. The study sample is quite adherent, and certainly being more adherent than the population targeted with this tool in the future poses a limitation and calls for future studies focusing on fewer adherent populations.
The results obtained for the validation of the meta-items using PLS-DA were particularly good, especially for the Rational meta-item. The results indicate that the four meta-items are specific enough to the subsequent items in the dimensions and can be used to identify participants for whom the administration of the subsequent items in corresponding dimensions would be of interest. However, the error rate for the Usage meta-item remains high, reflecting the fact that this item reflects a diverse set of practical concerns ranging from financial issues to forgetfulness. Therefore the lower performance in terms of psychometrics is attributable to the composite nature of the domain, not to a weakness in the questioning.
Analyses conducted with the PCM and PLS-DA models suggest that a personalized algorithm for SPUR administration can be designed, to improve the efficiency in the detection of patients with adherence issues while limiting the testing burden. The SPUR tool presents a comprehensive approach to adherence: the underlying 4-dimension structure covers a large variety of determinants of behavior; the range of items provides comprehensive coverage of detailed concepts relevant to patients and a rather high granularity in the evaluation of patients on the adherence continuum, from the most adherent to the most non-adherent ones. The analytic methods used (PCM and PLS-DA) are highly tolerant to missing data, colinearity and non-normal distributions, which ensures the generalizability of findings as well as their transferability to practical applications. Altogether, this first psychometric evaluation of SPUR suggests that the instrument could be used for efficient detection and profiling of patients facing adherence issues, and for the design of tailored intervention with digital support programs. In order to confirm these findings, and to finalize and validate the SPUR algorithm, two similar studies are currently ongoing: in the United Kingdom and in France.
Diabetes was chosen as a pathology for this research largely because of the importance of the disease for public healthcare, the established impact of low adherence on diabetes outcomes and the relative ease with which subjects can be recruited. Focusing on diabetes is a limitation, and further research is needed to establish the ability of SPUR to predict non-adherence in other pathologies and to establish correlations for various drivers across the three constituents of non-adherence: lack of initiation, poor implementation, and non-persistenceCitation24.
Conclusions
The SPUR tool was designed to assess the risk of non-adherence to treatment for patients with chronic diseases via an interactive, customized digital tool while identifying the specific drivers of that risk for individual patients. The results of the current study indicate that there is a unidimensional latent trait of adherence which is well-described by the SPUR tool and it is highly likely to correspond to adherence behavior and adherence-related health outcomes. These results are encouraging and indicate that the SPUR tool serves its designed purpose and can be used in a personalized fashion, in which underlying items are presented to respondents in a hierarchical manner, reflecting their utility for measuring the underlying concept of adherence and identifying the specific drivers of non-adherence for each individual patient. The potential for SPUR to link the relative importance of these different previously-established behavioral drivers to the risk of non-adherence for individual patients should enhance the impact of DATs by allowing personalized behavioral interventions even in fully automated settings.
Transparency
Declaration of funding
This study was funded by Observia.
Declaration of financial/other relationships
JP and AL report direct financial compensation from Observia to support this research. KD and GH are employees of Observia. BA and EdB are employees of ICON plc which was paid by Observia to carry out this research. Peer reviewers on this manuscript have no relevant financial or other relationships to disclose.
Author contributions
All author(s) were involved in the conception and design, analysis and interpretation of the data; as well as the drafting of the paper and the final approval of the version to be published. All authors agree to be accountable for all aspects of the work.
Acknowledgements
The authors would like to thank all patients in the US. The authors would also like to thank Gwendoline Moreau (BioStatem) for performing data analysis and Jeremy Lambert (ICON plc) for medical writing and editorial support.
Data availability statement
The data sets analyzed during this study are available from the corresponding author on reasonable request.
References
- World Health Organization. Adherence to long-term therapies: evidence for action. Eduardo Sabaté, editor. Geneva: World Health Organization; 2003.
- Morisky DE, Green LW, Levine DM. Concurrent and predictive validity of a self-reported measure of medication adherence. Medical Care. 1986;24(1):67–74.
- Thompson K, Kulkarni J, Sergejew AA. Reliability and validity of a new medication adherence rating scale (MARS) for the psychoses. Schizophrenia Research. 2000;42(3):241–247.
- Horne R, Weinman J, Hankins M. The beliefs about medicines questionnaire: the development and evaluation of a new method for assessing the cognitive representation of medication. Psychol Health. 1999;14(1):1–24.
- Hahn SR, Park J, Skinner EP, et al. Development of the ASK-20 adherence barrier survey. Curr Med Res Opin. 2008;24(7):2127–2138.
- Dolgin K. The SPUR model: a framework for considering patient behavior. Patient Prefer Adherence. 2020;14:97–105.
- Falissard B. Mesurer la subjectivité en santé: perspective méthodologique et statistique. Paris: Masson; 2001.
- Fayers PM, Machin D. Quality of life: the assessment, analysis and interpretation of patient-reported outcomes. Chichester: John Wiley & Sons; 2007.
- Boone WJ. Rasch analysis for instrument development: why, when, and how? CBE Life Sci Educ. 2016;15(4):rm4.
- Fischer GH, Molenaar IW. Rasch models: foundations. Recent developments, and applications. Springer New York; 1995.
- Baker FB, Kim SH. Item response theory: parameter estimation techniques. Second Edition. Boca Raton (FL): CRC Press; 2004.
- de Bock É, Hardouin JB, Blanchin M, et al. Rasch-family models are more valuable than score-based approaches for analysing longitudinal patient-reported outcomes with missing data. Stat Methods Med Res. 2016;25(5):2067–2087.
- de Bock É, Hardouin JB, Blanchin M, et al. Assessment of score- and Rasch-based methods for group comparison of longitudinal patient-reported outcomes with intermittent missing data (informative and non-informative). Qual Life Res. 2015;24(1):19–29.
- de Gruijter DNM, van der Kamp LJT. Statistical test theory for the behavioral sciences. New York: Chapman and Hall/CRC; 2007.
- Andrich D. A rating formulation for ordered response categories. Psychometrika. 1978;43(4):561–573.
- Morisky DE, Ang A, Krousel-Wood M, et al. Predictive validity of a medication adherence measure in an outpatient setting. J Clin Hypertension. 2008;10(5):348–354.
- Jackson SL. Research methods and statistics: a critical thinking approach. Andover (MA): Cengage Learning; 2015.
- Engelhard G. Invariant measurement: using Rasch models in the social, behavioral, and health sciences. New York: Routledge/Taylor & Francis; 2013.
- Hughes R. Considering the vignette technique and its application to a study of drug injecting and HIV risk and safer behaviour. Sociol Health & Illness. 1998;20(3):381–400.
- Wold S, Sjöström M, Eriksson L. PLS-regression: a basic tool of chemometrics. Chemometrics and Intelligent Laboratory Systems. 2001;58(2):109–130.
- Chan C, Holosko M. An overview of the use of mechanical Turk in behavioral sciences. Research on Social Work Practice. 2016;26(4):441–448. 07/06
- Paolacci G, Chandler J, Ipeirotis PG. Running experiments on amazon mechanical Turk. Judgment and Decision Making. 2010;5(5):411–419.
- Stone M, Yumoto F. The effect of sample size for estimating Rasch/IRT parameters with dichotomous items. J Appl Meas. 2004;5(1):48–61.
- Vrijens B, De Geest S, Hughes DA, et al. A new taxonomy for describing and defining adherence to medications. Br J Clin Pharmacol. 2012;73(5):691–705.