
Abstract
Objective
This study aimed to develop and validate a predictive algorithm for unsatisfactory response to initial pulmonary arterial hypertension (PAH) therapy using health insurance claims.
Methods
Adult patients with PAH initiated on a first PAH therapy (index date) were identified from Optum’s de-identified Clinformatics Data Mart Database (1/1/2010–12/31/2019). A random survival forest algorithm was developed using patient-month data and predicted the “survival function” (i.e. risk of not having unsatisfactory response) over time. For each patient-month observation, risk factors were assessed in the 12 months prior. Unsatisfactory response was defined as the first instance of (1) new PAH therapy, (2) PAH-related hospitalization or emergency room visit, (3) lung transplant or atrial septostomy, (4) PAH-related death or (5) chronic oxygen therapy initiation. To facilitate use in clinical practice, a simplified risk score was also developed based on a linear combination of the most important risk factors identified in the algorithm.
Results
In total, 4781 patients were included (median age = 69.0 years; 58.6% female). Over a median follow-up of 14.0 months, 3169 (66.3%) had an unsatisfactory response. The most important risk factors included in the algorithm were healthcare resource use (i.e. PAH-related outpatient visits, pulmonologist visits, cardiologist visits, all-cause hospitalizations), time since first PAH diagnosis, time since index date, Charlson Comorbidity Index, dyspnea, and age. Predictive accuracy was good for the full algorithm (C-statistic: 0.732) but was slightly lower for the simplified risk score (C-statistic: 0.668).
Conclusion
The present claims-based algorithm performed well in predicting time to unsatisfactory response following initial PAH therapy.
Introduction
Pulmonary arterial hypertension (PAH) is a rare, progressive subtype of pulmonary hypertension (PH) characterized by the presence of pre-capillary PHCitation1. PAH has been traditionally defined as a mean pulmonary arterial pressure ≥25 mm Hg (although a threshold of >20 mm Hg has been recently proposedCitation2,Citation3) pulmonary arterial wedge pressure ≤15 mm Hg, and pulmonary vascular resistance ≥3 wood unitsCitation1. It affects 15–50 persons per million within the United States (US), with a higher prevalence among women and a mean age at diagnosis of about 50 yearsCitation2,Citation4–6. Symptoms of PAH are typically activity-related and include dyspnea, chest pain, fatigue, and dizzinessCitation7,Citation8. Due to the non-specific nature of these symptoms, patients often remain undiagnosed until the more advanced stages of the diseaseCitation8–10. As PAH progresses, symptoms may occur at rest, and patients are at increased risk of fatal right-heart failureCitation11,Citation12. Despite recent advancements in treatment, the prognosis for patients diagnosed with PAH remains poor, with a 5-year survival rate of only about 60% in the USCitation4,Citation13.
Treatment for PAH can be broadly categorized into general measures (e.g. dietary and lifestyle modifications), supportive therapies (e.g. diuretics and oral anticoagulants), calcium channel blockers, and PAH-specific drug therapies (i.e. targeting components of key PAH-relevant molecular pathways) Citation1. The past two decades have seen a proliferation of pharmacological agents for the treatment of PAH. In particular, phosphodiesterase type 5 inhibitors (PDE5is) and endothelin-receptor antagonists (ERAs) are frequently used as first-line oral therapies for PAHCitation1. Prostacyclin pathway agents (PPAs) are generally used following disease progression, although a large proportion of patients with PAH are never treated with a PPA at any timeCitation1,Citation14,Citation15. Additionally, combination therapy is recommended by current guidelines for the treatment of patients with PAHCitation1. Meta-analyses have shown that, compared with monotherapy, combination therapy significantly reduces the risk of progression by approximately 35% among patients with PAHCitation16,Citation17.
Given that PAH is a progressive and life-threatening disease, delayed identification of patients at risk might lead to inadequate treatment and poor outcomes. A predictive algorithm that could identify patients at higher risk of an unsatisfactory response to initial PAH therapy might enable healthcare providers to target those who would benefit from early combination therapyCitation9. Indeed, frequent and regular risk assessment is an essential aspect of PAH management per the guidelines of the European Society of Cardiology (ESC) and the European Respiratory Society (ERS), 6th World Symposium on Pulmonary Hypertension (WSPH), and American College of Chest Physicians (CHEST) Citation1,Citation18,Citation19. In current risk assessments, patients are typically stratified according to the risk of 1-year mortality using a comprehensive approach that takes multiple prognostic factors into accountCitation1,Citation20–24. For instance, the Registry to Evaluate Early and Long-Term PAH Disease Management (REVEAL) risk calculator was developed using data collected from patients enrolled in the REVEAL observational prospective registryCitation20,Citation25,Citation26. Risk factors for mortality at 1-year follow-up were identified by Cox regression models; these prognosis equations were then used to categorize patients into specific risk groupsCitation25. To expedite risk assessment in the clinic, the REVEAL Lite 2 was developed, which uses only six variables including functional class (FC), vital signs (systolic BP [SBP] and heart rate), 6-min walk distance (6MWD), brain natriuretic peptide (BNP)/N-terminal prohormone of brain natriuretic peptide (NT-proBNP), and renal insufficiency (by estimated glomerular filtration rate [eGFR]) Citation20.
The 2015 ESC/ERS guidelines recommend therapeutic approaches based on risk stratification, with the aim of achieving or maintaining a lower risk status among patientsCitation1,Citation14. However, current risk assessment tools, such as the REVEAL risk calculator, often require access to clinical values that are not widely available among patients (e.g. FC, 6MWD, NT-proBNP/BNP levels, measures of hemodynamics, and pulmonary function), thereby restricting their routine use in daily practiceCitation1,Citation20–24,Citation27. To address this limitation, the present study aimed to develop and assess the performance of a predictive algorithm for unsatisfactory response to initial PAH therapy among patients diagnosed with PAH using health insurance claims data.
Methods
Data source
Patient-level data were retrieved from the Optum ClinformaticsFootnotei Data Mart Database (1/1/2010–12/31/2019), which contains de-identified insurance claims from patients enrolled in commercial and Medicare Advantage health plans in the US. The information available in the database includes demographic characteristics, type of healthcare provider, diagnoses for all types of encounters within the network, detailed area of care during hospitalization, inpatient hospital procedures, inpatient medications, and pharmacy claims. The Optum database is de-identified and fully compliant with the patient confidentiality requirements of the Health Insurance Portability and Accountability Act (HIPAA). Therefore, no Institutional Review Board approval was required for the present study.
Study design
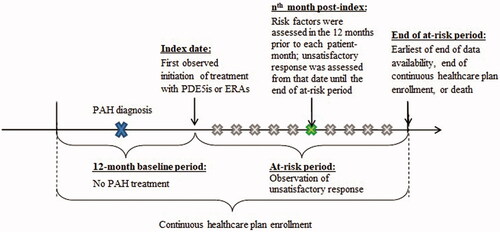
A retrospective study design was used to develop a predictive algorithm for unsatisfactory treatment response among patients with PAH who had been newly initiated on a first PAH therapy. The index date for a given patient was defined as the date of the first documented prescription claim for a PAH-specific PDE5i or ERA therapy. The baseline period was defined as the 12 months preceding the index date and served as a washout period to increase the likelihood of capturing the first PAH therapy as of the index date. The subsequent at-risk period spanned from the index date until the earliest of the end of data availability, the end of continuous healthcare plan enrollment, or death.
The data used to develop the algorithm were organized at the patient-month level, where an observation was included for each month between the index date and the end of the at-risk period or the first indicator of an unsatisfactory response to initial PAH therapy (see Study Outcome and Risk Factors). For each observation, the time to unsatisfactory response was assessed and risk factors were evaluated in the prior 12 months to allow for variation over time. This design allowed the algorithm to predict the time to unsatisfactory response at any given time point following the index date. depicts the study scheme.
Figure 1. Study design. Abbreviations. ERAs, endothelin-receptor antagonists; PAH, pulmonary arterial hypertension; PDE5is, phosphodiesterase type 5 inhibitors.
Study population
Eligible patients had ≥1 prescription fill for a PAH-specific PDE5i or ERA as part of the index regimen, which was defined as the treatment initiated on the index date along with any other treatment indicated for PAH initiated within a 60-day window after the index date. A 60-day window after the index date was used to account for any potential delays in initiation of certain agents from a combination therapy, for example, delays prior to receiving reimbursement authorization from health insurer or enrollment in a Risk Evaluation and Mitigation Strategy [REMS] program. Patients were also required to have ≥1 documented diagnosis of PAH (ICD-9-CM: 416.0, 416.8; ICD-10-CM: I27.0, I27.20, I27.21, I27.89) in an inpatient or emergency room setting or ≥2 documented diagnoses of PAH in an outpatient setting recorded during the baseline period or on the index date. Additionally, patients were required to be continuously enrolled in their healthcare plan for ≥12 months prior to the index date. Patients were excluded from the study if they were <18 years of age at the index date, had ≥1 prescription fill for a medication indicated for PAH (i.e. PDE5is, ERAs, PPAs, or riociguat) prior to the index date, received PPAs as part of their index regimen, or had ≥1 documented diagnosis of chronic thromboembolic pulmonary hypertension (CTEPH; ICD-9-CM: not available; ICD-10-CM: I27.24 available as of October 2017) at any time. Of note, PPAs were not considered for the index date, since they are typically used for more advanced stages of the disease, while the use of riociguat in monotherapy was not considered as it is not PAH-specific and could lead to the inclusion of patients with CTEPH in the study sample. All eligible observations were included in this retrospective analysis; therefore, sample size and power calculations were not performed.
Study outcome and risk factors
Patients were considered to have an unsatisfactory response if they had any of the following during the at-risk period: (1) initiation of a new treatment indicated for PAH not part of the index regimen (i.e. switch or add-on), (2) PAH-related or heart failure-related hospitalization or emergency room visit, (3) lung transplant or atrial septostomy, (4) PAH-related death, or (5) chronic oxygen therapy initiation (additional details are provided in ). The time to unsatisfactory response was defined as the number of days between the index date and the date of the first occurrence of any of the components listed above. For each patient-month observation, the algorithm predicted the “survival function”, that is, the risk of not having the outcome at each subsequent time point. The predicted time to the outcome was then defined as the time at which the predicted survival function reached <50%. Candidate risk factors were selected based on a targeted literature review and included diagnosis codes, procedures codes, and pharmacological treatments received (Supplementary Table 1).
Table 1. Unsatisfactory clinical response during the at-risk period.
Statistical analyses
Descriptive statistics and univariate associations
Frequencies of the study outcome and its underlying components during the at-risk period were reported for patients meeting the inclusion and exclusion criteria. Univariate associations between the outcome and each candidate risk factor evaluated during the 12-month baseline period were assessed using Chi-Square test for categorical variables and Wilcoxon rank-sum test for continuous variables.
Algorithm development
The algorithm was developed using random survival forests, a tree-based machine learning strategy that can be used to build predictive models based on right-censored survival dataCitation28. One advantage of random survival forests compared to traditional regression-based approaches for analyzing right-censored data is that it does not need to rely on strict underlying assumptionsCitation28–30. For example, Cox regression models assume that the hazard ratio associated with a given risk factor should be constant across time (i.e. proportional hazards assumption), and that predictor variables have a linear relationship to outcomes. By contrast, random survival forests are nonparametric, and thus independent of model assumptions. Furthermore, common limitations of regression-based alternatives (e.g. Cox models), such as difficulty accommodating interactions between predictorsFootnoteii, overfitting and inflated standard errors, are more naturally addressed by random survival forests. Consequently, random survival forests are well-suited for the analysis of high-dimensional right-censored survival dataCitation28–30.
In the current random survival forests algorithm, an ensemble of 500 survival trees predicted a survival function for each patient-month observation, namely the probability that a patient does not have an unsatisfactory response at a given time point after that monthFootnoteiii. The predictions of the 500 survival trees were averaged to produce a prediction for the random survival forest. Trees were developed using a bagging approach (i.e. bootstrap aggregating), where each survival tree was developed based on a random subsample of data (i.e. in-bag sample) and model performance was evaluated based on the observations that were left out (i.e. out-of-bag sample). Of note, each of the in-bag samples included no more than one observation for a given patient, and the remaining observations for patients included in a given in-bag sample were excluded from the corresponding out-of-bag sample.
Variable importance was determined based on the average contribution of each candidate risk factor to the algorithm’s performance. This was measured by permuting a single variable, refitting the model on the altered data, and calculating the decrease in model performance as measured by the C-statistic. This process was then repeated for all variables. Risk factors with zero or negative importance, which represented either variable with no prediction power or noise that reduced algorithm performance (non-predictive risk factors), were removed from the list of candidate risk factorsCitation11. The algorithm was then retrained on the remaining subset of candidate risk factors until all risk factors had positive importance. The risk factors that were ultimately retained in the algorithm were then rank-ordered based on their importance for predicting time to unsatisfactory response.
The predictive accuracy of the final algorithm in out-of-bag samples was measured in terms of the concordance statistic (C-statistic), which indicates the degree of agreement between the observed and the predicted time to unsatisfactory responseCitation31. Based on prior literature, the C-statistic typically ranges between 0.6 and 0.75 for biomedical applicationsCitation13. In addition, the sensitivity, specificity, negative predictive value, and positive predictive value of the algorithm were assessed at key time points based on the predicted time to the outcome.
Given that the random survival forest algorithm requires the averaging of predictions over 500 trees, this approach may not be easily applicable in real-world clinical practice. Therefore, a simplified linear risk score was also developed as a tool to assess the risk level for a given patient based on a numerical score (i.e. a higher score indicates a higher risk). It should be noted that this simplified risk score does not provide a prediction of the risk of unsatisfactory response at various time points (i.e. “survival curve”) for a given patient, as per the full algorithm. The simplified risk score was developed using an 80% random subsample (training set) and validated using the remaining 20% (validation set) Citation32. Cross-entropy optimization was used to maximize the predictive accuracy in the training sample with the following restrictions: (1) only the top 20 risk factors were considered based on variable importance derived from the random survival forest algorithm, (2) the score was a linear combination of risk factors, (3) coefficients were limited to integers between −10 and 10 and risk factors with a coefficient of 0 were dropped from the risk score, (4) risk factors with high collinearity with other risk factors included in the simplified risk score were further excluded (i.e. risk factors with a Pearson correlation >0.3; among collinear risk factors, those with the highest predictive accuracy were kept). For each patient month, observations were classified into risk groups based on the risk score terciles (i.e. each group comprised a third of the training sample). Given that risk factors could vary over time, a given patient could be classified into different risk groups at different time points. Kaplan-Meier analyses of time to unsatisfactory response over the duration of the at-risk period were conducted by the risk group.
The analyses in the present study were performed using R version 3.6.2; the random survival forest was developed using the Ranger package version 0.12 and the simplified risk score was developed using the CEoptim package version 1.2.
Results
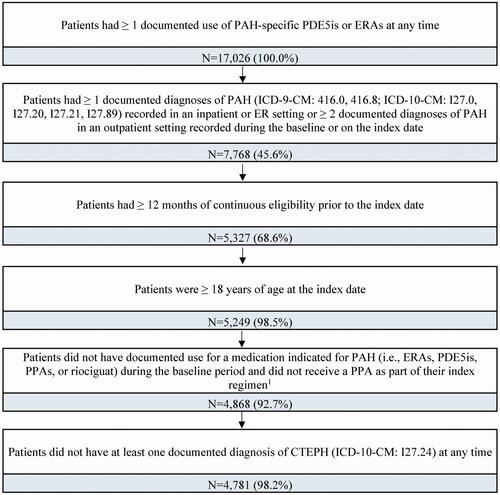
A total of 17,026 patients with documented use of a PAH-specific PDE5i or ERA at any time were identified in the claims database. After applying the eligibility criteria, a total of 4781 adult patients with PAH were included in the study sample ().
Figure 2. Sample selection flowchart. Abbreviations. CTEPH, chronic thromboembolic pulmonary hypertension; ERAs, endothelin-receptor antagonists; PAH, pulmonary arterial hypertension; PDE5is, phosphodiesterase type 5 inhibitors; PPA, prostacyclin pathway agent. Notes: 1. The index regimen was defined as the treatment initiated on the index date, along with any other treatment indicated for PAH initiated within a 60-day window after the index date.
Patient characteristics
Among patients in the study sample, the median duration of the at-risk period was 14.0 months. During the at-risk period, 66.3% of patients (n = 3169) experienced an unsatisfactory response (); the most common unsatisfactory response among these patients was ≥ 1 PAH-related or heart failure-related hospitalization or ER visit (54.6%; n = 2611).
Patient demographic and clinical characteristics during the baseline period are presented in . In the overall study sample, the median age was 69.0 years and 58.6% of patients were female. Patients in the overall study sample had a median Quan-CCI score of 4.0 and the most common comorbidities included valvular disease (60.4%), chronic obstructive pulmonary disorder (54.3%), and cardiomegaly (43.8%).
Table 2. Baseline characteristics.
Patients with an unsatisfactory response during the at-risk period had different demographic and clinical characteristics at baseline compared to those who did not have the study outcome (). In particular, patients with an unsatisfactory response were more likely to be older (median age: 70.0 vs. 68.0; p < .05) and female (63.8% vs. 48.2%; p < .001). During the baseline period, patients with an unsatisfactory response also had a greater comorbidity burden, as evidenced by a higher median Quan-CCI score (4.0 vs. 3.0; p < .001) and a greater proportion of patients with cardiomegaly (46.1% vs. 39.2%; p < .001), chronic obstructive pulmonary disorder (56.4% vs. 50.2%; p < .001), and pulmonary fibrosis (23.2% vs. 15.0%; p < .001). Patients with an unsatisfactory response also had a greater frequency of common PAH-related symptoms such as dyspnea (91.3% vs. 83.7%; p < .001), chest pain (44.4% vs. 33.2%; p < .001), and lower limb edema (38.4% vs. 29.0%; p < .001). Moreover, an unsatisfactory response to PAH therapy was associated with more frequent medical encounters. Compared to patients without the study outcome, patients with an unsatisfactory response had a greater mean number of all-cause hospital admissions (1.6 vs. 1.2; p < .001), PAH-related outpatient visits (5.9 vs. 5.0; p < .001), cardiologist visits (10.1 vs. 8.8; p < .001), and pulmonologist visits (5.3 vs. 3.7; p < .001), as well as more PAH-related procedures such as echocardiography (48.2% vs. 36.3%) and right heart catheterization (RHC; 29.9% vs. 19.2%; all p < .001).
Random survival forest algorithm
Predominant risk factors for unsatisfactory response identified by the algorithm are presented in . Risk factors with the greatest importance during the prior 12-month period included HRU (i.e. PAH-related outpatient visits, pulmonologist visits, cardiologist visits, and all-cause hospital admissions), time since first PAH diagnosis, time since index date, Quan-CCI score, dyspnea, and age. Notable predictors of unsatisfactory response also included PAH-specific procedures (i.e. echocardiography and RHC), gender, comorbidities (i.e. cardiomegaly, pulmonary fibrosis, valvular disease, and chronic obstructive pulmonary disease), and other PAH-specific symptoms (i.e. chest pain, lower limb edema). The algorithm demonstrated a good ability to predict unsatisfactory response to initial PAH therapy (C-statistic: 0.732); the algorithm had 82% sensitivity and 55% specificity at 12 months ().
Figure 3. Top 20 most important risk factors based on random survival model algorithm. Abbreviations. PAH, pulmonary arterial hypertension; RHC, right heart catheterization.
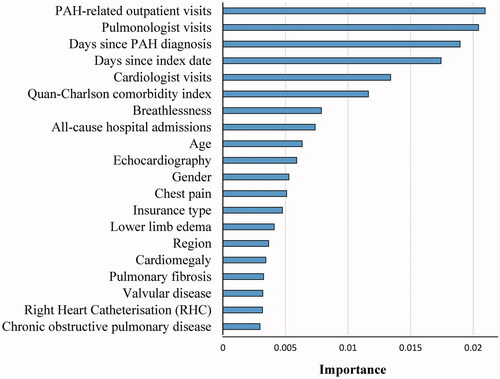
Table 3. Algorithm performance at key time points.
Simplified risk score
The simplified risk score was developed based on the 20 top risk factors presented in . A final set of seven risk factors were incorporated into the simplified risk score, with scores ranging from −10 to 27 (higher score indicates a higher risk of the outcome; ). Specifically, the factors in the simplified risk score included: having ≥4 PAH-related outpatient visits (+8 points), ≥1 pulmonologist visit (+6 points), ≥1 hospitalization for any cause (+5 points), or a diagnosis of dyspnea (+5 points), pulmonary fibrosis (+2 points), or chest pain (+1 point). Additionally, the simplified risk score included ≥3 months since treatment initiation, which was associated with a reduced risk of unsatisfactory response (−10 points). The simplified risk score achieved good predictive accuracy in the training set (C-statistic: 0.645) and the validation set (C-statistic: 0.668; ).
Table 4. Simplified risk score.
Survival curves by risk group
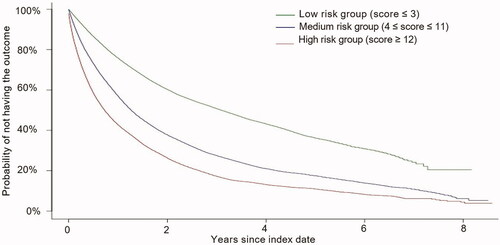
Based on risk score terciles, each patient-month observation was assigned to one of three risk groups as follows: (1) low-risk group (score ≤ 3), (2) medium-risk group (4 ≤ score ≤ 11), and (3) high-risk group (score ≥ 12). Compared to patients in the low-risk group, those in the high-risk group were more likely to have ≥4 PAH-related outpatient visits in the past year (79.6% vs. 7.4%; p < .001), ≥1 pulmonologist visit (95.1% vs. 65.4%; p < .001), and ≥1 hospitalization for any cause (71.6% vs. 9.3%; p < .001). They were also more likely to have dyspnea (96.2% vs. 44.8%; p < .001), pulmonary fibrosis (26.8% vs. 10.0%; p < .001), and chest pain (46.2% vs. 9.0%; p < .001; data not shown).
The Kaplan-Meier analysis shows that the three risk groups have a clear separation in terms of their probability of not having an unsatisfactory response at a given time point (). In particular, the median time to the outcome was 0.7 years (8.7 months) for the high-risk group, 1.3 years (15.1 months) for the medium-risk group, and 3.1 years (37.5 months) for the low-risk group.
Figure 4. Kaplan-Meier curves for unsatisfactory response by risk groups.
Discussion
The present study used machine learning to develop and validate a predictive algorithm for unsatisfactory response to initial PAH therapy using health insurance claims data. An algorithm was developed to capture the impact of risk factors evaluated in the prior 12 months on unsatisfactory response during the subsequent at-risk period. Risk factors with the greatest importance included healthcare resource use (e.g. PAH-related outpatient visits, all-cause hospitalizations), time since first PAH diagnosis, time since index date, Quan-CCI score, dyspnea, and age. Based on the risk factors with a higher importance in the full algorithm, a simplified risk score was developed for ease of clinical application. The simplified risk score consisted of seven factors including HRU, diagnosis of symptoms/comorbidities, and time since treatment initiation. Despite the simplified risk score having a lower predictive accuracy than the full algorithm (C-statistic: 0.732 vs. 0.668), it provided a clear separation of risk among the three different risk categories (i.e. low, medium, and high risk). In light of these findings, the current risk assessments could potentially serve as part of a comprehensive strategy for the management of patients with PAH, alongside the use of clinical judgment and evidence-based guidelines. We caution that this model should not be used by payers to limit access to care for patients based on low-risk scores. Rather, it could serve as a complementary tool to identify patients at high risk that are not already flagged by physicians. In any case, a physician’s judgement should always prevail when determining the appropriate management of a given patient.
In the present study, increased HRU in the last 12 months was strongly associated with a higher risk of unsatisfactory response. Consistent with this, all-cause hospitalization was associated with an increased risk of 1-year mortality based on the REVEAL 2.0 and REVEAL Lite 2 risk scoresCitation20,Citation25. Similarly, another analysis of data from the REVEAL registry found that all-cause hospitalization was a strong marker for poor 1-year survival in both previously diagnosed and newly diagnosed PAH patientsCitation33. Notably, in an analysis of data from the Phase III GRIPHON trialCitation34, the primary endpoint component of hospitalization for worsening of PAH was found to be a significant risk factor for subsequent mortality over a 1-year follow-upCitation35. Treatment guidelines recommend that healthcare providers perform a comprehensive assessment of patients with PAH at diagnosis/treatment initiation, at least every 6–12 months routinely in the event of clinical worsening, and 3–6 months after a change in therapyCitation1,Citation14. Overall, evidence suggests that multi-parametric assessments of patients are being performed by physicians in the context of routine consultationsCitation27. Although regular PAH-related outpatient visits are therefore to be expected as part of patient management, the present study found that ≥4 visits in the prior year is highly predictive of an increased risk of unsatisfactory response to treatment. Unfortunately, the information available in the database does not allow us to determine the reasons why certain patients might have had ≥4 PAH-related outpatient visits in the prior year. However, there are plausible explanations based on the prior literature. First, the common problem of delayed diagnosis could have resulted in the diagnosis of patients at a more advanced stage of diseaseCitation36, which would, in turn, necessitate more frequent PAH-related assessments. Second, patients diagnosed with PAH could have had an event of clinical worsening that was not captured in the current database, but which required more frequent assessmentsCitation1,Citation14,Citation27. Finally, suboptimal therapeutic management of PAH could have led to poor symptom management and thus an increased number of outpatient visits.
Diagnoses of certain PAH-related symptoms and comorbidities were also important predictors of unsatisfactory response in the present study. In particular, recorded diagnoses of dyspnea or chest pain in the last year emerged as salient risk factors in both the full algorithm and the simplified risk score. Since PAH often goes undetected until the later stages due to the non-specificity of its symptoms, it is possible that patients seeking medical care for such symptoms had greater disease severity than those who did not. Prior evidence suggests that a rapid rate of symptomatic progression is associated with a worse prognosis among patients with PAHCitation1,Citation37. Therefore, it is critical to identify patients at higher risk of an unsatisfactory response at an early stage, when they have less severe disease and may respond more favorably to the appropriate therapyCitation37. Of the comorbidities observed in the present study, pulmonary fibrosis was associated with an increased risk of unsatisfactory response, which corroborates previous reports of an association between pulmonary diseases and poor clinical outcomes in patients with PAHCitation1,Citation38,Citation39.
The predictive accuracy of the present random survival forest algorithm is comparable to other risk scores (e.g. C-statistics of 0.76 for REVEAL 2.0 and 0.73 for REVEAL Lite 2) Citation20, while the simplified algorithm had slightly lower predictive accuracy than other risk scores. However, it was not possible to directly compare the performance of these various risk tools in our sample due to the lack of availability of risk factors such as the FC, 6MWD, and NT-proBNP/BNP levels in our claims database. Future studies are warranted to compare the performance of our claims-based algorithms with that of other risk scores in the same population. Given machine learning algorithms allow for non-linearity and interactions between risk factors, they may have better performance than regression-based risk assessments in certain circumstances, such as when the regression model’s assumptions (e.g. linearity, proportionality) are not met or when there are multiple interactions between variablesCitation24. However, variations in the predictive accuracy between risk assessments may also reflect additional factors, such as differences with respect to outcomes, study populations, and the availability of certain patient-level information. For instance, previously validated risk assessments mainly predicted survivalCitation20,Citation25,Citation26, whereas the present study aims to predict unsatisfactory response to treatment. While prior risk assessments were designed to predict outcomes among incident patientsCitation22,Citation23, treatment naïve patientsCitation21, or any patients with PAHCitation20,Citation24–26, the present study aimed to predict outcomes specifically among patients with PAH initiated on the first treatment with PAH-specific PDE5is or ERAs. Finally, many risk factors commonly included in other risk assessments (e.g. FC, 6MWD, and NT-proBNP/BNP levels,) are not available in claims data, as they require physicians’ assessments and laboratory tests. An advantage of the risk assessments developed in this study is that they rely solely on information available in claims data, which could facilitate their application on a large scale by payers or quality-of-care organizations.
Potential applications
The full algorithm and simplified risk score developed in this study could have interesting applications in clinical practice, especially in light of the potential benefits associated with earlier combination therapy among higher-risk patients. In particular, the 2015 ESC/ERS guidelines and the 6th WSPH proceedings recommend initial or upfront PPA-based combination therapy for treatment-naïve patients deemed at high risk of 1-year mortalityCitation1,Citation19. For patients with an intermediate risk status who are already being treated with a combination of PAH-specific PDE5i and ERA, these guidelines advise escalation to triple therapy by the addition of an oral or parenteral PPACitation1,Citation19.
The full algorithm and simplified risk score could be adapted to the specific needs and capabilities of different end-users in the healthcare system. For instance, the full algorithm could be used by organizations on a large scale to track temporal changes in risk levels in the patient population. A case in point would be the integration of the full algorithm into an automated warning system, which healthcare payers could use to detect when a patient’s predicted time to unsatisfactory response falls below a certain value. Alternatively, the simplified risk score could enable clinicians to readily discern who may be a plausible candidate for further monitoring and/or treatment escalation. In particular, patients deemed at higher risk could benefit from more frequent monitoring of clinical outcomes that are not routinely available, such as FC, 6MWD, NT-proBNP/BNP levels, and measures of hemodynamics and pulmonary function, which are in turn useful for determining the severity of PAHCitation1. shows examples of risk scores for hypothetical patients. For example, a patient who has been treated for 5 months with a limited number of PAH-related outpatient visits and no hospitalizations in the past 12 months would be deemed at low risk of an unsatisfactory response, despite having dyspnea (Case 1). In contrast, a patient who has been treated for only one month and has required frequent PAH-related outpatient care and hospitalizations in the past 12 months would be identified as having a high risk of unsatisfactory response (Case 3).
Table 5. Predicted risk of an unsatisfactory response for hypothetical patient profiles.
Strengths and limitations
The present study has several methodological strengths. Notably, the use of machine learning, and specifically random survival forests, provides a number of advantages over regression-based approaches for risk prediction. First, the random survival forest algorithm is independent of specific functional form assumptionsCitation30. Second, in the case of high dimensional data, limitations of regression approaches such as overfitting, inflated standard errors, or convergence problems are less likely to arise when using random survival forestsCitation29. Third, random survival forests are naturally robust to outliers because predictors enter the model only ordinally; for a given observation, once the observation has the highest value in the sample of a particular predictor, further increases in the value will have no effect on the model predictionCitation40.
The present study should also be viewed in the context of certain limitations. The study outcome and risk factors were identified based on information derived from health insurance claims data, which may have been subject to misclassification errors or omissions. For instance, an ICD-9/ICD-10 diagnosis code on a medical claim is not an attestation that the patient had the diagnosis, as it may have been recorded incorrectly or represent a ruled-out diagnosis. Moreover, information regarding certain potentially important predictors of unsatisfactory response (e.g. FC, 6MWD, NT-proBNP/BNP plasma level) are not available in claims data, which may have limited the predictive accuracy of the algorithm developed. In addition, although the algorithm is predictive of unsatisfactory response, many of the risk factors identified suggest that patients with more severe comorbidity profiles are at greater risk; future studies focused on patients presenting certain comorbidities would be helpful in identifying any additional risk factors within specific subpopulations. Another limitation of this study was that the index regimen was defined based on PAH treatment initiated within a 60-day window after the index date. While this specific time window was selected based on the distribution of the data from our study sample (with most patients receiving a new PAH-specific regimen within 60 days), it is possible that early unsatisfactory response to certain medications might not have been fully captured. Furthermore, the algorithm predictions at longer duration post-index should be interpreted with caution given that a limited number of patients had an at-risk period of such duration. Finally, the present study population was commercially insured and, therefore, it may not be representative of the overall population of patients with PAH; external validation in different databases is warranted to confirm the generalizability of the current risk score to other populations. Finally, findings from this study may be interpreted as measures of association; however, no causal inference can be drawn from this analysis.
Conclusions
The present study used machine learning to develop and validate a health insurance claims-based algorithm for predicting the time to unsatisfactory response among patients following initial PAH therapy with a PDE5i or ERA. The algorithm reliably discriminated between patients based on their risk of unsatisfactory response following the initiation of PAH-specific therapy. In clinical practice, healthcare providers could utilize a simplified risk score derived from this algorithm to identify higher-risk patients with PAH who may require further confirmation with other risk score assessments or other monitoring tools. The timely identification of these patients could enable early interventions, particularly with combination therapy, which may help to mitigate the risk of an unsatisfactory response, reduce hospitalizations, and improve prognosis.
Transparency
Declaration of funding
This work was supported by Janssen Scientific Affairs, LLC. (Grant number: N/A).
Declaration of financial/other relationships
Janssen Scientific Affairs, LLC sponsored this study. Yuen Tsang, Peter Agron, Karimah S. Bell Lynum, and Sumeet Panjabi are employees of Janssen Scientific Affairs, LLC and may own stocks. Marjolaine Gauthier-Loiselle, Patrick Lefebvre, and Jimmy Royer are employees of Analysis Group, Inc., and Lucas Bennett is a former employee of Analysis Group, Inc., which has received consultancy fees from Janssen Scientific Affairs, LLC for the conduct of this study. The study sponsor was involved in all aspects of the research, including the collection of data, its analysis and interpretation, and approval of the final manuscript for publication. Peer reviewers on this manuscript have no relevant financial or other relationships to disclose.
Author contributions
All authors participated in the design of the study, data interpretation, and critically revised the intellectual content of this manuscript. Marjolaine Gauthier-Loiselle, Patrick Lefebvre, Jimmy Royer, and Lucas Bennett participated in the data analysis. All authors approved the final manuscript.
Supplemental Material
Download MS Word (65.8 KB)Acknowledgements
The authors would like to thank Emma Russon, who is a former employee of Analysis Group, Inc., for her contribution to the development of the algorithm. The authors would also like to thank Tom Cornwall, who is currently employed at Analysis Group, Inc., for his contributions to data analysis and interpretation. Medical writing assistance was provided by Mona Lisa Chanda, PhD, an employee of Analysis Group, Inc. Funding for this assistance was provided by Janssen Scientific Affairs, LLC.
Data availability statement
The data that support the findings of this study are available from Optum, but restrictions apply to the availability of these data, which were used under license for the current study, and so are not publicly available. Any researchers interested in obtaining the data used in this study can access database through Optum, under a license agreement, including the payment of appropriate license fee.
Notes
i Optum Clinformatics is a registered trademark of OptumInsight Life Sciences, Inc., Eden Prairie, MN, USA.
ii While interaction terms can be added to a Cox regression model, the difficulty arises from high dimensionality. Accommodating all two-way interactions requires k2 parameters, while all three way-interactions requires approximately k3, and so on. The number of parameters very quickly exceeds the number of observations, such that the model cannot be properly estimated.
iii For the development of such algorithms, 500 trees are often used due to the marginal improvement in performance observed with an increasing number of trees and for computational burden considerations. Based on the literature, 128 trees are presumed to be sufficient (e.g. Oshiro, Thais Mayumi, Pedro Santoro Perez, and José Augusto Baranauskas. "How many trees in a random forest?" International workshop on machine learning and data mining in pattern recognition. Springer, Berlin, Heidelberg, 2012).
Related Research Data
References
- Galie N, Humbert M, Vachiery JL, et al. ESC/ERS guidelines for the diagnosis and treatment of pulmonary hypertension: the joint task force for the diagnosis and treatment of pulmonary hypertension of the European Society of Cardiology (ESC) and the European Respiratory Society (ERS): endorsed by: association for European Paediatric and Congenital Cardiology (AEPC), International Society for Heart and Lung Transplantation (ISHLT). Eur Respir J. 2015;46(4):903–975.
- Beshay S, Sahay S, Humbert M. Evaluation and management of pulmonary arterial hypertension. Respir Med. 2020;171:106099.
- Simonneau G, Montani D, Celermajer DS, et al. Haemodynamic definitions and updated clinical classification of pulmonary hypertension. Eur Respir J. 2019;53(1):1801913. Jan
- Farber HW, Miller DP, Poms AD, et al. Five-year outcomes of patients enrolled in the REVEAL Registry. Chest. 2015;148(4):1043–1054.
- Thenappan T, Ormiston ML, Ryan JJ, et al. Pulmonary arterial hypertension: pathogenesis and clinical management. BMJ. 2018;360:j5492.
- Frost AE, Badesch DB, Barst RJ, et al. The changing picture of patients with pulmonary arterial hypertension in the United States: how REVEAL differs from historic and non-US contemporary registries. Chest. 2011;139(1):128–137.
- Taichman DB, Shin J, Hud L, et al. Health-related quality of life in patients with pulmonary arterial hypertension. Respir Res. 2005;6(1):92.
- Kim D, George MP. Pulmonary hypertension. Med Clin North Am. 2019;103(3):413–423.
- Vachiery JL, Yerly P, Huez S. How to detect disease progression in pulmonary arterial hypertension. Eur Respir Rev. 2012;21(123):40–47.
- Hill NS, Cawley MJ, Heggen-Peay CL. New therapeutic paradigms and guidelines in the management of pulmonary arterial hypertension. J Manag Care Spec Pharm. 2016;22(3 Suppl A):S3–S21. Mar
- Levine DJ. Pulmonary arterial hypertension: updates in epidemiology and evaluation of patients. Am J Manag Care. 2021;27(3 Suppl):S35–S41.
- Farber HW, Loscalzo J. Pulmonary arterial hypertension. N Engl J Med. 2004;351(16):1655–1665.
- Thenappan T, Shah SJ, Rich S, et al. Survival in pulmonary arterial hypertension: a reappraisal of the NIH risk stratification equation. Eur Respir J. 2010;35(5):1079–1087.
- Galie N, Channick RN, Frantz RP, et al. Risk stratification and medical therapy of pulmonary arterial hypertension. Eur Respir J. 2019;53(1):1801889.
- McLaughlin VV, Channick R, De Marco T, et al. Results of an expert consensus survey on the treatment of pulmonary arterial hypertension with oral prostacyclin pathway agents. Chest. 2020;157(4):955–965.
- Fox BD, Shtraichman O, Langleben D, et al. Combination therapy for pulmonary arterial hypertension: a systematic review and meta-analysis. Can J Cardiol. 2016;32(12):1520–1530.
- Lajoie AC, Lauziere G, Lega JC, et al. Combination therapy versus monotherapy for pulmonary arterial hypertension: a meta-analysis. Lancet Respir Med. 2016;4(4):291–305.
- Klinger JR, Elliott CG, Levine DJ, et al. Therapy for pulmonary arterial hypertension in adults: update of the CHEST guideline and expert panel report. Chest. 2019;155(3):565–586.
- Galie N, McLaughlin VV, Rubin LJ, et al. An overview of the 6th world symposium on pulmonary hypertension. Eur Respir J. 2019;53(1):1802148.
- Benza RL, Kanwar MK, Raina A, et al. Development and validation of an abridged version of the REVEAL 2.0 risk score calculator, REVEAL lite 2, for use in patients with pulmonary arterial hypertension. Chest. 2021;159(1):337–346.
- Hoeper MM, Kramer T, Pan Z, et al. Mortality in pulmonary arterial hypertension: prediction by the 2015 European pulmonary hypertension guidelines risk stratification model. Eur Respir J. 2017;50(2):1700740.
- Kylhammar D, Kjellstrom B, Hjalmarsson C, et al. A comprehensive risk stratification at early follow-up determines prognosis in pulmonary arterial hypertension. Eur Heart J. 2018;39(47):4175–4181.
- Boucly A, Weatherald J, Savale L, et al. Risk assessment, prognosis and guideline implementation in pulmonary arterial hypertension. Eur Respir J. 2017;50(2):1700889.
- Kanwar MK, Gomberg-Maitland M, Hoeper M, et al. Risk stratification in pulmonary arterial hypertension using bayesian analysis. Eur Respir J. 2020;56(2):2000008.
- Benza RL, Gomberg-Maitland M, Elliott CG, et al. Predicting survival in patients with pulmonary arterial hypertension: the REVEAL risk score calculator 2.0 and comparison with ESC/ERS-Based risk assessment strategies. Chest. 2019;156(2):323–337.
- Benza R, Miller DP, Gomberg-Maitland M, et al. Predicting survival in pulmonary arterial hypertension: insights from the registry to evaluate early and long-term pulmonary arterial hypertension disease management (REVEAL). Circulation. 2010;122(2):164–172.
- Simons JE, Mann EB, Pierozynski A. Assessment of risk of disease progression in pulmonary arterial hypertension: insights from an international survey of clinical practice. Adv Ther. 2019;36(9):2351–2363.
- Ishwaran H, Kogalur UB, Blackstone EH, et al. Random survival forests. Ann Appl Stat. 2008;2(3):841–860.
- Dietrich S, Floegel A, Troll M, et al. Random survival forest in practice: a method for modelling complex metabolomics data in time to event analysis. Int J Epidemiol. 2016;45(5):1406–1420.
- Wang H, Li G. A selective review on random survival forests for high dimensional data. Quant Biosci. 2017;36(2):85–96.
- Schmid M, Wright MN, Ziegler A. On the use of Harrell’s C for clinical risk prediction via random survival forests. Expert Syst Appl. 2016;63:450–459.
- Steyerberg EW, Harrell FE Jr, Borsboom GJ, et al. Internal validation of predictive models: efficiency of some procedures for logistic regression analysis. J Clin Epidemiol. 2001;54(8):774–781.
- Frost AE, Badesch DB, Miller DP, et al. Evaluation of the predictive value of a clinical worsening definition using 2-year outcomes in patients with pulmonary arterial hypertension: a REVEAL registry analysis. Chest. 2013;144(5):1521–1529.
- Sitbon O, Channick R, Chin KM, et al. Selexipag for the treatment of pulmonary arterial hypertension. N Engl J Med. 2015;373(26):2522–2533.
- McLaughlin VV, Hoeper MM, Channick RN, et al. Pulmonary arterial hypertension-related morbidity is prognostic for mortality. J Am Coll Cardiol. 2018;71(7):752–763.
- Strange G, Gabbay E, Kermeen F, et al. Time from symptoms to definitive diagnosis of idiopathic pulmonary arterial hypertension: the delay study. Pulm Circ. 2013;3(1):89–94.
- Vachiery JL, Gaine S. Challenges in the diagnosis and treatment of pulmonary arterial hypertension. Eur Respir Rev. 2012;21(126):313–320.
- Poms AD, Turner M, Farber HW, et al. Comorbid conditions and outcomes in patients with pulmonary arterial hypertension: a REVEAL registry analysis. Chest. 2013;144(1):169–176.
- Olschewski H, Behr J, Bremer H, et al. Pulmonary hypertension due to lung diseases: updated recommendations from the cologne consensus conference 2018. Int J Cardiol. 2018;272S:63–68.
- Questier F, Put R, Coomans D, et al. The use of CART and multivariate regression trees for supervised and unsupervised feature selection. Chemometrics and Intelligent Laboratory Systems. 2005;76(1):45–54.
- Quan H, Li B, Couris CM, et al. Updating and validating the Charlson comorbidity index and score for risk adjustment in hospital discharge abstracts using data from 6 countries. Am J Epidemiol. 2011;173(6):676–682.