
Abstract
Objectives
To evaluate incidence of stroke, myocardial infarction (MI), and peripheral artery disease (PAD) in patients with type 2 diabetes mellitus (T2DM) and assess associated health care resource utilization (HCRU) and costs in the United States.
Methods
Patients ≥18 years of age with a T2DM diagnosis, with or without incident stroke/MI/PAD, were indexed between 1 January 2012 and 31 December 2020, from the deidentified Optum Clinformatics Data Mart claims database. Incidence of stroke, MI, and PAD was evaluated in the year following T2DM. HCRU and costs were measured in the 12 months following study entry in patients with T2DM + stroke, T2DM + MI, and T2DM + PAD (experimental cohorts) and compared to HCRU and costs in patients with T2DM alone (control cohorts).
Results
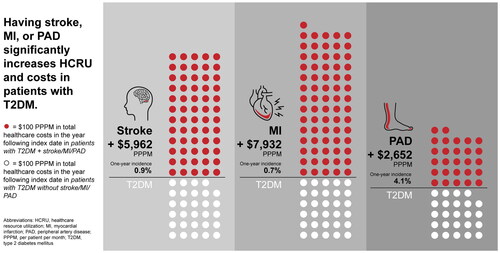
Incidence of stroke, MI, and PAD in patients with T2DM was 0.9% (n = 16,034), 0.7% (n = 13,681), and 4.1% (n = 68,479), respectively. Compared to matched patients with T2DM alone, patients with T2DM + stroke/MI/PAD had significantly higher total healthcare costs in the year post-index date (T2DM + stroke: +$5962 per patient per month [PPPM]; T2DM + MI: +$7932 PPPM; T2DM + PAD: +$2652 PPPM; p < .05). Patients with T2DM + stroke/MI/PAD had significantly higher mean HCRU than patients without stroke/MI/PAD in all categories measured.
Conclusion
Having stroke, MI, or PAD was associated with increases in HCRU and costs in patients with T2DM. Although PAD was associated with smaller per patient increases in total healthcare costs than patients with T2DM + stroke/MI, the higher frequency of incident PAD may make it more costly than MI or stroke in a large population of patients with T2DM.
Graphical Abstract
PLAIN LANGUAGE SUMMARY
Compared to patients without type 2 diabetes (T2D), patients with T2D have a greater chance of having a stroke, heart attack, and narrowing of blood vessels in the arms and legs (peripheral artery disease [PAD]). A stroke, heart attack, or PAD may lead to hospitalization or death. We sought to understand healthcare usage (hospital visits, emergency room visits, office visits, etc.) and costs associated with stroke, heart attack, and PAD in patients with T2D in the United States. Healthcare resource usage and costs were estimated by using data from health insurance claims to compare healthcare usage and costs among patients with T2D, some of whom had a stroke, heart attack, or PAD, and some who did not. Compared to patients with T2D without stroke/heart attack/PAD, patients with T2D and stroke/heart attack/PAD had more overnight hospital visits, doctors’ office visits, and emergency room visits. Patients with T2D and stroke/heart attack/PAD also had longer hospital stays. Patients with T2D and stroke/heart attack/PAD all had higher total healthcare costs in the year following their diagnoses, compared to patients with T2D without stroke/heart attack/PAD. By highlighting the greater costs and use of healthcare associated with stroke, heart attack, and PAD in patients with T2D, we hope to encourage more preventative management of stroke, heart attack, and PAD in patients with T2D.
Introduction
Type 2 diabetes mellitus (T2DM) is a metabolic disease characterized by insulin resistance and defective insulin secretion leading to hyperglycemiaCitation1. T2DM affects ∼8.9% of the United States (US) populationCitation2. The global prevalence of diabetes increased from 211 million in 1990 to 476 million in 2017Citation3. In 2017, over one million deaths were attributed to T2DM making it the ninth leading cause of mortality globallyCitation2. By 2050, ∼1 in 3 people in the US may have T2DMCitation4.
Cardiovascular disease (CVD) is estimated to affect over 30% of patients with T2DMCitation5. The American Diabetes Association (ADA) estimated in 2017 that T2DM cost the US $237 billion in direct medical costs, $37.3 billion of which were cardiovascular-relatedCitation6.
Several studies have evaluated healthcare resource utilization and/or costs associated with cardiovascular comorbidities in patients with T2DM. Mehta et al. found that patients with T2DM and select cardiovascular diseases (stroke, transient ischemic attack [TIA], myocardial infarction [MI], unstable angina, and coronary revascularization) had significantly greater healthcare resource utilization and higher costs than patients with T2DM aloneCitation7. Weng et al. also observed significantly higher healthcare costs for patients with T2DM and atherosclerotic cardiovascular disease (ASCVD) compared to patients with T2DM aloneCitation8. ASCVD was defined as acute coronary syndromes, a history of MI, stable or unstable angina, coronary or other arterial revascularization, stroke, TIA, or peripheral artery disease (PAD) presumed to be of atherosclerotic originCitation9.
Although previous studies have evaluated the burden and cost of major adverse cardiovascular events in patients with T2DM, some did not include PADCitation7,Citation10. PAD has been identified as a significant cardiovascular event in patients with T2DMCitation11. Weng et al. included patients with PAD but only examined outcomes for patients with ASCVD as a group.
Between 30 and 50% of US adults with T2DM do not meet recommended glycemic control, blood pressure, or LDL cholesterol targets for the prevention of CVDCitation12. Using data from a US commercial insurance claims database, we aimed to assess the 12-month prevalence, incidence, mean healthcare resource utilization, and mean cost of stroke, MI, and PAD in adults with T2DM compared to adults with T2DM alone. By quantifying the costs and healthcare resource burden associated with stroke, MI, and PAD in patients with T2DM, we hope to encourage greater preventative action.
Methods
Data source
A retrospective cohort analysis was performed using deidentified data from the Optum Clinformatics Data MartFootnotei (CDM) database for patients in the US. The CDM includes medical and pharmacy claims data for individuals insured by United Healthcare Group. Institutional Review Board approval was not sought as this study is a retrospective analysis; there were no patient interventions, and all patient data were anonymized in accordance with the Health Insurance Portability and Accountability Act.
Study design
Eligible adults with a T2DM-related International Classification of Diseases, Ninth or Tenth Revision, Clinical Modification (ICD-9, ICD-10-CM) diagnosis code aged ≥18 years were identified between 1 January 2012 and 31 December 2020 ().
Figure 1. Study design. Abbreviations. Dx, diagnosis; CV, cardiovascular event; T2DM, type 2 diabetes mellitus. The centering period is defined as 12 months before and after evidence of a random T2DM-related diagnosis. A random diagnosis date is used as the study entry point to avoid overweighting earlier timeframes from the long identification period and a potential selection bias toward newly diagnosed patients with diabetes from the required 12-month pre-centering period.
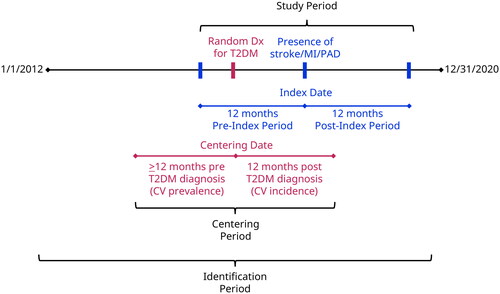
The centering period is defined as 12 months before and after evidence of a random T2DM-related diagnosis. A random diagnosis date is used as the study entry point to avoid overweighting earlier timeframes from the long identification period and a potential selection bias toward newly diagnosed patients with diabetes from the required 12-month pre-centering period.
The index date was set at the first diagnosis of stroke, MI, or PAD. The patient may have had a diagnosis of stroke, MI, or PAD before the 12-month pre-index (baseline) period; however, to reduce selection bias and to focus on the objective of understanding the impact of stroke, MI, and PAD events in patients with T2DM, the study design only excluded patients with a cardiovascular event in the baseline period. Index event for stroke was defined as hospitalization with a primary diagnosis code for hemorrhagic stroke or ischemic strokeCitation13. Index event for MI was defined as hospitalization with a primary diagnosis code for MI, ST-segment-elevation myocardial infarction (STEMI), or non-ST-segment-elevation myocardial infarction (NSTEMI)Citation14. Index event for PAD was defined as ≥1 hospitalization with a diagnosis code (any position) of atherosclerosis or thrombosis of arteries of the lower extremities, or ≥2 physician evaluation and management visits with a diagnosis code (any position) of atherosclerosis or thrombosis of arteries of the lower extremities on separate days, or ≥1 hospitalization or physician visit with a Current Procedural Terminology code of 37205 or 75962Citation15. For the control cohorts (patients with T2DM without stroke/MI/PAD), patients had a random index date set, drawn from the time between the centering date and index date of patients with a stroke, MI, and PAD event. Due to the control populations containing >1 million patients, 250,000 control patients were randomly selected to reduce computational load.
Study population
To be included in prevalence estimates, patients needed to be ≥18 years of age and have healthcare coverage for the 12 months before and 12 months after random T2DM-related ICD-9 or ICD-10-CM diagnosis code. Patients were excluded from the overall analysis if they had type 1 diabetes mellitus, pregnancy, or gestational diabetes in the 12 months before and/or 12 months after indexing. Patients with T2DM and incident stroke/MI/PAD were excluded from further analysis if they did not have 360 days of follow-up after the cardiovascular index event.
The populations of patients with T2DM and incident stroke/MI/PAD were compared to matched control populations of patients with T2DM without incident ASCVD to determine healthcare resource utilization and cost associated with stroke/MI/PAD in patients with T2DM. Three pairs of cohorts were examined: T2DM + stroke and T2DM-stroke cohorts, T2DM + MI and T2DM-MI cohorts, and T2DM + PAD and T2DM-PAD cohorts.
Study measures
Patients’ baseline demographic data were based on their enrollment file details on the index date. Comorbidities were assessed in the year before the index date and Charlson Comorbidity Index scores were calculated. The Charlson Comorbidity Index is a predictor of 10-year survival and factors in patient age and comorbiditiesCitation16.
This study evaluated the prevalence and incidence of stroke, MI, and PAD in patients with T2DM. Prevalence of ASCVD was evaluated in the 12 months before T2DM diagnosis while the incidence of ASCVD was evaluated in the 12 months following T2DM diagnosis. Patients with T2DM were included in the incidence cohort at first diagnosis of stroke, MI, or PAD. Health care resource utilization and associated costs were assessed for all patients with 12 months of follow-up post-index date.
Cohorts were compared by evaluation of mean healthcare resource utilization and mean healthcare costs in the 12 months following random T2DM-related index event (for the control cohort) and the 12 months following ASCVD index event (for the experimental [T2DM + stroke, T2DM + MI, and T2DM + PAD] cohorts). Mean health care resource utilization values were calculated for the number of inpatient visits, inpatient length of stay, number of outpatient visits, and number of emergency room visits. Mean all-cause healthcare costs were calculated for inpatient, outpatient, emergency room, pharmacy, and total healthcare costs.
Statistical analysis
All statistical analyses were performed using R 3.6.0/4.0.3. All analyses were conducted as two-sided tests with an alpha of 0.05 unless otherwise stated; no adjustments were made for multiple comparisons. Missing data was not imputed. Two-sample t-tests were used to assess absolute differences in means between cohorts. Poisson tests were used to assess relative differences (adjusted rate ratios) between cohorts.
Before cohort comparisons, cohorts were balanced using an inverse probability of treatment weighting (IPTW) approachCitation17,Citation18. IPTW was used to account for differences in baseline demographic and clinical characteristics among patients with T2D and those with stroke, MI, or PAD. IPTW is defined as the inverse of the estimated propensity score for experimental cohort patients and the inverse of one minus the estimated propensity score for control cohort patients. A pseudo-population was created where the weighted experimental and control groups were representative of the patient characteristics in the overall study population, resulting in estimates that were generalizable to the entire study population.
Propensity scores were calculated using a logistic regression model for each experimental/control cohort pair in which the dependent variable was the experimental group with stroke, MI, or PAD. Explanatory variables were selected based on their hypothesized confounding relationship with the outcome variable in a directed acyclic graph. Propensity scores were calculated as the predicted probability of having a stroke, MI, or PAD.
To estimate the IPTW, the predicted probabilities of each patient being in the incident cohort were used to generate stabilized IPTW scores using ATT (average treatment effect on the treated) weights and were applied to the data to generate a reweighted pseudo-populationCitation19. Standardized differences were compared to assess the balance between the experimental cohorts. Each control cohort was balanced against its respective experimental cohort using their respective weights.
Results
Patient population
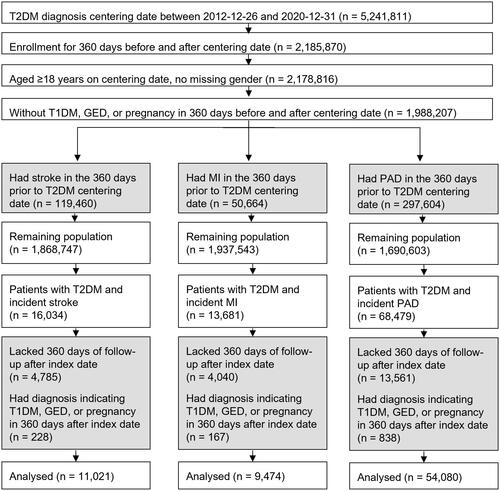
Among the 5,241,811 patients with T2DM in the CDM database, 11,021 were included in the T2DM + stroke cohort, 9474 in the T2DM + MI cohort, and 54,080 in the T2DM + PAD cohort (). For each experimental cohort depicted in , there was a matched control cohort consisting of patients with T2DM without incident stroke (n = 1,421,500), MI (n = 1,475,011), or PAD (n = 1,312,835). These populations were randomly restricted to 250,000 to reduce computational load.
Figure 2. Flow chart of patient populations included in cohort analyses. Grey boxes indicate patients excluded from further analysis. White boxes indicate the population remaining for analysis. Abbreviations. GED, gestational diabetes; MI, myocardial infarction; PAD, peripheral artery disease; T1DM, type 1 diabetes mellitus; T2DM, type 2 diabetes mellitus.
Patient baseline characteristics
Demographic characteristics of the study population are displayed in . At baseline, patients had an adjusted mean age of 75.1 years in the T2DM + stroke cohort (75.2 years in the matched control cohort), 73.6 years in the T2DM + MI cohort (73.7 years in the matched control cohort), and 74.0 years in the T2DM + PAD cohort (74.2 years in the matched control cohort). The adjusted mean Charlson Comorbidity Index at baseline was 4.6 for the T2DM + stroke cohort (4.7 for matched controls), 4.6 for the T2DM + MI cohort (4.7 for matched controls), and 3.9 for the T2DM + PAD cohort (4.0 for matched controls). In the T2DM + stroke cohort, 85% of patients had an ischemic stroke (n = 9415), 11% had a hemorrhagic stroke (n = 1167), and 4% had TIA (n = 439). In the T2DM + MI cohort, 55% had NSTEMI (n = 5214) while 45% had STEMI (n = 4260). Additional patient baseline characteristics, both adjusted and unadjusted, are supplied in the Supplementary Materials (Tables S1 and S2).
Table 1. Patient baseline characteristics after statistical adjustment.
Prevalence and incidence of stroke, MI, and PAD in patients with T2DM
In the 360 days before the patient centering date, stroke was prevalent in 6.0% of patients (n = 119,460), MI was prevalent in 2.6% of patients (n = 50,664), and PAD was prevalent in 15.0% of patients (n = 297,604). In the 360 days following the patient centering date, stroke was incident in 0.9% of patients (n = 16,034), MI was incident in 0.7% of patients (n = 13,681), and PAD was incident in 4.1% of patients (n = 68,479).
Healthcare resource utilization and cost associated with stroke in patients with T2DM
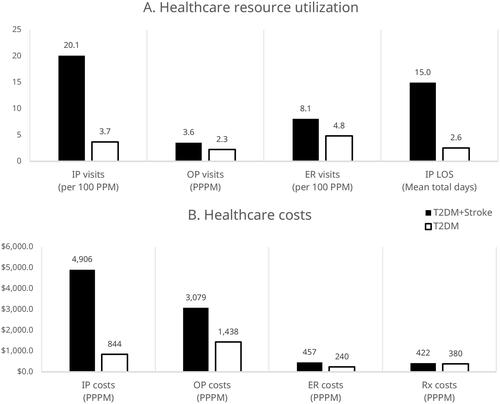
Compared to patients with T2DM alone, patients with T2DM + stroke had significantly more inpatient visits (adjusted rate ratio [ARR]: 5.42; 95% CI: 5.26–5.59; p < .001), outpatient visits (ARR: 1.58; 95% CI: 1.57–1.58; p < .001), and emergency room (ER) visits (ARR: 1.67; 95% CI: 1.62–1.72; p < .001). Patients with T2DM + stroke also spent significantly more days in inpatient care (ARR: 5.86; 95% CI: 5.79–5.94; p < .001) than patients with T2DM alone (). Mean total healthcare costs were significantly higher for patients with T2DM + stroke compared to patients with T2DM alone ($8864 per patient per month [PPPM] vs. $2902 PPPM; p < .001). The largest differences were seen in inpatient and outpatient costs (). Per 1 million patients with T2DM, we estimate patients with T2DM and incident stroke would have a total of $615 million higher initial annual costs than those with T2DM alone. Unadjusted values are provided in Supplementary Figure S1.
Figure 3. (A) All-cause healthcare resource utilization and (B) costs in patients with T2DM in the year following incident stroke (n = 11,021) or random T2DM diagnosis (n = 11,101). These outcomes are adjusted for clinical and demographic characteristics. The predicted probabilities of each patient being in the incident cohort were used to generate stabilized IPTW (inverse probability of treatment weighting) scores using ATT (average treatment effect on the treated) weights and were applied to the control cohort data to generate a reweighted pseudo-population. All differences are significant with a p-value <.05. Abbreviations. ER, emergency room; IP, inpatient; LOS, length of stay; OP, outpatient; PPM, patients per month; PPPM, per patient per month; Rx, pharmacy costs.
Healthcare resource utilization and cost associated with MI in patients with T2DM
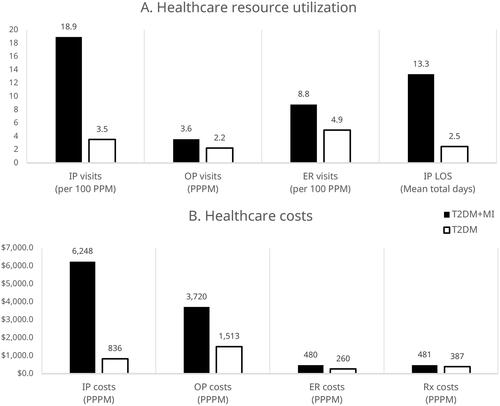
Compared to patients with T2DM alone, patients with T2DM + MI had significantly more inpatient visits (ARR: 5.36; 95% CI: 5.18–5.55; p < .001), outpatient visits (ARR: 1.61; 95% CI: 1.61–1.62; p < .001), and ER visits (ARR: 1.78; 95% CI: 1.72–1.84; p < .001). Patients with T2DM + MI also spent significantly more days in inpatient care (ARR: 5.42; 95% CI: 5.35–5.50; p < .001) than patients with T2DM alone (). Mean total healthcare costs were significantly higher for patients with T2DM + MI compared to patients with T2DM alone ($10,929 PPPM vs. $2997 PPPM; p < .001) (). Per 1 million patients with T2DM, we estimate patients with T2DM and incident MI would have a total of $676 million higher initial annual costs than those with T2DM alone. Unadjusted values are provided in Supplementary Figure S2.
Figure 4. (A) All-cause healthcare resource utilization and (B) costs within one year in patients with T2DM following incident MI (n = 9474) or random T2DM diagnosis (n = 9536). These outcomes are adjusted for clinical and demographic characteristics. The predicted probabilities of each patient being in the incident cohort were used to generate stabilized IPTW (inverse probability of treatment weighting) scores using ATT (average treatment effect on the treated) weights and were applied to the control cohort data to generate a reweighted pseudo-population. All differences are significant with a p-value <.05. Abbreviations. ER, emergency room; IP, inpatient; LOS, length of stay; MI, myocardial infarction; OP, outpatient; PPM, patients per month; PPPM, per patient per month; Rx, pharmacy costs; T2DM, type 2 diabetes mellitus.
Healthcare resource utilization and cost associated with PAD in patients with T2DM
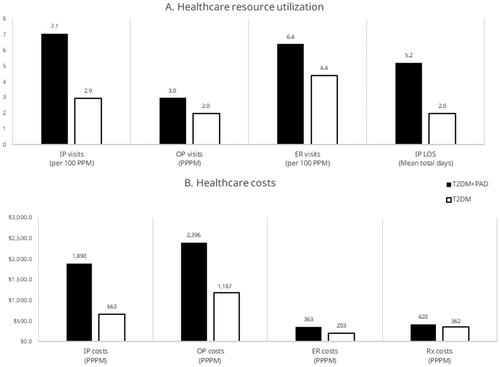
Compared to patients with T2DM alone, patients with T2DM + PAD had significantly more inpatient visits (ARR: 2.40; 95% CI: 2.36–2.44; p < .001), outpatient visits (ARR: 1.51; 95% CI: 1.51–1.51; p < .001), and ER visits (ARR: 1.45; 95% CI: 1.43–1.48; p < .001). Patients with T2DM + PAD also spent significantly more days in inpatient care (ARR: 2.64; 95% CI: 2.62–2.65; p < .001) than patients with T2DM alone (). Mean total healthcare costs were significantly higher for patients with T2DM + PAD compared to patients with T2DM alone ($5068 PPPM vs. $2416 PPPM; p < .001) (). Per 1 million patients with T2DM, we estimate patients with T2DM and incident PAD would have a total of $1.3 billion higher initial annual costs than those with T2DM alone. Unadjusted values are provided in Supplementary Figure S3.
Figure 5. (A) All-cause healthcare resource utilization and (B) costs in patients with T2DM in the year following incident PAD (n = 54,080) or random T2DM diagnosis (n = 54,758). These outcomes are adjusted for clinical and demographic characteristics. The predicted probabilities of each patient being in the incident cohort were used to generate stabilized IPTW (inverse probability of treatment weighting) scores using ATT (average treatment effect on the treated) weights and were applied to the control cohort data to generate a reweighted pseudo-population. All differences are significant with a p-value <.05. Abbreviations. ER, emergency room; IP, inpatient; LOS, length of stay; OP, outpatient; PAD, peripheral artery disease; PPM, patients per month; PPPM, per patient per month; Rx, pharmacy costs; T2DM, type 2 diabetes mellitus.
Discussion
Patients with T2DM are at increased risk of CVDCitation11. CVD is associated with significant increases in healthcare resource utilization and costs in patients with T2DMCitation7,Citation8. Nevertheless, previous studies highlight a need for updated estimates of prevalence, incidence, healthcare resource utilization, and costs associated with specific cardiovascular events in patients with T2DM.
In this study, we measured prevalence, incidence, healthcare resource utilization, and costs associated with stroke, MI, and PAD in patients with T2DM using a retrospective analysis of a commercial healthcare claims database. In the year before the patient centering date, we found stroke, MI, and PAD were prevalent in 6.0, 2.6, and 15.0% of patients with T2DM, respectively. Another retrospective study using the IBM MarketScanFootnoteii claims database found stroke, MI, and PAD were prevalent in 19, 7, and 25% of patients with T2DM, respectivelyCitation20. These findings may differ due to differences in methodology; our study only evaluated the prevalence of stroke, MI, and PAD in the year before indexing, whereas Weng et al. included patients with stroke, MI, or PAD at any point before indexing. A literature review of studies evaluating the prevalence of CVD in patients with T2DM between 2007 and 2017 did not include PAD but found stroke was prevalent in 8% of patients and MI in 10% of patients globallyCitation10.
We measured the one-year incidence of stroke, MI, and PAD in patients with T2DM in the year following the patient index and found incidences of 0.9, 0.7, and 4.1%, respectively. A retrospective study using electronic health data in England also investigated the incidence of CVD in patients with T2DM, however, the study only included adults aged ≥30 years who were free from CVD at baseline and measured the incidence of CVD during a median follow-up time of 5.5 yearsCitation21. The study found that the most common incidence of CVD in patients with T2DM was PADCitation21. Although our study only investigated stroke, MI, and PAD; our findings are similar and show that patients with T2DM most frequently experienced PAD.
Compared to patients with T2DM alone, we found that patients with T2DM and stroke, MI, or PAD had higher healthcare resource utilization and costs in every category measured. This generally corroborates the findings of previous retrospective analyses, which showed patients with T2DM and ASCVD/CVD had higher healthcare resource utilization across cost categoriesCitation7,Citation8. Our results differ from Mehta et al. with regards to inpatient costs. Mehta et al. found no significant difference in inpatient costs between patients with T2DM and CVD and those with T2DM without CVDCitation7. Conversely, we found inpatient costs were responsible for the greatest cost differences between patients with T2DM alone, and those with T2DM and stroke, MI, or PAD. Our study showed that patients with stroke, MI, and PAD had more inpatient visits and longer inpatient stays than patients without stroke, MI, and PAD. Mehta et al. found smaller increases in inpatient visits and inpatient lengths of stay associated with CVD in patients with T2DM, which could explain the correspondingly smaller increases in inpatient healthcare costsCitation7. Also, our study evaluated healthcare resource utilization and costs in the 12 months immediately following incident CVD, whereas Mehta et al. evaluated 12-month costs in patients with a history of CVD. Healthcare costs and utilization immediately after an incident of CVD may be higher than healthcare costs and utilization in the more distant future.
By combining incidence rates and per patient healthcare cost estimates, we determined that PAD is associated with the highest population-level healthcare costs in patients with T2DM when compared to stroke and MI in patients with T2DM. Despite being associated with lower per patient increases in total healthcare costs, PAD occurred much more frequently in patients with T2DM than did stroke and MI, which explains the higher population-level costs associated with PAD in patients with T2DM. The risk of PAD is higher and cardiovascular outcomes are worse in patients with T2DM than in those without T2DMCitation11. PAD is associated with an increased risk for major adverse limb events and amputation in patients with T2DM compared to those without T2DMCitation11,Citation22. Our findings suggest that medications that lower the risk of PAD could be prioritized over medications that lower the risk of stroke and MI in patients with T2DM to achieve the greatest population-level healthcare cost savings. However, this would also depend on drug costs and the relative effectiveness of drugs in reducing the risk of stroke, MI, and PAD in patients with T2DM.
There is a need for therapies that lower the risk of CVD in patients with T2DM. Trials investigating the effectiveness of sodium‐glucose co‐transporter‐2 inhibitors (SGLT2is) and glucagon-like peptide-1 receptor agonists (GLP-1 RAs) in reducing the risk of CVD in patients with T2DM have found promising resultsCitation23,Citation24. A meta-analysis of cardiovascular outcomes trials investigating the effects of GLP-1 RAs on CVD and safety in patients with T2DM showed GLP-1 RA treatment was associated with significant reductions in risk of major adverse cardiovascular events, cardiovascular mortality, all-cause mortality, fatal and nonfatal stroke, and heart failure hospitalization; no significant effect was seen in fatal or nonfatal MICitation25. A similar meta-analysis of trials investigating the effects of SGLT-2is in patients with T2DM demonstrated that SGLT-2is were associated with reduced risk of major adverse cardiovascular events but notable heterogeneity in associated risk of cardiovascular mortalityCitation26. The meta-analysis investigating SGLT-2is found mixed results regarding their effect on time to the first event of stroke; some trials even suggested a deleterious effect of SGLT-2is on stroke compared to placebo, though no findings were statistically significantCitation26. Trials have also investigated the effects of dipeptidyl peptidase-4 inhibitors (DPP-4is) on cardiovascular outcomes in patients with T2DM. A meta-analysis of DPP-4i trials in patients with T2DM found that DPP-4is did not increase the risk of hospitalization for heart failure in patients with T2DM and previous history of heart failure, but increased the risk of hospitalization for heart failure in patients without previous history of heart failureCitation27. These results suggest that GLP-1 RAs and SGLT-2is could be used to reduce cardiovascular events and, by extension, healthcare resource utilization and costs associated with cardiovascular events in patients with T2DM.
Limitations
This study is a database analysis that relies on the quality of the study inputs. Any errors in data input or relevant information missing from the database were not captured in this study. In establishing the experimental and control cohorts, we excluded any patients who had a cardiovascular comorbidity in the 12 months before the centering date. The presence of cardiovascular events beyond 12 months before the centering date was not explored and may have had an impact on the findings even if sequelae were not recorded in the study period. However, we expect the large sample sizes and matching process in this study to minimize the differential impact across the CVD event and control cohorts of these individuals.
This study includes data on individuals covered by commercial and Medicare part D insurance. The population of individuals covered by these health plans may have unique characteristics that limit the generalizability of the study results to other populations, such as the uninsured. This study does not include all conditions listed in the American College of Cardiology (ACC)/American Heart Association (AHA) guidelines for ASCVD. This may have led to the misclassification of cardiovascular conditions compared with ACC/AHA guidelines. There may be patients who had interactions with health care providers outside of the Optum network or used another payment method not captured in the claims database. Costs included in the database are imputed averages, not actually paid costs; this could affect the representation and generalizability of costs compared to actual real-world costs.
It is possible that some statistically significant differences may not be clinically relevant and may be related to the sample size, which is common in a large retrospective cohort study. The administrative claims database did not measure socioeconomic status which could be a confounding variable. Data was not collected at specific timepoints. Data was collected as part of routine clinical practice which could have introduced sampling bias.
Conclusions
Having a stroke, MI, or PAD in addition to T2DM was significantly associated with increased utilization of healthcare resources and healthcare costs over a one-year period. Treatments that lower the risk of stroke, MI, and/or PAD in patients with T2DM may lead to cost savings and improvements in clinical outcomes. Prevention of PAD in patients with T2DM may offer the greatest opportunity for cost savings (at a health plan population level) due to the higher frequency and total cost of PAD in the population studied. Further research is needed to investigate the cost-effectiveness of specific medication regimens for reducing the risk of stroke, MI, and PAD in patients with T2DM.
Transparency
Declaration of funding
This study was funded by Novo Nordisk, Inc. which had a role in the design, conduct, and reporting of the study.
Declaration of financial/other relationships
Aaron King: reports receiving consulting fees from Novo Nordisk and payment/honoraria for presentations from Novo Nordisk, Mannkind, Abbot, Medtronic, Eli Lilly, and Dexcom. Jigar Rajpura: employee and shareholder of Novo Nordisk, Inc. Yuanjie Liang: employee and shareholder of Novo Nordisk, Inc. Yurek Paprocki: employee and shareholder of Novo Nordisk, Inc. Chioma Uzoigwe: employee and shareholder of Novo Nordisk, Inc. Peer reviewers on this manuscript have no relevant financial or other relationships to disclose.
Author contributions
All authors were involved in the conception and design of the study. YL conducted the statistical analyses, and all authors were involved in the interpretation of the data. All authors were involved in the drafting of the paper and revised it critically for intellectual content. All authors have approved the final version of the manuscript and agree to be accountable for all aspects of the work.
T2DM_stroke_MI_PAD_supplemental.docx
Download MS Word (833.1 KB)Acknowledgements
The authors thank John Newman, Ph.D. and Rebecca Hahn, MPH of KJT Group, Inc. (Rochester, NY, USA) for medical writing support funded by Novo Nordisk, Inc. (Plainsboro, NJ, USA). Data in this manuscript has been previously presented by the same author group as posters at the American Diabetes Association’s (ADA) 82nd Scientific Sessions taking place 3–7 June 2022 and the corresponding abstracts will be published in Diabetes following the conference.
Data availability statement
No data are available. None of the participant (de-identified) data collected in the study can be shared.
Notes
i Optum Clinformatics, Eden Prairie, MN, USA.
ii IBM, Armonk, NY, USA.
References
- DeFronzo RA, Ferrannini E, Groop L, et al. Type 2 diabetes mellitus. Nat Rev Dis Primers. 2015;1(1):15019.
- Khan MAB, Hashim MJ, King JK, et al. Epidemiology of type 2 diabetes – global burden of disease and forecasted trends. J Epidemiol Glob Health. 2020;10(1):107–111.
- Lin X, Xu Y, Pan X, et al. Global, regional, and national burden and trend of diabetes in 195 countries and territories: an analysis from 1990 to 2025. Sci Rep. 2020;10(1):14790.
- Newman JD, Schwartzbard AZ, Weintraub HS, et al. Primary prevention of cardiovascular disease in diabetes mellitus. J Am Coll Cardiol. 2017;70(7):883–893.
- Visaria J, Iyer NN, Raval AD, et al. Healthcare costs of diabetes and microvascular and macrovascular disease in individuals with incident type 2 diabetes mellitus: a ten-year longitudinal study. CEOR. 2020;12:423–434.
- ADA. Economic costs of diabetes in the U.S. in 2017. Diabetes Care. 2018;41(5):917–928.
- Mehta S, Ghosh S, Sander S, et al. Differences in all-cause health care utilization and costs in a type 2 diabetes mellitus population with and without a history of cardiovascular disease. JMCP. 2018;24(3):280–290.
- Weng W, Tian Y, Kong SX, et al. Impact of atherosclerotic cardiovascular disease on healthcare resource utilization and costs in patients with type 2 diabetes mellitus in a real-world setting. Clin Diabetes Endocrinol. 2020;6:5.
- ADA. Cardiovascular disease and risk management. Diabetes Care. 2017;40(Supplement_1):S75–S87.
- Einarson TR, Acs A, Ludwig C, et al. Prevalence of cardiovascular disease in type 2 diabetes: a systematic literature review of scientific evidence from across the world in 2007–2017. Cardiovasc Diabetol. 2018;17(1):83.
- Jude EB, Oyibo SO, Chalmers N, et al. Peripheral arterial disease in diabetic and nondiabetic patients: a comparison of severity and outcome. Diabetes Care. 2001;24(8):1433–1437.
- Ali MK, Bullard KM, Saaddine JB, et al. Achievement of goals in U.S. diabetes care, 1999–2010. N Engl J Med. 2013;368(17):1613–1624.
- Deitelzweig S, Keshishian A, Kang A, et al. Effectiveness and safety of oral anticoagulants among NVAF patients with obesity: insights from the ARISTOPHANES study. J Clin Med. 2020;9(6):1633.
- Peters SAE, Colantonio LD, Dai Y, et al. Trends in recurrent coronary heart disease after myocardial infarction among US women and men between 2008 and 2017. Circulation. 2021;143(7):650–660.
- Colantonio LD, Hubbard D, Monda KL, et al. Atherosclerotic risk and statin use among patients with peripheral artery disease. J Am Coll Cardiol. 2020;76(3):251–264.
- Charlson ME, Pompei P, Ales KL, et al. A new method of classifying prognostic comorbidity in longitudinal studies: development and validation. J Chronic Dis. 1987;40(5):373–383.
- Bang H, Robins JM. Doubly robust estimation in missing data and causal inference models. Biometrics. 2005;61(4):962–973.
- Brookhart MA, Wyss R, Layton JB, et al. Propensity score methods for confounding control in nonexperimental research. Circ Cardiovasc Qual Outcomes. 2013;6(5):604–611.
- Austin PC, Stuart EA. Moving towards best practice when using inverse probability of treatment weighting (IPTW) using the propensity score to estimate causal treatment effects in observational studies. Stat Med. 2015;34(28):3661–3679.
- Weng W, Tian Y, Kong SX, et al. The prevalence of cardiovascular disease and antidiabetes treatment characteristics among a large type 2 diabetes population in the United States. Endocrinol Diabetes Metab. 2019;2(3):e00076.
- Shah AD, Langenberg C, Rapsomaniki E, et al. Type 2 diabetes and incidence of cardiovascular diseases: a cohort study in 1·9 million people. Lancet Diabetes Endocrinol. 2015;3(2):105–113.
- Weissler EH, Clare RM, Lokhnygina Y, et al. Predicting major adverse limb events in individuals with type 2 diabetes: insights from the EXSCEL trial. Diabet Med. 2021;38(10):e14552.
- Marso SP, Daniels GH, Brown-Frandsen K, et al. Liraglutide and cardiovascular outcomes in type 2 diabetes. N Engl J Med. 2016;375(4):311–322.
- Zinman B, Wanner C, Lachin JM, et al. Empagliflozin, cardiovascular outcomes, and mortality in type 2 diabetes. N Engl J Med. 2015;373(22):2117–2128.
- Marsico F, Paolillo S, Gargiulo P, et al. Effects of glucagon-like peptide-1 receptor agonists on major cardiovascular events in patients with type 2 diabetes mellitus with or without established cardiovascular disease: a meta-analysis of randomized controlled trials. Eur Heart J. 2020;41(35):3346–3358.
- McGuire DK, Shih WJ, Cosentino F, et al. Association of SGLT2 inhibitors with cardiovascular and kidney outcomes in patients with type 2 diabetes. JAMA Cardiol. 2021;6(2):148–158.
- Pan X, Xu S, Li J, et al. The effects of DPP-4 inhibitors, GLP-1RAs, and SGLT-2/1 inhibitors on heart failure outcomes in diabetic patients with and without heart failure history: insights from CVOTs and drug mechanism. Front Endocrinol. 2020;11:599355.