
Abstract
Objective
To determine the cut-off values of the serum anti-Müllerian hormone (AMH) concentration for different age groups (21–25, 26–30, 31–35 years) to diagnose polycystic ovary syndrome (PCOS).
Methods
In total, 187 women aged 21–35 years were included in this descriptive study. Patients diagnosed with PCOS according to the Rotterdam Criteria formed the PCOS group (n = 93), whereas those without symptoms related to PCOS formed the control group (n = 94). Follicular phase serum hormone concentrations were evaluated during the endocrinological assessment of patients with PCOS. Serum levels of estradiol, follicle-stimulating hormone (FSH), luteinizing hormone (LH), prolactin, total testosterone, dehydroepiandrosterone sulfate, sex hormone-binding globulin, androstenedione, and AMH were measured. The free androgen index and LH/FSH ratio were calculated. Cut-off values of serum AMH concentrations for the age groups were measured using receiver operating characteristic curve analysis.
Results
The prevalence rates of frank, ovulatory, normoandrogenic, and non-polycystic ovary PCOS were 69.9, 10.8, 10.8, and 8.6%, respectively. Serum AMH concentrations >5.56 ng/mL were associated with PCOS in the 21–25-year-old group. The cut-off value was 4.01 ng/mL in the 26–30-year-old group, whereas it was 3.42 ng/mL in the oldest age group. The correlation between the antral follicle count (AFC) and serum AMH level was strong for each age group.
Conclusions
The serum AMH concentration is a valuable parameter for assessing patients with symptoms indicative of PCOS. We recommend measuring serum AMH levels to support the diagnosis or to use them instead of the AFC for the Rotterdam criteria.
1. Introduction
The clinical significance and pathophysiology of polycystic ovary syndrome (PCOS) have been studied for more than150 yearsCitation1. Enlarged ovaries with “smooth capsules” were first described in a French surgical textbook in 1844Citation2. Stein and Leventhal published the classic definition of polycystic ovaries in 1935, followed by their relationship with hyperandrogenism, amenorrhea, and infertility, resulting in the names for the diseaseCitation3. It is a common endocrinological disorder affecting approximately 10% of women of reproductive ageCitation4. Hyperandrogenism and oligo/anovulation are basic characteristics of PCOS, and metabolic disorders are usually accompanied by these features. However, metabolic disorders were not included in the definition.
PCOS was defined by the Rotterdam Consensus Group and diagnosed based on hyperandrogenism, oligo/anovulation, and polycystic ovarian morphology on ultrasonographyCitation5. The data suggest that polycystic ovarian morphology (PCOM) may be a result of hyperandrogenism, so a revision of the diagnostic criteria for PCOS was suggestedCitation6. Dewailly et al. demonstrated that the serum concentration of the anti-Müllerian hormone (AMH), a peptide synthesized by the granulosa cells of follicles, is correlated with an increased number of follicles. They suggested that excessive number of follicles or high AMH concentrations may reflect the effect of intraovarian androgens disturbing the folliculogenesis in PCOS and thus could be used as “surrogates for classical hyperandrogenism markers”Citation6. Bell et al. argued that as an endocrinological parameter, AMH may be associated with metabolic disruptions reported to be related with PCOSCitation7.
Recent developments in ultrasonography have increased the number of follicles that can be counted; therefore, the number of women diagnosed with PCOM increasedCitation8. Duijkers et al. reported a PCOM prevalence of 63% in 2010 and called for a revision of the PCOM criteriaCitation9. Compared to women with PCOM, fewer women without PCOM have hyperandrogenemia or related problems and menstrual irregularitiesCitation10. The serum AMH concentration has been suggested as a replacement for an increased AFC and as a predictive marker of PCOSCitation11–13. AMH is thought to be associated with the pathogenesis of PCOS, in addition to being a marker for PCOS diagnosis. The inhibitory effect of AMH on FSH function is believed to be one of the factors that causes anovulation in women with PCOSCitation14,Citation15. Teede et al. also emphasized the potential of using AMH to detect PCOM and diagnose PCOS, although they did not recommend the regular use of AMH for the assessment and management of PCOS because of the lack of universally approved thresholds and standardized laboratory proceduresCitation16.
1.1. Objective
This descriptive study aimed to determine the cut-off values of the serum AMH concentration for different age groups (21–25, 26–30, 31–35 years) to diagnose PCOS.
2. Methods
2.1. Ethics statements
The study was conducted at Dokuz Eylul University Hospital and approved by the ethics board of our institution (ethics board decision: 2018/20-39; file: 4063-GOA). This study was performed in accordance with the Declaration of Helsinki. All participants were enrolled after providing written informed consent.
2.2. Patient population
A total of 187 women aged 21–35 years who visited the outpatient clinic of the obstetrics and gynaecology department were enrolled in this study. After the assessment of our outpatient admissions data retrospectively, we discovered that the number of patients under 21 years of age, who underwent transvaginal ultrasonography, was very limited. The same data also indicated that patients older than 35 years of age rarely presented with PCOS-related symptoms. Hence, the age groups were established between 21 and 35 years of age. Although we initially intended to proceed with narrower age ranges, as various previous studies had set the age range as five yearsCitation17,Citation18, we decided to maintain the five-year range because of our limited testing capacity and requirement to include at least 31 patients for each group. The patients visited the outpatient clinic between June 2019 and December 2019. Including 21 and 35 years of age, being within the age range of 21 to 35 years was determined as an inclusion criterion. The exclusion criteria were as follows: being out of the predetermined age range, history of ovarian surgery, detection of an adnexal mass during the examination, history of any neoplasm in the ovaries, history of pelvic radiotherapy or systemic chemotherapy, pregnancy, receiving any hormonal therapy in the last 3 months (including oral contraceptives), lactation, history of systemic endocrinological disease (e.g. congenital adrenal hyperplasia, Cushing syndrome, hyperprolactinemia, and hypothalamic amenorrhea), and history of systemic autoimmune chronic disease.
Patients who visited the outpatient clinic with PCOS-related symptoms and were diagnosed with PCOS according to the Rotterdam Criteria formed the PCOS group (n = 93). The presence of at least two of the following was needed for diagnosis: hyperandrogenemia and/or clinical hyperandrogenism, polycystic ovaries, oligomenorrhea (duration between cycles >35, <90 days), or amenorrhea (>90 days after the last period). Patients who visited the clinic for routine gynaecological check-ups and had no symptoms of PCOS formed the control group (n = 94).
2.3. Data collection
After spontaneous or progestin-induced menstruation, the serum hormone concentrations were evaluated on the second or third day of the menstrual cycle. Serum estradiol, follicle-stimulating hormone (FSH), luteinising hormone (LH), prolactin (PRL), total testosterone, dehydroepiandrosterone sulfate (DHEAS), sex hormone-binding globulin (SHBG), androstenedione, and anti-Müllerian hormone (AMH) levels were measured. FSH, LH, PRL, total testosterone, DHEAS, SHBG, and androstenedione levels were measured by chemiluminescence using a Siemens Immulite 2000xp analyzer with the original Siemens Immulite 2000 kits (Siemens Healthineers AG, Erlangen, Germany). AMH levels were tested by the chemiluminescence immunoassay method using a DXI analyzer (Beckman Coulter, Brea, CA, USA) with the original kits provided by the manufacturer (lower limit of quantitation: 0.08 ng/mL, highest calibrator value: 24 ng/mL; coefficient of variation: 3.1% according to the manufacturer). Additionally, the Ferriman–Gallwey scores of all patients were clinically assessed and their body mass indexes (BMI) were calculated. Total AFC measurements were made using transvaginal ultrasonography (frequency 4–10 Mhz, General Electric Voluson P6, transducer E8C-RS H40402LN, General Electric Healthcare, Chicago, IL, USA) on the day of the serum sample (day 2 or 3 of the cycle).
2.4. Statistical analysis
In a meta-analysis investigating AMH as a diagnostic marker for PCOSCitation11, the area under the curve (AUC) for distinguishing between cases and controls was calculated to be 0.874. In this study, the discriminative ability of AMH for subgroup separation (age groups) was also assessed using the receiver operating characteristic (ROC) curve. We calculated the sample size for an AUC of 0.874 (95% power and 95% confidence interval) to be 31 for each group. It was anticipated that the AUC for the subgroups may decrease to 0.75. For both situations (AUC = 0.874 and 0.750), the sample size calculated at 95% confidence interval and 95% power was determined to be 31 and 12 for each group, respectively. The goal of this study is to reach a sample size of 31 in order to test all hypotheses. The analysis was made according to methods defined by Hanley et al. and Obuchowski et al.Citation19,Citation20. To determine the cut-off value of the serum AMH concentration for PCOS, ROC curve analyses were performed for all three age groups.
Data from 187 patients were analyzed. Descriptive data are presented as mean values and standard deviations. We used the Kolmogorov–Smirnov test to determine whether the values were normally distributed. Normally distributed data are presented as mean values and standard deviations. Non-normally distributed data are presented as median, minimum, and maximum values. Normally distributed data were compared using the t-test, whereas non-normally distributed data were compared using the Mann–Whitney U test. Correlation analyses between two variables were performed using Pearson correlation analysis. SPSS version 24 software was used to perform the statistical analyses (IBM Corp., Armonk, NY, USA).
3. Results
We analyzed 187 patients aged 21–35 years. Patients’ mean age was 27.78 ± 4.40 years. When we compared the ages of the patients with PCOS and the controls, no statistically significant differences were detected in any age group. The distribution of the patients regarding their PCOS phenotypes according to the Rotterdam Criteria is presented in .
Table 1. Distribution of the number of patients according to PCOS phenotypes.
In the analysis of patients aged 21–25 years, we compared the parameters between the PCOS and control groups. In the PCOS group, the weight, BMI, Ferriman–Gallwey score, total AFC, LH/FSH ratio, serum LH concentration, and serum AMH concentration were significantly greater than those in the control group. However, the differences were not significant with respect to age, height, or serum concentrations of SHBG, total testosterone, DHEAS, androstenedione, FSH, estradiol, thyroid-stimulating hormone (TSH), and prolactin ().
Table 2. Comparison of data between patients with PCOS and the control group among those aged 21–25 years.
The weight, BMI, Ferriman–Gallwey score, total AFC, LH/FSH ratio, serum total testosterone, androstenedione, and AMH concentrations were significantly greater in the PCOS group than in the control group. However, serum SHBG, FSH, and prolactin concentrations were significantly higher in the control group than in the PCOS group. The differences in age, height, and serum DHEAS, LH, estradiol, and TSH concentrations were not statistically significant between the groups ().
Table 3. Comparison of data between patients with PCOS and the control group among those aged 26–30 years.
The weight, BMI, Ferriman–Gallwey score, total AFC, LH/FSH ratio, and serum total testosterone, LH, and AMH concentrations were significantly higher in the PCOS group than in the control group for patients aged 31–35 years. There were no statistically significant differences in the remaining parameters: age, height, and serum concentrations of SHBG, DHEAS, androstenedione, FSH, estradiol, TSH, and prolactin ().
Table 4. Comparison of data between patients with PCOS and the control group among those aged 26–30 years.
Correlation analysis examining the relationship between the serum AMH concentration and total AFC revealed a statistically significant correlation. The correlation coefficients (r) were in the range of strong for every age group according to Evans (1996). The results of the Pearson correlation analysis are presented in .
Table 5. Pearson correlation analysis of the total antral follicle count and serum AMH concentration.
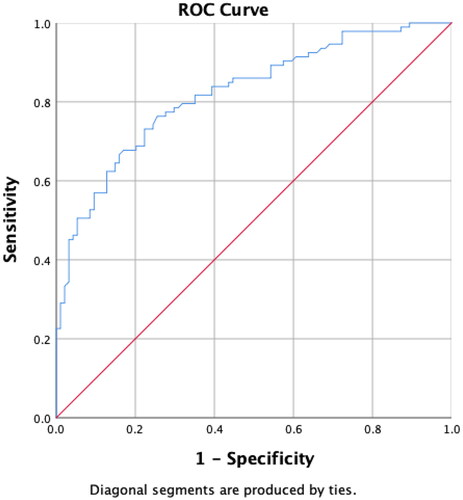
To determine the cut-off serum AMH concentration for PCOS, ROC curve analyses were performed for all three age groups. For patients aged 21–25 years, a serum AMH concentration >5.56 ng/mL was associated with PCOS (sensitivity, 80.65%; specificity, 75.00%; positive predictive value [PPV], 75.36%; and negative predictive value [NPV], 80.00%). The area under the curve (AUC) was 0.8543 and the p-value was <.001 (). Concerning the 26–30-year-old group, a serum AMH concentration ≥4.01 ng/mL was associated with PCOS (sensitivity, 74.19%; specificity, 70.07%; PPV, 71.88%; NPV, 73.33%). The AUC in the ROC analysis was 0.7862, and the p-value was <.001 (). For the eldest age group (31–35 years) the AMH concentration associated with PCOS was >3.42 ng/mL (sensitivity, 74.19; specificity, 83.87; PPV, 82.14; NPV, 76.47%). The AUC was 0.8666, and the p-value was <.001 (). Finally, we analyzed all age groups. AMH concentrations >4.37 ng/mL were associated with PCOS (sensitivity, 76.34%; specificity, 74.47%; PPV, 74.74; NPV, 76.47). The AUC was 0.8220, and the p-value was <.001 ().
Figure 1. Receiver operating characteristic (ROC) curve analysis of serum anti-Müllerian hormone (AMH) concentrations for patients aged 21–25 years. A serum AMH concentration >5.56 ng/mL is associated with polycystic ovary syndrome (sensitivity, 80.65%; specificity, 75.00%; positive predictive value, 75.36%; negative predictive value, 80.00%). The area under the curve is 0.8543, and the p-value is <.001.
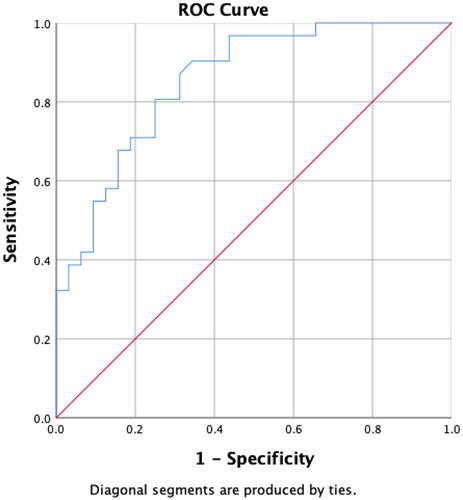
Figure 2. Receiver operating characteristic (ROC) curve analysis of serum anti-Müllerian hormone (AMH) concentrations for patients aged 26–30 years. A serum AMH concentration ≥4.01 ng/mL is associated with polycystic ovary syndrome (sensitivity, 74.19%; specificity, 70.07%; positive predictive value, 71.88%; negative predictive value, 73.33%). The area under the curve is 0.7862, and the p-value is <.001.

Figure 3. Receiver operating characteristic (ROC) curve analysis of serum anti-Müllerian hormone (AMH) concentrations for patients aged 31–35 years. A serum AMH concentration >3.42 ng/mL is associated with polycystic ovary syndrome (sensitivity, 74.19; specificity, 83.87; positive predictive value, 82.14; negative predictive value, 76.47%). The area under the curve is 0.8666, and the p-value is <.001.
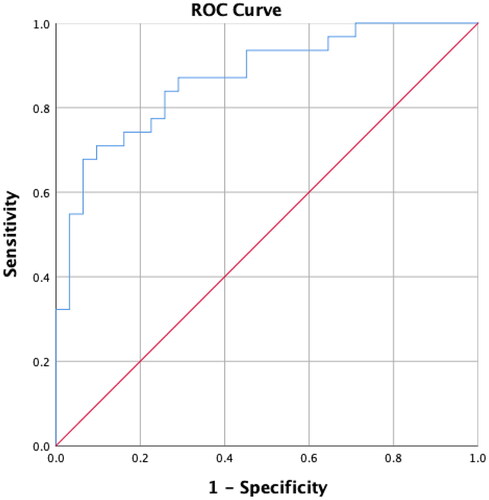
Figure 4. Receiver operating characteristic (ROC) curve analysis of serum anti-Müllerian hormone (AMH) concentrations for all age groups combined. A serum AMH concentration >4.37 ng/mL is associated with polycystic ovary syndrome (sensitivity, 76.34%; specificity, 74.47%; positive predictive value, 74.74; negative predictive value, 76.47). The area under the curve is 0.8220, and the p-value is <.001.
4. Discussion
4.1. Findings and interpretation
The presence of PCOM, a Rotterdam diagnostic criterion, was defined by Balen et al. as the presence of at least 12 follicles with diameters between 2 and 9 mmCitation21. In another study by Bentzen et al. the researchers observed PCOM in almost half of the healthy women who were included in the study. Therefore, they suggested that this criterion should be reconsideredCitation22. Fong et al. showed that the serum AMH concentration has a diagnostic performance similar to that of the AFCCitation23. The authors also stated that 12 as the follicle count is still valid for PCOM, provided the ultrasonographic examination is conducted according to standards that the Rotterdam criteria were based on (transvaginal ultrasound probe, 6.5–8 megahertz). However, concerning the conditions in 2017, the authors stated that devices with maximum frequencies ≤8 MHZ were no longer actively used. Consequently, the newer devices can detect more follicles. Thus, the definition of PCOM is controversial, and recently suggested thresholds for the number of follicles include 20Citation24 and 25Citation25. The frequency range of the ultrasound probe used was 4–10 mHz, which was capable of detecting an increased number of follicles. Hence, our research supports the widely voicedCitation26 need for a more standardized approach, such as AMH.
Cela et al. reported an increased risk of ovarian hyperstimulation syndrome (OHSS) after controlled ovarian hyperstimulation in patients with PCOS. They also concluded that patients with PCOS phenotype A (the presence of all three Rotterdam criteria) were at a higher risk of OHSS, and these patients had higher serum AMH concentrations than those with other phenotypesCitation27. Kalem et al. lists high AMH concentrations as a risk factor for OHSS that are related to the patientCitation28. Sahmay et al. and Jamil et al. reported similar results regarding the AMH concentrations in PCOS phenotypesCitation29,Citation30.
Comparisons of various parameters between the PCOS and control groups are presented in . The weight, BMI, Ferriman–Gallwey scores, total AFC, and serum AMH concentration of patients with PCOS were greater than those of patients in the control group. The differences in these parameters were statistically significant in all three age groups. Increased weight and BMI support the association between metabolic syndrome and PCOS. Ferriman–Gallwey scores and total AFCs were expected to be greater in patients with PCOS, as suggested by the Rotterdam criteria.
A decrease in the serum SHBG concentration is expected in patients with PCOSCitation31. In the group of patients aged 26–30 years, our study demonstrated significantly lower SHBG levels in the PCOS group than in the control group. SHBG concentrations tended to be lower in the other age groups, but the analysis failed to show a statistical significance. The number of patients in these age groups may not have been sufficient to demonstrate a significant reduction in SHBG concentrations. Another possible explanation is that the BMI of patients aged 26–30 years was higher than that of the other age groups. Obesity and hyperinsulinemia negatively affect serum SHBG concentrations and increase the free androgen fractionCitation32. This may have caused the decrease in serum SHBG levels in this age group to be more substantial.
Serum androgen parameters were higher in patients with PCOS than in controls in every age group. Nevertheless, the differences between the PCOS and control groups were not statistically significant for any parameter in each age group. The lack of hyperandrogenic laboratory findings may lead to doubts regarding the accuracy of the PCOS diagnosis. Clinical and/or laboratory findings are required as diagnostic criteria. The Ferriman–Gallwey score is a practical clinical finding, and as demonstrate, it was significantly higher in patients with PCOS than in controls.
FSH is detected at normal or lower serum concentrations in women with PCOSCitation33,Citation34. Serum FSH concentrations were lower in all three age groups. This difference was statistically significant in patients aged 26–30 years. In addition, serum LH concentrations are expected to be higher in PCOS because of its association with androgen secretion from hyperplastic theca cellsCitation35. Our study indicated significantly higher levels of LH in the 21–25- and 31–35-year-old groups. The remaining age groups also showed higher LH concentrations among patients with PCOS than among controls, but the difference was not statistically significant. Nevertheless, the LH/FSH ratio was significantly higher in all age groups, as expected.
Serum estradiol concentrations were lower in patients with PCOS in all age groups than in controls. However, these differences were not statistically significant. Still, an inverse correlation between serum AMH and estradiol concentrations was reportedCitation36. Although there is an increased risk of endometrial carcinoma in women with PCOS due to prolonged estrogen exposure without being balanced with progesteroneCitation36, it does not necessarily mean that serum estradiol levels should be higher.
Diagnosis of PCOS relies on the exclusion of other endocrinological aetiologies; therefore, TSH and prolactin levels should be assessed. Serum concentrations of these hormones were within the reference ranges for all patients herein.
As expected, the serum AMH concentrations were higher in the PCOS group than in the control group for each age group. The differences were statistically significant, and AMH levels showed a strong positive correlation with the AFC, which is consistent with findings in the literatureCitation23. The median AFC was 26 in each age group. This was unexpected, because it was expected to decrease with age. The distribution of data was not normal for any age group concerning the AFC; therefore, we used the median in the analysis. As expected, the AFC decreased with age in the control group. We did not detect any measurement errors, and if we had enrolled more patients in the study, we would have obtained the expected result. Younger patients may have had more follicles that could not be counted by ultrasonography. User-dependent variability has been an issue with the role of ultrasonography in diagnosis. Amer et al. underlined the intra- and inter-observer variabilities of ultrasonography in 2002Citation37. Rao et al. emphasized this issue in 2020Citation38. This finding supports the idea that serum AMH measurements are more reliable than AFC measurements. Ultrasonography may not be performed optimally for other reasons.
Serum AMH concentrations decreases with age. The decrease due to age is slower in women with PCOS than in those without, and this may prolong the fertility window for these womenCitation39. The AMH levels detected in our study were lower in older patients than in younger patients, although higher concentrations were observed in women with PCOS who were older than 30 years of age. The AFC and AMH level are expected to remain high in patients with PCOS despite increased age. The reduction in AFC and AMH levels is more obvious in women without PCOS than in those with PCOSCitation40. In relation with this context, AMH is referred as a reliable biomarker for prediction of clinical pregnancy with ICSI-ET (intracytoplasmic sperm injection – embryo transfer) in non-PCOS womenCitation41.
4.2. Results in the context of what is known
Researchers worldwide have suggested various cut-off levels for the serum AMH concentration. The cut-off levels varied among different ethnic groupsCitation42. A study in India suggested 5.03 ng/mL as the cut-off value for PCOS (sensitivity, 70.68%; specificity, 79.91%; AUC, 0.826)Citation43. A Chinese study conducted by Li et al. the suggested a cut-off value of 8 ng/mL for adolescents and young women (sensitivity, 70%; specificity, 61.7%)Citation44. Dewailly et al. suggested a cut-off value of 5 ng/mL for PCOS in a population of non-PCOM, non-PCOS women and those with PCOSCitation12. In a multicentre study, the cut-off serum AMH concentration was calculated as 3.2 ng/mL (sensitivity, 88.6%; specificity, 84.6%)Citation45. This study had used the Elecsys AMH Plus assay, which is a chemiluminescence immunoassay. Ethnic factors were not the subject of our study, but we would like to highlight the fact that the chemiluminescence immunoassay technique was used in our study, as well as in these and other similar studiesCitation46,Citation47. Because we used the same technique, and the specificity and sensitivity results were similar to those of other studies, our data may be considered comparable with those of other studies.
4.3. Clinical implications
In the metanalysis by Iliodromiti et al. serum AMH concentrations >4.7 ng/mL were associated with PCOS (sensitivity, 79.4%; specificity, 82.8%; AUC, 0.87) Citation11. A limitation of this meta-analysis was the need for recalculation of AMH results from older testing methods to make them comparable with results originating from recent chemiluminescence techniques. In our study, all measurements were performed using a recent technique for all age groups. Our study also provided different cut-off values for different age groups, and the sensitivity of the age-group-specific values was close to the sensitivity of the suggested cut-off value for the combined population. This makes age group-specific cut-off values more significant.
4.4. Research implications
Clark et al. reported that the prevalences of frank, ovulatory, normoandrogenic, and non-PCO PCOS were 66, 13, 11, and 9%, respectivelyCitation48. These rates were 69.9, 10.8, 10.8, and 8.6%, respectively in our study. The distribution of patients according to PCOS phenotypes in our study was similar to that reported in the literature. We could not compare the phenotypes because the frank PCOS group was larger than the other three groups combined. However, the distribution of phenotypes may not reflect the overall prevalence in the general population. Our institution is a tertiary clinic, and many patients in the PCOS group were referred for differential diagnoses. Phenotype A was the most prevalent among the selected populations, whereas phenotypes B and C were more prevalent in the unselected populationCitation49. (Phenotype A: hyperandrogenism, ovulatory dysfunction, polycystic ovaries; B: hyperandrogenism, ovulatory dysfunction; C: hyperandrogenism, polycystic ovaries; D: ovulatory dysfunction, polycystic ovaries) Lizneva et al. reported that the clinical cohorts that include mostly referred populations may mislead researchers during epidemiological research and produce wrong elevated odds ratios and “pseudo-significant associations”Citation50.
4.5. Strengths and limitations of the study
We assessed the PCOS cases in different age groups, and as the sample size calculations required, at least 31 patients were included in each age group. After the ROC curve analyses, the lowest AUC was calculated in the 26–30-year-old group (0.7862). Since we had anticipated a decrease in AUC to 0.750 for the subgroups, keeping in mind that the minimum number of patients for each group were met, it is not wrong to state that our data were sufficient to yield statistically significant results for each age group. The study was conducted at a single tertiary centre with a contemporary testing technique, which was also used in other comparable recent studies, supporting the reliability of our data. Nevertheless, concerning the prevalence rate of the condition, a sample size of 187 patients cannot be expected to yield absolute conclusions. Additionally, the number of patients was not sufficient to conduct an analysis between PCOS phenotypes because all phenotypes, except phenotype A, had a small number of patients.
5. Conclusions
The serum AMH concentration provides insight while the patient is being tested for PCOS. Despite the given threshold levels for the diagnosis of PCOS, these are not sufficient as the sole diagnostic test. Our study also provided comparatively sensitive and specific cut-off values for PCOS; however, they were not sufficient to diagnose the condition alone. However, the cut-off values may be used as an alternative method to distinguish polycystic ovarian morphology or as a criterion to entirely replace PCOM. This suggestion has been mentioned in the literature at an increasing rate. Ultrasonographic measurements are less reliable because of user-dependent variability and device-related limitations. We suggest the use of serum AMH measurements while examining patients with symptoms of PCOS to support the diagnosis. Future studies should determine the role of AMH as a diagnostic test.
Transparency
Declaration of funding
This work was supported by the Scientific Research Projects Unit of Dokuz Eylul University. (project registration: 2019KB.SAG.011).
Declaration of financial/other relationships
The authors have no relevant affiliations or financial involvement with any organization or entity with a financial interest in or financial conflict with the subject matter or materials discussed in the manuscript. This includes employment, consultancies, honoraria, stock ownership or options, expert testimony, grants or patents received or pending, or royalties.
Peer reviewers on this manuscript have no relevant financial or other relationships to disclose.
Author contributions
Dr. Timur contributed to the concept and design, manuscript writing, data acquisition, and data analysis; Dr. Cimrin contributed to the sample collection, provision of laboratory equipment, literature review; Dr. Doruk contributed to sample analysis at the laboratory and data collection; and Dr. Dogan contributed to the study design and critical review before submission. All authors approved the final version and all authors agree to be accountable for all aspects of the work.
Acknowledgements
None.
References
- Chang RJ, Dumesic DA. Polycystic ovary syndrome and hyperandrogenic tates. In: Strauss JF, Barbieri RL, editors. Yen & Jaffe’s reproductive endocrinology: physiology, pathophysiology, and clinical management. 8th ed. Philadelphia (PA): Elsevier Inc.; 2019. p. 520–555.e13.
- Malgaigne M. Journal de Chırugıe [Internet]; 1844. Available from: https://books.google.com.tr/books?id=ERoUAAAAQAAJ.
- Stein IF, Leventhal ML. Amenorrhea associated with bilateral polycystic ovaries. Am J Obstet Gynecol. 1935;29(2):181–191.
- Norman RJ, Dewailly D, Legro RS, et al. Polycystic ovary syndrome. Lancet. 2007;370(9588):685–697.
- Fauser BCJM. Revised 2003 consensus on diagnostic criteria and long-term health risks related to polycystic ovary syndrome. Fertil Steril. 2004;81(1):19–25.
- Dewailly D, Pigny P, Soudan B, et al. Reconciling the definitions of polycystic ovary syndrome: the ovarian follicle number and serum anti-Müllerian hormone concentrations aggregate with the markers of hyperandrogenism. J Clin Endocrinol Metab. 2010;95(9):4399–4405.
- Bell RJ, Islam RM, Skiba MA, et al. Substituting serum anti-Müllerian hormone for polycystic ovary morphology increases the number of women diagnosed with polycystic ovary syndrome: a community-based cross-sectional study. Hum Reprod. 2021;37(1):109–118.
- Johnstone EB, Rosen MP, Neril R, et al. The polycystic ovary post-Rotterdam: a common, age-dependent finding in ovulatory women without metabolic significance. J Clin Endocrinol Metab. 2010;95(11):4965–4972.
- Duijkers I, Klipping C. Polycystic ovaries, as defined by the 2003 Rotterdam consensus criteria, are found to be very common in young healthy women. Gynecol Endocrinol. 2010;26(3):1–9.
- Balen A, Homburg R, Franks S. Defining polycystic ovary syndrome. BMJ. 2009;338(7692):a2968.
- Iliodromiti S, Kelsey TW, Anderson RA, et al. Can anti-Müllerian hormone predict the diagnosis of polycystic ovary syndrome? A systematic review and meta-analysis of extracted data. J Clin Endocrinol Metab. 2013;98(8):3332–3340.
- Dewailly D, Gronier H, Poncelet E, et al. Diagnosis of polycystic ovary syndrome (PCOS): revisiting the threshold values of follicle count on ultrasound and of the serum AMH level for the definition of polycystic ovaries. Hum Reprod. 2011;26(11):3123–3129.
- Lauritsen MP, Bentzen JG, Pinborg A, et al. The prevalence of polycystic ovary syndrome in a normal population according to the Rotterdam criteria versus revised criteria including anti-Müllerian hormone. Hum Reprod. 2014;29(4):791–801.
- Homburg R, Crawford G. The role of AMH in anovulation associated with PCOS: a hypothesis. Hum Reprod. 2014;29(6):1117–1121.
- Visser JA, Themmen APN. Anti-Müllerian hormone and folliculogenesis. Mol Cell Endocrinol. 2005;234(1–2):81–86.
- Teede H, Misso M, Tassone EC, et al. Anti-Müllerian hormone in PCOS: a review ınforming ınternational guidelines. Trends Endocrinol Metab. 2019;30(7):467–478.
- Demirdjian G, Bord S, Lejeune C, et al. Performance characteristics of the access AMH assay for the quantitative determination of anti-Müllerian hormone (AMH) levels on the access* family of automated immunoassay systems. Clin Biochem. 2016;49(16–17):1267–1273.
- Anckaert E, Öktem M, Thies A, et al. Multicenter analytical performance evaluation of a fully automated anti-Müllerian hormone assay and reference interval determination. Clin Biochem. 2016;49(3):260–267.
- Hanley JA, McNeil BJ. A method of comparing the areas under receiver operating characteristic curves derived from the same cases. Radiology. 1983;148(3):839–843.
- Obuchowski NA, McClish DK. Sample size determination for diagnostic accuracy studies involving binormal ROC curve indices. Statist Med. 1997;16(13):1529–1542.
- Balen AH, Laven JSE, Tan SL, et al. Ultrasound assessment of the polycystic ovary: ınternational consensus definitions. Hum Reprod Update. 2003;9(6):505–514.
- Bentzen JG, Forman JL, Johannsen TH, et al. Ovarian antral follicle subclasses and anti-mullerian hormone during normal reproductive aging. J Clin Endocrinol Metab. 2013;98(4):1602–1611.
- Lie Fong S, Laven JSE, Duhamel A, et al. Polycystic ovarian morphology and the diagnosis of polycystic ovary syndrome: redefining threshold levels for follicle count and serum anti-Müllerian hormone using cluster analysis. Hum Reprod. 2017;32(8):1723–1731.
- Teede HJ, Misso ML, Costello MF, et al. Recommendations from the international evidence-based guideline for the assessment and management of polycystic ovary syndrome. Fertil Steril. 2018;110(3):364–379.
- Dewailly D, Lujan ME, Carmina E, et al. Definition and significance of polycystic ovarian morphology: a task force report from the androgen excess and polycystic ovary syndrome society. Hum Reprod Update. 2014;20(3):334–352.
- Bozdag G, Mumusoglu S, Zengin D, et al. The prevalence and phenotypic features of polycystic ovary syndrome: a systematic review and meta-analysis. Hum Reprod. 2016;31(12):2841–2855.
- Cela V, Obino MER, Alberga Y, et al. Ovarian response to controlled ovarian stimulation in women with different polycystic ovary syndrome phenotypes. Gynecol Endocrinol. 2018;34(6):518–523.
- Namli Kalem M, Kalem Z, Gürgan T, et al. Problems and complications during the treatment of ınfertility in women with polycystic ovary syndrome. Gynecol Obstet Reprod Med. 2016;22(2):113–124.
- Sahmay S, Atakul N, Oncul M, et al. Serum anti-Mullerian hormone levels in the main phenotypes of polycystic ovary syndrome. Eur J Obstet Gynecol Reprod Biol. 2013;170(1):157–161.
- Jamil AS, Alalaf SK, Al-Tawil NG, et al. Comparison of clinical and hormonal characteristics among four phenotypes of polycystic ovary syndrome based on the Rotterdam criteria. Arch Gynecol Obstet. 2016;293(2):447–456.
- McCartney CR, Blank SK, Prendergast KA, et al. Obesity and sex steroid changes across puberty: evidence for marked hyperandrogenemia in pre- and early pubertal obese girls. J Clin Endocrinol Metab. 2007;92(2):430–436.
- McCartney CR, Prendergast KA, Chhabra S, et al. The association of obesity and hyperandrogenemia during the pubertal transition in girls: obesity as a potential factor in the genesis of postpubertal hyperandrogenism. J Clin Endocrinol Metab. 2006;91(5):1714–1722.
- Singer T, Barad DH, Weghofer A, et al. Correlation of antimüllerian hormone and baseline follicle-stimulating hormone levels. Fertil Steril. 2009;91(6):2616–2619.
- Georgopoulos NA, Saltamavros AD, Decavalas G, et al. Serum AMH, FSH, and LH levels in PCOS. Fertil Steril. 2010;93(3):e13.
- Willis D, Mason H, Gilling-Smith C, et al. Modulation by insulin of follicle-stimulating hormone and luteinizing hormone actions in human granulosa cells of normal and polycystic ovaries. J Clin Endocrinol Metab. 1996;81(1):302–309.
- Cook CL, Siow Y, Brenner AG, et al. Relationship between serum müllerian-inhibiting substance and other reproductive hormones in untreated women with polycystic ovary syndrome and normal women. Fertil Steril. 2002;77(1):141–146.
- Amer SAKS, Li TC, Bygrave C, et al. An evaluation of the inter-observer and intra-observer variability of the ultrasound diagnosis of polycystic ovaries. Hum Reprod. 2002;17(6):1616–1622.
- Rao P, Bhide P. Controversies in the diagnosis of polycystic ovary syndrome. Ther Adv Reprod Heal. 2020;14:2633494120913032.
- Laven JSE, Mulders A, Visser JA, et al. Anti-Mullerian hormone serum concentrations in normoovulatory and anovulatory women of reproductive age. J Clin Endocrinol Metab. 2004;89(1):318–323.
- Fu H, Lin Y, Deng X, et al. Correlation between anti-Mullerian hormone levels and antral follicle counts in polycystic ovary and metabolic syndromes. Syst Biol Reprod Med. 2021;67(2):112–120.
- Elgun T, Karacan M, Sandal AI, et al. Can serum anti-Mullerian hormone level and LH/FSH ratio be predictive of clinical pregnancy through ıntracytoplasmic sperm Injection – embryo transfer? Gynecol Obstet Reprod Med. 2020;26(1):25–30.
- Tal R, Seifer DB. Potential mechanisms for racial and ethnic differences in antimullerian hormone and ovarian reserve. Int J Endocrinol. 2013;2013:818912.
- Mahajan N, Kaur J. Establishing an Anti-Müllerian hormone cutoff for diagnosis of polycystic ovarian syndrome in women of reproductive age-bearing Indian ethnicity using the automated anti-Müllerian hormone assay. J Hum Reprod Sci. 2019;12(2):104–113.
- Li L, Chen X, Mo Y, et al. Elevated serum anti-mullerian hormone in adolescent and young adult Chinese patients with polycystic ovary syndrome. Wien Klin Wochenschr. 2010;122(17–18):519–524.
- Dietz de Loos A, Hund M, Buck K, et al. Antimüllerian hormone to determine polycystic ovarian morphology. Fertil Steril. 2021;116(4):1149–1157.
- Pigny P, Gorisse E, Ghulam A, et al. Comparative assessment of five serum antimullerian hormone assays for the diagnosis of polycystic ovary syndrome. Fertil Steril. 2016;105(4):1063–1069.e3.
- Tremellen K, Zander-Fox D. Serum anti-Mullerian hormone assessment of ovarian reserve and polycystic ovary syndrome status over the reproductive lifespan. Aust N Z J Obstet Gynaecol. 2015;55(4):384–389.
- Clark NM, Podolski AJ, Brooks ED, et al. Prevalence of polycystic ovary syndrome phenotypes using updated criteria for polycystic ovarian morphology . Reprod Sci. 2014;21(8):1034–1043.
- Lizneva D, Kirubakaran R, Mykhalchenko K, et al. Phenotypes and body mass in women with polycystic ovary syndrome identified in referral versus unselected populations: systematic review and meta-analysis. Fertil Steril. 2016;2106(6):1510–1520.e2.
- Lizneva D, Suturina L, Walker W, et al. Criteria, prevalence, and phenotypes of polycystic ovary syndrome. Fertil Steril. 2016;106(1):6–15.