
Abstract
Different stakeholders, such as authors, research institutions, and healthcare professionals (HCPs) may determine the impact of peer-reviewed publications in different ways. Commonly-used measures of research impact, such as the Journal Impact Factor or the H-index, are not designed to evaluate the impact of individual articles. They are heavily dependent on citations, and therefore only measure impact of the overall journal or researcher respectively, taking months or years to accrue. The past decade has seen the development of article-level metrics (ALMs), that measure the online attention received by an individual publication in contexts including social media platforms, news media, citation activity, and policy and patent citations. These new tools can complement traditional bibliometric data and provide a more holistic evaluation of the impact of a publication. This commentary discusses the need for ALMs, and summarizes several examples – PlumX Metrics, Altmetric, the Better Article Metrics score, the EMPIRE Index, and scite. We also discuss how metrics may be used to evaluate the value of “publication extenders” – educational microcontent such as animations, videos and plain-language summaries that are often hosted on HCP education platforms. Publication extenders adapt a publication’s key data to audience needs and thereby extend a publication’s reach. These new approaches have the potential to address the limitations of traditional metrics, but the diversity of new metrics requires that users have a keen understanding of which forms of impact are relevant to a specific publication and select and monitor ALMs accordingly.
PLAIN LANGUAGE SUMMARY
Different readers have different ways of deciding how important scientific articles are. The usual methods used to measure the impact of research, like the Journal Impact Factor or the H-index, are not meant to measure this for individual articles. These methods mainly look at how many times the articles are mentioned by others, and it can take a long time to see the impact.
But in the past ten years, new tools called article-level metrics (ALMs) have been created. These tools measure how much attention an article gets online, like on social media, in the news, or when other researchers talk about it. ALMs are better at explaining how important a specific article is. They can work together with the usual methods to measure impact.
This paper talks about why ALMs are important and gives examples of these tools, like PlumX Metrics, Altmetric, the Better Article Metrics score, the EMPIRE Index, and scite. It also explains how these tools can help us see the value of animations, videos, or summaries in simple language. These make it easier for more people to understand and learn from the articles.
These new ways of measuring impact can help us see how important articles are in a more complete way. But because there are many different ways to measure this, it’s important for users to understand which methods are relevant for a specific article and keep track of them.
Introduction
Understanding the impact of a peer-reviewed publication, in both the research community and in wider society, is an important goal for various stakeholders. A key challenge is that the concept of “impact” may vary considerably among different stakeholder groups. How publications are received and understood by interested groups is an important consideration for both authors in academia and those in the pharmaceutical and medical device industries. Patient support groups may wish to share publications to improve public awareness of disease. Some peer-reviewed publications are practice-changing; in particular, they can have a widespread impact on healthcare decision-making by the incorporation of relevant study results into guidelines, treatment protocols, and public policies. Studies have estimated the lag from publication to inclusion in clinical guidelines is approximately 8 years, and the lag until impact on clinical practice may be even longerCitation1–3. A better understanding of how biomedical research publications lead to changes in medical practice may ensure that beneficial research findings receive appropriate and timely attention, and thus translate into improvements in patient care sooner.
The limitations of traditional bibliometric analysis
Bibliometric analysis – the statistical analysis of publications in a particular field – can assist with the evaluation of research impact and has a history stretching back over a centuryCitation4. One of the established examples, the Journal Impact Factor, was developed in the 1960s and measures the citation frequency of articles published in the journal within a given yearCitation5. Another frequently encountered example is the H-index, which quantifies an author’s publication output and citation rateCitation6. Because these systems are based on citations, they take years to accumulate and their measures are specific to the authors and readership at the level of the scientific and medical journals themselves and are not specific to individual articles. Furthermore, because these traditional metrics were developed to describe the impact of journals and researchers, they have many serious limitations when used to understand an individual publication’s impact ()Citation7–9. The low granularity of traditional metrics, such as the H-index and Journal Impact Factor, means they cannot be used to compare a publication with an established benchmark (i.e. a publication that achieved a “good” score). There is thus a need for metrics that can rapidly provide faster, richer, and more actionable insights into the impact of a specific article itself, beyond that provided by counting citations.
Table 1. Traditional bibliometric indicators article-level metrics: pros and cons.
The rise of article-level metrics
The internet era has seen the rise of additional channels for communicating peer-reviewed publications that stretch far beyond the traditional outlets such as scientific journals and the popular press, notably discussion of a peer-reviewed publication on social media, blog posts, HCP education websites, and other forms of online attention. These new channels allow the audience to not only access content, but to discuss and further communicate key findings. The development of data analysis tools that can evaluate the digital attention an individual article receives has led to a proliferation of article-level metrics (ALMs) or “altmetrics” (a generic term not to be confused with the Altmetric Attention Score)Citation10.
Although the Altmetric Manifesto of Priem et al. in 2010 is considered the birth of altmetricsCitation10,Citation11, earlier efforts to understand internet-based attention to research had been conducted and described using the term “webometrics,” focused on the analysis of hyperlinks, search engine results and web citationsCitation12–14. With the growing importance of social media for the dissemination of researchCitation15, ALMs have evolved to include attention data from social media networks such as Facebook and ResearchGate, microblogging services (e.g. Twitter), reference management software (e.g. Mendeley), and diverse sources including news, policy and patent citations ()Citation9,Citation16. The availability of metrics for large-scale analytics is restricted by technical limitations and policy. For example, online platforms may lack application processing interfaces (APIs) to facilitate the capture of dataCitation9, or the data may not be available publicly (for example, discussion on closed forums and readership data for many journals). Despite this limitation, PlumX Metrics offers 40 individual metrics across five categoriesCitation17.
Table 2. Examples of data sources for use as article-level metrics.
The potential benefits of altmetrics and ALMs
Altmetrics and ALMs address one of the major shortcomings of citation-based metrics by incorporating measures of attention from diverse sources, they offer insights into the impact of the peer-reviewed publications on audiences not reflected in citation activity ()Citation10. Some altmetrics and ALMs can provide information on the impact of a publication within weeks or months, rather than the months or years required with citation-based approachesCitation10. The type of engagement that ALMs evaluate is highly heterogeneous. This arises from the differences between audiences among online platforms and their different motivations for their activity in relation to the publication. This is useful because the intended impact may differ greatly for different types of research studies, such as clinical trials versus real-world studies. A publication on a preclinical study of a new drug candidate will have a very different intended impact to that of a large phase III randomized clinical trial of the same drug. The availability of ALMs may allow stakeholders to select and monitor metrics that align specifically with communication objectives for an individual publication, rather than monitoring less meaningful “one size fits all” metrics. Thus, ALMs give authors and other stakeholders a chance to evaluate the impact of their publication, both in academia and broader society in a more refined manner than journal- or author-level metrics. This richness of information can create difficulty in conveying to stakeholders the impact of a peer-reviewed publication in a clear and concise manner, and so a variety of approaches have been proposed that involve selecting, aggregating and weighting metrics to provide simplified scores.
Broadening the metrics horizon: publication extenders
Estimates suggest one new publication is added to PubMed every 30 secondsCitation18. An analysis of the volume of medical literature relevant to primary care published in a month concluded that HCPs would need to read for 29 hours a day to keep upCitation19. In reality, an international industry survey found HCPs have only 2 hours of learning time per week20. These circumstances have led to a strong preference for short-form content among HCPs and visualizations over long-form text, even though HCPs still see journal publications as the most important information sourceCitation21. Understanding HCPs’ preferences for new information is important, as information gathering is a crucial first step in reaching a clinical diagnosisCitation22.
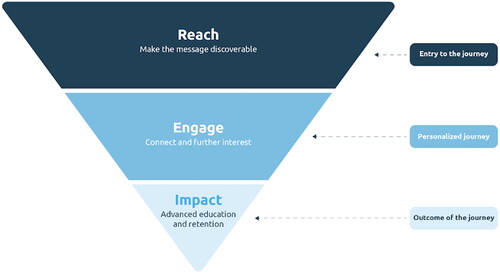
A notable trend in biomedical publishing is the development of publication extenders (also known as publication enhancers). Publication extenders deliver content derived from a publication’s key data in smaller, bite-sized, formats such as short videos, infographics, visual abstracts, short-form text summaries, interactive dashboards, animations, and podcasts. By using a variety of formats to deliver information in a form convenient for HCPs, publication extenders may extend the reach of a publication to a wider audience, and subsequently achieve a greater level of engagement and impact (). Metrics suitable for evaluating publication extenders are called content performance metrics and can include the number of visitors, time on page, video view duration, downloads, traffic sources, organic search traffic.
Figure 1. The relationship between reach, engagement and impact.
Image provided by MedComms Experts reproduced with permission.
In the scientific publication landscape, each medium demands a distinct set of metrics (). There is a need for widespread education regarding suitable metrics for peer-reviewed publication and content performance metrics for publication extenders. Furthermore, due to the extremely detailed nature of content performance metrics, there is a need to develop comprehensive models that aggregate the metrics, making it easier to extract actionable insights.
Table 3. Overview of metrics sets and typical metrics by medium.
Examples of article-level metrics
This commentary will examine selected examples of ALMs for the evaluation of peer-reviewed publications. The examples of ALMs included are PlumX metrics, Better Article Metrics (BEAM) score, the Altmetric Attention Score (AAS), the EMpirical Publication Impact and Reach Evaluation (EMPIRE) Index, and scite.
PlumX metrics
PlumX Metrics evaluates the online attention given to peer-reviewed publications (and various other items such as conference proceedings and book chapters, collectively referred to as “artifacts”) in Elsevier’s Scopus abstract and citation database using metrics distributed across five categories (citations, usage, captures, mentions, and social media)Citation23. These metrics are visualized in simplified form as a “Plum Print,” a five-armed graphic in which the circle on each arm represents the relative magnitude of that categoryCitation23. PlumX metrics can also be presented in a more detailed table form for each artifact, and the types of attention an article receives can be compared to other articles in the same journal expressed as a percentile. PlumX metrics can also be used to aggregate information for individual researchers or institutions, and benchmarking tools have been developed to allow institutions to compare their metrics to those of their peersCitation23.
The altmetric attention score
Altmetric, established in 2011, is the most widely-used source of ALMsCitation24. The Altmetric Attention Score (AAS) is a weighted count of online attention a piece of research output has received, using default weightings based on the amount of attention each source is likely to achieve ()Citation25. The AAS is presented as a number inside a colored circle, with area of each color representing the different sources of attention ()Citation26 with demographic and geographic data being provided for different types of mention. An analysis of 100 highly-cited peer-reviewed publications on surgery topics found that that articles with higher AASs are associated with higher citation countsCitation27, and a follow-up analysis of this same cohort of publications concluded that AAS was a better predictor of future citations than historical Journal Impact FactorsCitation28.
Figure 2. An example of the Altmetric Attention Score.
Image provided by Altmetric.com and reproduced with permissionCitation26.
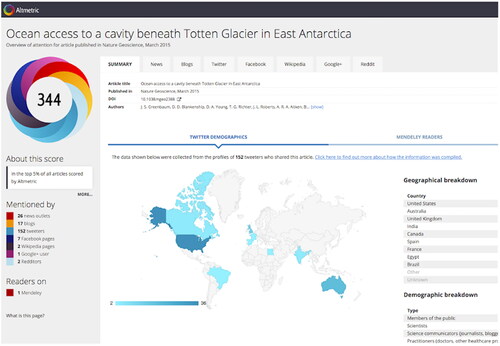
Table 4. Default weightings of attention sources used to calculate the Altmetric Attention Score.
The EMpirical publication impact and reach evaluation (EMPIRE) index
The EMPIRE Index is a multi-component metric framework developed (with support from Novartis) to allow authors in the medical and pharmaceutical research fields to assess the impact of publicationsCitation29. It is intended to monitor long-term impact, predict likely impact with early indicators and identify the effectiveness of communications related to publications. The Index summarizes ALMs to provide three scores reflecting the impact in different domains – social (social media and news), scholarly (journal citations and reference libraries), and societal (guidelines, policy documents and patents; )Citation30. These scores are averaged to provide a total impact scoreCitation29. EMPIRE Index scores are calculated using metrics obtained from Altmetric Explorer, PlumX, Pubstrat Journal Database, CitesScore and Scimago Journal Ranking. These data commonly include news, blog, twitter, and Facebook mentions, Mendeley readers and Dimensions citations, as well as rarer forms such as policy and guideline citations and patents. The grouping and weighting of the metrics were informed by statistical analysis of 2,891 Phase 3 clinical trial publications and are calibrated such that a score of 100 equals the mean scores of Phase 3 clinical trial publications in the New England Journal of Medicine in 2016.
Figure 3. Example of the EMPIRE Index for a single publication.
Source: Rees and Pal, 2023 (Reproduced unchanged under Creative Commons Attribution License [https://creativecommons.org/licenses/by/4.0/legalcode])Citation30.
![Figure 3. Example of the EMPIRE Index for a single publication.Source: Rees and Pal, 2023 (Reproduced unchanged under Creative Commons Attribution License [https://creativecommons.org/licenses/by/4.0/legalcode])Citation30.](/cms/asset/8dbef9d7-c6e7-478a-9826-f4ce716b4d62/icmo_a_2320849_f0003_c.jpg)
The Empire Index can be used to analyze the impact of a publication over time. An example included by Pal and Rees assessed the publication of a Phase 3 study of a type 2 diabetes drug, vildagliptin. At 6–7 months post publication, it had achieved a high Early Predictor Score associated with press releases and a congress presentation that accompanied its publicationCitation29. This publication was selected for early inclusion in treatment guidelines, with subsequent evaluation (approximately 1 year after publication) showing increases in the societal impact scoreCitation29. Additionally, New England Journal of Medicine articles selected by the editors for being “notable” also scored higher on social and societal componentsCitation29. These findings suggest that the EMPIRE Index can be used to identify publications that have a higher or lower than expected impact, and thereby inform communication strategies around research topics. Further investigations using the EMPIRE index have revealed the importance of selecting a suitable benchmark publication, when using ALMs. In a 2023 analysis by Rees and Pal, the impact of a publication measured by the EMPIRE index varied significantly by disease area and publication typeCitation30. This finding supports the notion that there is no universal benchmark for measuring the impact of a peer-reviewed publication. Rather, when using ALMs, each publication should be assessed in the context of publication type, disease area and other factors.
An adapted form of the EMPIRE index has been developed by Ipsen and Oxford PharmaGenesis to understand the real-world impact of medical publicationsCitation31. The adapted EMPIRE index uses weighted ALMs, grouped into three scores: reach (short-term, e.g. news articles and Tweets), engagement (medium-term, e.g. blog and Facebook posts) and impact (long-term, e.g. guideline and policy citations)Citation31. This index has been used to compare the impact of different publications, determine why some publications are associated with greater impact and to support processes and publication planning. The approach has enabled targeted analyses to be conducted, for example investigating the impact of publication enhancements, as well as comparing the article metrics associated with simultaneous congress presentation vs asynchronous congress presentationCitation32. This analysis found that simultaneous congress presentation and article publication was associated with more article views and twitter activity compared with asynchronous publicationCitation32. Following internal feedback and discussions, as well as crucial insights gained from evaluating metrics over recent years, the metrics approach has recently evolved. The weightings of the metrics in the component score have been revised following review of historical metrics data. Journal Impact Factor, used in the original scoring system as a component of the Reach score, has been excluded. Rather than taking quarterly snapshots, automated report cards are generated at consistent time points following the date of publication and combined with internal publication details. These report cards facilitate an easy comparison of publications and allow better insights to be obtained by viewing the data in the context of different publication types, therapy areas, and other factors. These summaries have proved useful to the wider company, and the additional detail captured is useful to a smaller team. A limitation is that congress publications are currently excluded from analysis as it has been difficult to find an approach that gathers meaningful metrics.
BEtter article metrics (BEAM)
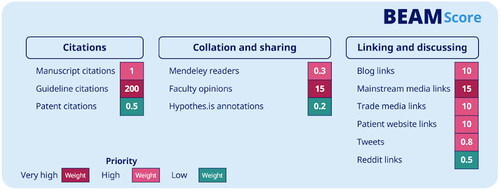
BEAM is a framework and methodology developed by Madano and Novo Nordisk to measure and benchmark the reach, engagement and impact of peer-reviewed manuscripts across 10 therapeutic areas of interest. BEAM collects data on a daily basis on 12 key metrics for all peer-reviewed publications in a given therapeutic area since 2016. In diabetes and obesity, this equates to over 400,000 articles; in hemophilia this is approximately 10,000 articles. The 12 metrics for every publication are combined and then weighted to reflect their frequency and qualitative relevance to Novo Nordisk’s publication objectives (). After weighting, the metrics are normalized by the age of the manuscript (i.e. compared to other manuscripts published within a 6-month window) and therapy area. The weighted and normalized metrics are then combined into a single percentile – the “BEAM Score.”
Figure 4. BEAM metrics and weighting.
Image provided by Novo Nordisk and reproduced with permission.
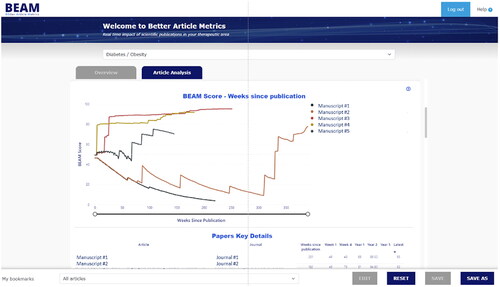
This normalization process, adjusting for age and therapy area, and the use of a simple percentile score is intended to enable comparison of the impact of manuscripts at a glance. The data from each individual article and their BEAM score over time is available to Novo Nordisk publications teams in a “live” BEAM dashboard (). Data can be queried within the BEAM dashboard to display the average BEAM Score based on groups of articles (e.g. identifying study types of high impact), as well as comparing BEAM Scores of individual articles (e.g. tracking an individual article’s impact over time since publication, or comparing the impact of all recent articles publishing Phase 3 data in a given therapeutic area). Artificial intelligence (AI) is also used to analyze publications impact by topic. Large language models are used to categorize publications based on titles, keywords and abstracts. Manual human labelling of these categories then takes place, enabling high impact topics to be identified, as well as highlighting low frequency topics. Finally, BEAM also serves as an information source on the impact of journals and specific social media influencers within a therapeutic area.
Figure 5. An example of the BEAM dashboard showing side-by-side comparison of BEAM Scores for selected manuscripts over time.
Image provided by Novo Nordisk and reproduced with permission.
The information gathered from BEAM allows publications professionals within Novo Nordisk to identify the reach, engagement and impact of their publications. This information can be used to evaluate and update publications strategies and plans and inform future publications. BEAM has been developed for internal Novo Nordisk use only.
scite
A limitation of traditional citation indexes is they do not offer information on whether the citing authors agree or disagree with the publication they cited. scite, a new citation index, uses AI tools to analyze text and provide “Smart Citations” that reveal contextual information on how a publication is being citedCitation33. This includes whether the citing publication provides supporting or contrasting evidence, or only mentions it. Smart Citations include the text surrounding a citation, the location of a citation within the article (introduction, materials and methods, etc.) and information from Crossref and PubMed such as retractions and corrections (). Smart Citations are produced via an automated extraction and classification of citations from scientific texts openly available from repositories such as PubMed Central, publishers’ websites, and subscription articles have also been included via indexing agreements with numerous publishers. scite can also produce similar data aggregated for a specific journal.scite can offer authors and other publication stakeholders insights into how and where their publications are cited, including whether other researchers’ data agrees or contrasts with particular findings. Editorial mentions of publications can be identified and highly-cited authors within specific fields can be identified, including if their work is supported or disputed by other researchers.
Figure 6. Example of a scite report page.
Image provided by scite.ai and reproduced with permission.

Publication extender metrics
The use of publication extenders to broaden the reach and increase the engagement of publications involves content delivered through an omnichannel approach. Publication extender metrics are in their infancy but are technically simple to implement when extenders are hosted on an appropriate HCP education platform. Reach and engagement of extenders can be measured by leveraging already established content performance metrics for online content. These quantitative metrics may include overall views, organic search traffic, time spent on page, scroll depth, click-through rate, video play rate and watch time, and podcast consumption rates. Metrics can also assess the pathways taken by audience members towards and away from the extender. As the use of publication extenders becomes more common, their metrics may become more standardized and may be incorporated into other ALMs.
Discussion
Traditional publication metrics preceded the availability of modern digital tools and channels that have profoundly changed the dissemination of peer-reviewed publications. Furthermore, they are unsuitable for evaluating the impact of individual articles, and do not provide information about the context in which a publication is cited. The rise of ALMs has created a diverse set of metrics that complement traditional bibliometrics and can evaluate the impact of an individual article both within academia and in society. Despite these options, there is a lack of broad awareness and uptake of newer ALMs. Educational efforts aimed at multiple stakeholders to raise awareness of the limitations of traditional metrics and potential alternatives may help correct this situation. The San Francisco Declaration on Research Assessment (DORA) is a welcome example of education and advocacy to promote change in this fieldCitation34. Education on the importance of ALMs should be directed to thought-leaders in academia, among policy-makers and in the life-sciences industry. The many different types of ALMs complicates efforts to explain their meaning and utility to non-publication professionals.
Another area where education of stakeholders may be warranted is the need to choose ALMs that are appropriate to an article’s objectives. Studies comparing ALMs across different publication types have already shown that different publication types receive different levels and sources of online attention, with guideline publications, editorials, and systematic reviews, receiving higher attention than original publicationsCitation35,Citation36. Therefore, institutions, life-science companies and other stakeholders should be informed of the importance of setting a specific communication objective for a peer-reviewed publication and monitoring ALMs that align with that objective.
The incorporation of social media activity into the assessment of research impact is a timely step, especially considering the rise in online scientific communication during the COVID-19 pandemic. Research institutions, professional societies, publishers and life sciences companies are increasingly using social media for research communication, with many open-access journals actively promoting commenting and online engagementCitation15. Social media activity must be interpreted with caution; a tweet or comment may only indicate brief engagement, not thorough understanding. Some companies impose strict restrictions on social media engagement, which will limit the representativeness of social media activity. The continuous changes in popularity of social media platforms over time may make trends in these metrics difficult to analyze. However, social media will remain an important channel for researchers to engage in communication with their peers, and for society to engage with the scientific community. Initial studies suggest the latter interaction is under-developed but may be addressed by institutions and policy makersCitation15. Furthermore, social media commentary can give researchers and other stakeholders a unique insight into a patient’s experience of a drug or disease, and when combined with clinical trial tools may assist with clinical trial enrolmentCitation37.
The diverse nature of ALMs means they have a variety of potential uses. Authors and research funders can use them to identify research topics that are attracting high levels of attention and that are likely to have a higher impact. Another potential use is to identify “key opinion leaders” (KOLs) and their online equivalent “digital opinion leaders” (DOLs) – respected individuals with expertise and influence in a particular field – to form collaborations that ensure publications can achieve a wide audience. While traditional metrics may be helpful for identifying KOLs, the online nature of DOLs are best identified using ALMs, and both scite and the Altmetric Attention Score have noted this potential useCitation38,Citation39.
For pharmaceutical and medical device companies, ALMs can inform several important activities. By providing timely feedback on audience attention, ALMs may help companies evaluate their communication activities and identify opportunities to improve communications or correct misperceptions. Publication professionals can identify communication channels that are more effective for specific audiences, and impact can be compared with publications from competitors, or among similar publications where different communication strategies were used. An example of the latter is an analysis comparing two potentially practice-changing studies published in the same therapy area in the New England Journal of Medicine, one of which was published simultaneously with a congress presentation, the other published asynchronously (6 months after a congress presentation)Citation32. Simultaneous presentation was associated with more article views and associated Twitter activity than asynchronous presentationCitation32. Publication extenders can provide diverse options for the adaptation of communication strategies to increase reach and engagement of focused content, and provide key data from peer-reviewed publications in easily-digestible formats tailored to specific audiences.
Current limitations and future directions
A limitation for ALMs is that sharing of information across online platforms is inconsistent, leading to some platforms being excluded from inclusion in ALMs. For example, LinkedIn, and The National Comprehensive Cancer Network (NCCN, a guideline provider) do not provide machine access to their content for automated analysis, and among reference managers, only one (Mendeley) provides anonymized usage data. Another source of inconsistency is the audience and volume of usage of a particular platform, which may wax and wane over timeCitation40. Some metrics – e.g. the EMPIRE index – are based on a limited subset of studies that may limit applicability to other study types or disease areasCitation29. As with traditional metrics, ALMs are open to manipulation by authors and existing tools may be subject to inaccurate classifications of text or citationsCitation33,Citation41. However, some of these limitations will diminish as ALMs and the technologies that underpin them are further refined. In particular, the further development of AI-based text analysis, already incorporated into BEAM and scite, is likely to lead to wider adoption. Large language models will increasingly be trained on scientific materials and refined to be human oversight, leading to more efficient topic categorization and the development of further ALMs that offer both qualitative and quantitative evaluations of online attention.
An encouraging observation is the evolution that is occurring within the field of ALMs, and this has started to slowly offer more appropriate options beyond Journal Impact Factors. While PlumX provides a wide range of very generic metrics, among which the user must select, AAS consolidates various forms of attention into one score. However, in general ALMs may have a tendency to be heavily driven by metrics from a few specific channels, such as attention from news media and social media, and may not appropriately weight the importance of mentions in policy documents or guidelinesCitation40,Citation42. This attribute can affect the relevance and utility of such scores for a diverse set of users, who may have different perspectives on relative scoring and are keen to have more input on the types of channels and the importance assigned to them in the overall score. The EMPIRE Index and BEAM represent industry-led initiatives attempting to address this gap, and a key consideration being transparency, control and balance in relation to the importance of different attention types. Metrics for publication extenders are of increasing interest, particularly among publications professionals in the pharmaceutical industry, due to a strong preference among HCPs for short form content. Appropriate content performance metrics that can identify factors within the control of the publications team can be used to refine and optimize communication efforts within a short period of time. More broadly, important future steps in the field of ALMs include identifying uniform criteria for defining impact, and identifying appropriate benchmarks for an impactful publication, across diverse disease areas and study types. These steps can lead to metrics that can help answer the core questions underlying the impact of a peer-reviewed publication – if the publication has been read, if so by whom, has it been understood, and if anything changed as a result.
Conclusions
The development of ALMs has created a suite of tools that complement traditional metrics and provide a more timely evaluation of the impact of a peer-reviewed publication across a wider variety of audiences than journal- or author-level metrics. Due to the wide variety of ALMs available, it is important that users carefully consider the specific communication objectives and audiences for a publication and choose ALMs that match. If used appropriately, ALMs can offer authors, research sponsors, and various other stakeholders a more holistic view of the impact of a peer-reviewed publication. However, current ALMs lack the ability to provide a clear and concise measurement of a publication’s impact and an explanation of its value, especially to non-publication professionals. Therefore, we look forward to further refinement and innovation in this field.
Transparency
Declaration of financial/other relationships
Avishek Pal is an employee of Novartis (co-developer of the EMPIRE Index). Tomas Rees is an employee of OxfordPharmagenesis, co-developer of the EMPIRE Index and Ipsen-adapted EMPIRE index). Michael Taylor is an employee of Digital Science (owner of Altmetric and Dimensions). Sarah Thomas is an employee of Ipsen (developer of the Ipsen-adapted EMPIRE Index). Gareth Morrell and Kim Brown are employees of Madano and Novo Nordisk, respectively (co-developers of BEAM). Josh Nicholson is an employee of scite.ai. Avishek Pal, Renu Juneja, Brian Falcone, Wesley Portegies, and Jennifer Schwinn are members of the Medical Affairs Professional Society (MAPS) Medical Communications Focus Area Working Group (provided funding for medical writing assistance for this manuscript). Peer reviewers on this manuscript have no relevant financial or other relationships to disclose.
Author contributions
This manuscript was conceived and designed by Avishek Pal, Wesley Portegies, Jennifer Schwinn, Brian Falcone, and Renu Juneja. All authors contributed to the writing of the manuscript and critical revisions for intellectual content. All authors approved the final version and are accountable for all aspects of this work.
Acknowledgements
Medical writing assistance was provided by Alister Smith of MedComms Experts, Inc. NY, USA, and funded by the Medical Affairs Professional Society. The authors would like to thank all other members of the Medical Affairs Professional Society (MAPS) Medical Communications Focus Area Working Group for discussions and feedback that assisted in the writing of this manuscript.
Additional information
Funding
References
- Morris ZS, Wooding S, Grant J. The answer is 17 years, what is the question: understanding time lags in translational research. J R Soc Med. 2011;104(12):510–520. doi:10.1258/jrsm.2011.110180.
- Balas EA, Elkin PL. Technology transfer from biomedical research to clinical practice: measuring innovation performance. Eval Health Prof. 2013;36(4):505–517. doi:10.1177/0163278713508135.
- Grant J, Cottrell R, Cluzeau F, et al. Evaluating "payback" on biomedical research from papers cited in clinical guidelines: applied bibliometric study. BMJ. 2000;320(7242):1107–1111. Apr 22 doi:10.1136/bmj.320.7242.1107.
- Danesh F, Mardani-Nejad A. 1.1 A historical overview of bibliometrics. In: Rafael B, editor. Handbook bibliometrics. Berlin, Boston: De Gruyter Saur; 2021. p. 7–18.
- Haustein S, Larivière V. The use of bibliometrics for assessing research: possibilities, limitations and adverse effects. In: welpe IM, Wollersheim J, Ringelhan S, Osterloh M, editors. Incentives and performance: governance of research organizations. Cham: Springer International Publishing; 2015. p. 121–139.
- Hirsch JE. An index to quantify an individual’s scientific research output. Proc Natl Acad Sci U S A. 2005; Nov 15102(46):16569–16572. doi:10.1073/pnas.0507655102.
- Pudovkin AI. Comments on the use of the journal impact factor for assessing the research contributions of individual authors [opinion]. Front Res Metr Anal. 2018;3:2018. February-02;3. doi:10.3389/frma.2018.00002.
- Gain M, Soni N, Bhavani SD. Detection of potential citation clubs in bibliographic networks. In: Saraswat M, Roy S, Chowdhury C, et al., editors. Proceedings of International Conference on Data Science and Applications. Lecture Notes in Networks and Systems, vol 287. Singapore: Springer; 2022. doi:10.1007/978-981-16-5348-3_56.
- Haustein S. Grand challenges in altmetrics: heterogeneity, data quality and dependencies. Scientometrics. 2016;108(1):413–423. doi:10.1007/s11192-016-1910-9.
- Priem J, Taraborelli P, Groth P, et al. Altmetrics: a manifesto 2010 [cited 2023 14 June]. Available from: https://altmetrics.org/manifesto/.
- Thelwall M. A brief history of altmetrics. Res Trends. 2014;1(37):Article 2.
- Thelwall M. Web impact factors and search engine coverage. J Doc. 2000;56(2):185–189. doi:10.1108/00220410010803801.
- Bar-Ilan J. The web as an information source on informetrics? A content analysis. J Am Soc Inf Sci. 2000;51(5):432–443. doi:10.1002/(SICI)1097-4571(2000)51:5<432::AID-ASI4>3.0.CO;2-7.
- Almind TC, Ingwersen P. Informetric analyses on the world wide web: methodological approaches to ‘Webometrics’. J Doc. 1997;53(4):404–426. doi:10.1108/EUM0000000007205.
- Sugimoto CR, Work S, Larivière V, et al. Scholarly use of social media and altmetrics: a review of the literature. Asso For Info Sci Technol. 2017;68(9):2037–2062. doi:10.1002/asi.23833.
- Taylor M. Slow, slow, quick, quick, slow: five altmetric sources observed over a decade show evolving trends, by research age, attention source maturity and open access status. Scientometrics. 2023;2023/04/01128(4):2175–2200. doi:10.1007/s11192-023-04653-1.
- Plum Analytics. About PlumX Metrics [cited 2023 23 June]. Available from: https://plumanalytics.com/learn/about-metrics/.
- Landhuis E. Scientific literature: information overload. Nature. 2016; Jul 21535(7612):457–458. doi:10.1038/nj7612-457a.
- Alper BS, Hand JA, Elliott SG, et al. How much effort is needed to keep up with the literature relevant for primary care? J Med Libr Assoc. 2004;92(4):429–437.
- Portegies W, Nadell J. Industry sponsored education in neurology [online survey]. Data on File. MedComms Experts, New York, NY, United States. 2018.
- EPG Health. The Gaps Between HCP Demand and Pharma Supply of Medical Information [cited 2023 15 June]. Available from: https://epghealth.com/reports/the-gaps-between-hcp-demand-and-pharma-supply-of-medical-information/.
- Trimble M, Hamilton P. The thinking doctor: clinical decision making in contemporary medicine. Clin Med (Lond). 2016; Aug16(4):343–346. doi:10.7861/clinmedicine.16-4-343.
- Lindsay JM. PlumX from plum analytics: not just altmetrics. J Electron Resour Med Libr. 2016;2016/01/0213(1):8–17. doi:10.1080/15424065.2016.1142836.
- Kolahi J, Khazaei S, Iranmanesh P, et al. Meta-Analysis of correlations between altmetric attention score and citations in health sciences. Biomed Res Int. 2021;2021:6680764–6680711. doi:10.1155/2021/6680764.
- Altmetric.com. How is the Altmetric Attention Score calculated? [cited 2023 26 June]. Available from: https://help.altmetric.com/support/solutions/articles/6000233311-how-is-the-altmetric-attention-score-calculated.
- Altmetric.com. What is Altmetric and what does it provide? [cited 2023 26 June]. Available from: https://help.altmetric.com/support/solutions/articles/6000232837-what-is-altmetric-and-what-does-it-provide-.
- Powell A, Bevan V, Brown C, et al. Altmetric versus bibliometric perspective regarding publication impact and force. World J Surg. 2018;42(9):2745–2756. Sep doi:10.1007/s00268-018-4579-9.
- Robinson DBT, Powell A, Waterman J, et al. Predictive value of altmetric score on citation rates and bibliometric impact. BJS Open. 2021;5(1):zraa039. doi:10.1093/bjsopen/zraa039.
- Pal A, Rees TJ. Introducing the EMPIRE index: a novel, value-based metric framework to measure the impact of medical publications. PLoS One. 2022;17(4):e0265381. doi:10.1371/journal.pone.0265381.
- Rees T, Pal A. Does the impact of medical publications vary by disease indication and publication type? An exploration using a novel, value-based, publication metric framework: the EMPIRE index [version 3; peer review. F1000Res. 2023;11(:107. doi:10.12688/f1000research.75805.3.
- Rees T, Lang H, Gattrell W. Tool to measure real-world publication reach, engagement, and impact. Presented at the 17th Annual Meeting of the International Society for Medical Publication Professionals (ISMPP), April 12–142021 Virtual meeting).
- Lang H, Gordon J, Gattrell W. Effect of simultaneous congress presentation and journal publication on media interest and article impact: a case study. Presented at the 2022 European Meeting of the International Society for Medical Publication Professionals (ISMPP), 25–26 January, 2022 (Virtual meeting).
- Nicholson JM, Mordaunt M, Lopez P, et al. Scite: a smart citation index that displays the context of citations and classifies their intent using deep learning. Quant Sci Stud. 2021;2(3):882–898. doi:10.1162/qss_a_00146.
- American Society for Cell Biology. San Francisco Declaration on Research Assessment [cited 2023 26 June]. Available from: https://sfdora.org/read/.
- Patel RB, Vaduganathan M, Bhatt DL, et al. Characterizing high-Performing articles by altmetric score in major cardiovascular journals. JAMA Cardiol. 2018;3(12):1249–1251. Dec 1 doi:10.1001/jamacardio.2018.3823.
- Valderrama-Baca P, Arroyo-Machado W, Torres-Salinas D. Altmetrics can capture research evidence: an analysis across types of studies in COVID-19 literature. Profesional de la Información. 2023; 03/1532(2):e320213.
- Delahunty M. Social media and altmetrics:the pharma perspective. Med Writ. 2021;30(1):56–60.
- Altmetric.com. The rise of the Digital Opinion Leader [cited 2023 26 June]. Available from: https://www.altmetric.com/blog/the-rise-of-the-digital-opinion-leader/.
- scite.ai. Pharmaceuticals and biotech [cited 2023 27 June]. Available from: https://scite.ai/partners/pharmaceuticals-and-biotech.
- Rees T. Obtaining meaningful insights from publication metrics. Med Writ. 2022;31(4):50–53. doi:10.56012/vjht8689.
- He L, Yin T, Zheng K. They may not work! an evaluation of eleven sentiment analysis tools on seven social media datasets. J Biomed Inform. 2022; Aug132:104142. doi:10.1016/j.jbi.2022.104142.
- Tomasoni D, Coats AJS. The altmetric attention score: how science tries to meet social media. Eur J Heart Fail. 2021; May23(5):693–697. doi:10.1002/ejhf.2136.