ABSTRACT
Metabolic syndrome is a risk factor for osteoarthritis. Elevated leptin levels have been implicated as a potential cause of this association. Previous studies have shown that supra-physiological leptin concentrations can induce osteoarthritis-like changes in chondrocyte phenotype. Here, we tested the effects of leptin in the concentration range found in synovial fluid on chondrocyte phenotype. Chondrocytes isolated from macroscopically normal regions of cartilage within osteoarthritic joints from patients undergoing knee arthroplasty, all with body mass index >30 kg/m2 were treated with 2-40 ng/ml leptin for 24 h. Chondrocyte phenotype marker expression was measured by RT-qPCR and western blot. The role of HES1 in mediating the effects of leptin was determined by gene knockdown using RNAi and over-expression using adenoviral-mediated gene delivery. Treatment of chondrocytes with 20 or 40 ng/ml leptin resulted in decreased SOX9 levels and decreased levels of the SOX9-target genes COL2A1 and ACAN. Levels of HES1 were lower and ADAMTS5 higher in chondrocytes treated with 20 or 40 ng/ml leptin. HES1 knockdown resulted in increased ADAMTS5 expression whereas over-expression of HES1 prevented the leptin-induced increase in ADAMTS5. An increase in MMP13 expression was only evident in chondrocytes treated with 40 ng/ml leptin and was not mediated by HES1 activity. High concentrations of leptin can cause changes in chondrocyte phenotype consistent with those seen in osteoarthritis. Synovial fluid leptin concentrations of this level are typically observed in patients with metabolic syndrome and/or women, suggesting elevated leptin levels may form part of the multifactorial network that leads to osteoarthritis development in these patients.
Introduction
Osteoarthritis is the leading cause of physical disability in adultsCitation1, affecting over 500 million people worldwideCitation2. A key pathological feature of osteoarthritis is loss of articular cartilage. Disease affects all tissues within the joint. One of the consequences of the altered joint environment in osteoarthritis is a change in the activity of chondrocytes within cartilage. Normally chondrocytes have a crucial role in maintaining the integrity of cartilage however in osteoarthritis they produce high amounts of cartilage degrading enzymes, contributing to cartilage loss. This change in chondrocyte activity is at least partially due to intrinsic/epigenetic factors as osteoarthritic chondrocytes retain a different phenotype marker expression profile than normal chondrocytes even after in vitro cell culture. However, acute responses of chondrocytes to factors in the diseased joint environment can also result in loss of normal chondrocyte behavior and upregulation of cartilage degrading enzyme production.
Metabolic syndrome has long been associated with increased risk of osteoarthritisCitation3. Historically this was attributed to obesity-associated excess mechanical loading on joints. However, metabolic syndrome and obesity have since been established as a risk factors for osteoarthritis in both load-bearing and non-load bearing jointsCitation4 and it is now well-recognized that biological factors, not just mechanical factors, contribute to this associationCitation3.
Leptin is an adipokine produced by adipose tissue as well as cells in several other tissues including cartilage, bone and the synovium. The concentration of leptin in synovial fluid has consistently been shown to be elevated in OACitation5. In non-OA joints, leptin has been detected in synovial fluid at pg/ml concentrationsCitation6. In contrast, the mean reported leptin concentration in OA joints ranges from 1.6 ng/ml to 32.2 ng/ml with 65.8 ng/ml the maximum concentration reportedCitation6–10. People with metabolic syndrome and/or high BMI are more likely to have synovial fluid leptin concentrations at the upper limits of this rangeCitation11. Concentrations also tend to be higher in women compared to men. For example, three studies have reported mean synovial fluid leptin concentrations of 5.4, 5.3 and 9.49 ng/ml in male patients with OA but concentrations of 22.9, 19.3 and 20.77 ng/ml respectively in female patients with OACitation8–10.
Several studies have demonstrated that leptin can have deleterious effects on chondrocytes, promoting OA-like changes. In particular, acute exposure to leptin has been shown to inhibit expression of SOX9, a transcription factor required for maintenance of normal chondrocyte phenotype and to promote the expression of MMP13 and ADAMTS5, two major enzymes responsible for cartilage degradation in osteoarthritisCitation12–14. Hence, elevated leptin levels have been implicated as a possible contributory mechanism in metabolic syndrome-induced osteoarthritis risk.
Much of the early work describing the effects of leptin on chondrocytes was conducted before accurate estimates of synovial fluid leptin concentrations were available and, in many cases, supraphysiological leptin concentrations (≥100 ng/ml) have been used. This is an important consideration when interpreting findings as the effects of leptin are known to be concentration dependentCitation12,Citation15. Of note, one study demonstrated that while supraphysiological concentrations of leptin induced pathological changes in primary porcine chondrocytes, physiological concentrations did notCitation12. It is therefore timely to reexamine the effects of leptin on human chondrocytes.
The effects of leptin have also been shown to vary substantially in different types of chondrocytesCitation16. In studying the possible role of leptin in osteoarthritis development, the effects of leptin on chondrocyte cell lines, normal primary chondrocytes from both animal as well as human sources and osteoarthritic chondrocytes have been examinedCitation12,Citation13,Citation17–22. However, to our knowledge, the effects of leptin on chondrocytes from macroscopically normal human cartilage adjacent to osteoarthritic lesions in joints have not been examined. This cell population is relevant as chondrocytes from this region display a phenotype more similar to that of healthy adult chondrocytes when cultured in vitro with higher expression of SOX9 and lower expression of MMP13 and ADAMTS5 than osteoarthritic chondrocytesCitation23,Citation24. However, in vivo, these cells are exposed to the diseased environment. Determining whether leptin exposure causes an increase in cartilage-degrading enzyme expression in these cells is of relevance for understanding the role of leptin on osteoarthritis progression. The purpose of this study was to determine the effect of leptin in concentrations found in synovial fluid on OA-related phenotype marker expression in human chondrocytes isolated from macroscopically normal regions of cartilage within osteoarthritic joints.
Materials and methods
Human chondrocyte isolation
Cartilage was obtained with written informed consent from patients with osteoarthritis undergoing total knee replacement surgery at Auckland City or Mercy Hospitals, Auckland, New Zealand. Ethical approval for tissue collection was granted by the Health and Disability Ethics Committee (HDEC) (approval numbers NTX0506058 and 21CEN191). Patients were aged between 63 and 83 years; 50% male, 50% female. Participants were included in the analysis if their body mass index (BMI) measured >30 kg/m2; (range 30.2–42.0).
Within each joint, regions of tissue were classified as either macroscopically normal or severely damaged using the Modified Mankin scoring systemCitation25. Cartilage from the two regions was collected from each donor and chondrocytes were isolated as previously describedCitation23. Briefly, cartilage was dissected from the bone and cut into small pieces with a scalpel before digestion in 1 mg/ml collagenase at 37 °C for 18 h. Following thorough washing, chondrocytes were plated at 50,000 cells/ml in DMEM (5 mM glucose, with L-glutamine and sodium pyruvate; catalog number 10,567,022, ThermoScientific, Malvern, Ca, USA) supplemented with 5% FBS and 1% penicillin/streptomycin and allowed to grow until 70–80% confluence (approximately 70,000–80,000 cells/ml). Cells were stored in liquid nitrogen until required and used at passage 1 for experiments.
Leptin treatment
Endotoxin-free recombinant human leptin dissolved in water was a kind gift from Prof Jillian Cornish, University of Auckland. Cells were seeded at 50,000 cells per ml in DMEM/5% FBS and treated with 2, 5, 10, 20 or 40 ng/ml leptin for 24 h with untreated cells serving as controls. The concentration range of leptin chosen for use in this study was based on measurements of the synovial fluid leptin concentrations in previous publicationsCitation7–10.
Real time RT-Qpcr
cDNA was prepared using a direct cells-to-cDNA method. Cells were lysed using Cell Lysis Buffer II (ThermoScientific, Malvern, Ca, USA) following the manufacturer’s instructions. Following DNase treatment, cDNA was synthesized using MMLV reverse transcriptase and random primers. Real time PCR was carried out using SYBR select master mix (ThermoScientific, Malvern, Ca, USA) on a QuantStudio 12K flex real time PCR machine (ThermoScientific, Malvern, Ca, USA). Data were analyzed by the ΔΔCT method using ribosomal 18S as the reference gene. Primers used for real time PCR are provided in .
Table 1. Sequences for primers used for real time PCR.
Western blotting
Cells were lysed in RIPA buffer supplemented with sodium orthovanadate, sodium fluoride and phenylmethylsulfonyl fluoride (0.1 M each). Th protein concentration in each sample was measured using the Pierce 660 Protein Assay following the manufacturer’s instructions (ThermoScientific, Malvern, Ca, USA). Equal amounts of protein were loaded on to SDS-PAGE gels and subject to electrophoresis. Samples were transferred to PVDF membranes using standard western blotting protocols. Membranes were probed with primary antibodies targeting SOX9 (Abcam, Cambridge, UK; catalog number ab -185,966) or HES1 (Abcam, Cambridge, UK; catalog number ab71559, dilution 1:1000 for both) and antibody binding detected by chemiluminescence using a Biorad Imager. Blots were analyzed by band densitometry using β-actin as the loading control.
Adenoviral transduction
Human chondrocytes were transduced with an adenoviral vector bearing the human HES1 gene insert (catalog number ADV210965, Vector Biolabs). A GFP adenoviral vector was used as a control. Chondrocytes were plated at 50,000 cells per ml and allowed to adhere overnight. For gene transduction, chondrocytes were incubated with viral vector (MOI35) and Fugene-HD (4 μl/50,000 cells; Promega, Madison, WI, USA) in antibiotic-free DMEM/5% FBS for 18 h. Success of viral transduction was assessed by measuring RNA expression of HES1, 48 h post-transduction. The percentage of cells successfully transduced (as measured by counting GFP-positive cells) was >90%. All viral transduction work was conducted with institutional biosafety approval in full compliance with national biosafety guidelines. For experiments involving leptin treatment of adenoviral-transduced cells, cells were incubated with viral vector for 18 h as described above, then media changed to fresh DMEM/5% FBS for 24 h before treating with leptin (40 ng/ml) for an additional 24 h.
Gene knockdown by RNAi
Human chondrocytes were transfected with siRNA targeting HES1 (siHES1, catalog number EHU013081, Merck Group, St Louis, Mo, USA) or GFP-targeting control siRNA (siCntrl, catalog number EHUEGFP, Merck Group, St Louis, Mo, USA) using lipofectamine RNAimax ((ThermoScientific, Malvern, Ca, USA)) following the manufacturers guidelines. The siRNA amount used was 18pmol/5,000 cells. Approximately 70% of the cell population were successfully transfected as assessed by measuring cell death following transfection with siRNA targeting laminin A. The success of HES1 knockdown was confirmed by measuring HES1 mRNA levels 24 h post-transfection. For experiments involving leptin treatment of transfected cells, cells were incubated with siRNA and transfection reagent for 18 h as described above. Cells were media changed to fresh DMEM/5% FBS and incubated for 24 h to allow substantial gene knockdown to occur, then treated with leptin (40 ng/ml) for an additional 24 h. Untreated cells served as controls. In these experiments, success of HES1 knockdown was confirmed by measuring HES1 mRNA levels following the 24 h leptin treatment period i.e., 48 h post-transfection.
Comparison of effects of leptin in male and female chondrocytes
Chondrocytes isolated from eight female and eight male donors were seeded in replicate wells in the same plate (50,000 cells/ml) and either left untreated or treated with leptin (2, 5, 10, 20 or 40 ng/ml) for 24 h. The effects on phenotype marker expression were measured by RT-qPCR.
Statistical analysis
All data were analyzed using GraphPad Prism 9.0.2. Data found to conform to the requirements for the general linear model were analyzed by one-way ANOVA with post-hoc Dunnett’s testing (for comparisons to a single untreated control) or post-hoc Šídák’s testing (for multiple comparisons between groups). Non-parametric data were analyzed by Kruskal–Wallis test with post-hoc Dunn’s testing. A t-test was used for comparisons of a single treatment to control. A P-value of <0.05 was considered statistically significant.
Results
Chondrocytes from macroscopically normal cartilage within osteoarthritic joints display a distinctly different phenotype marker expression profile compared to chondrocytes from osteoarthritic lesions
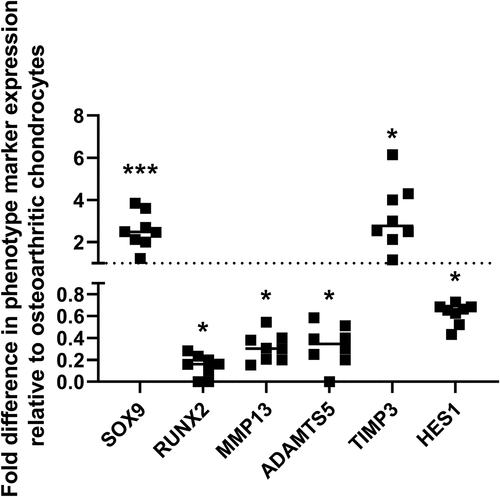
Expression of SOX9 and TIMP3 were significantly higher, whereas expression of RUNX2, MMP13 and ADAMTS5 were significantly lower, in chondrocytes isolated from macroscopically normal cartilage compared to chondrocytes isolated from osteoarthritic cartilage confirming the phenotypic difference in cells isolated from the two tissue regions ().
Figure 1. Expression of phenotype marker genes in chondrocytes isolated from macroscopically normal regions of cartilage in an osteoarthritic joint compared to chondrocytes isolated from the osteoarthritic cartilage lesion. Using RT-Qpcr, expression of SOX9, RUNX2, MMP13, ADAMTS5 and TIMP3 were measured in chondrocytes isolated from macroscopically normal and osteoarthritic cartilage regions within osteoarthritic joints. Data shown are the relative fold difference in expression in chondrocytes from macroscopically normal cartilage compared to osteoarthritic cartilage, n = 8.
Physiologically relevant concentrations of leptin result in repression of SOX9 expression in human chondrocytes isolated from macroscopically normal cartilage
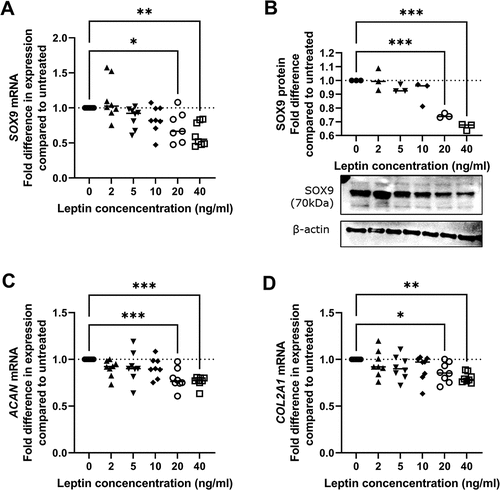
mRNA levels of SOX9 were significantly lower in chondrocytes treated with 20 ng/ml or 40 ng/ml leptin for 24 h compared to untreated controls (). Similarly, protein levels of SOX9 were also significantly lower in chondrocytes treated with 20 ng/ml or 40 ng/ml leptin compared to untreated controls (). Expression of COL2A1 and ACAN, two SOX9 target genesCitation26, were also significantly lower in chondrocytes treated with 20 or 40 ng/ml leptin compared to untreated controls ().
Figure 2. Effect of leptin on expression of SOX9 and SOX9-target genes in chondrocytes. Chondrocytes were treated with leptin at concentrations of 2, 5, 10, 20 or 40 ng/ml for 24 h before measurement of A SOX9 mRNA levels by RT-Qpcr (n = 8), B SOX9 protein levels with representative western blot (n = 3) and RNA levels of the SOX9-target genes C ACAN and D COL2A1 by RT-Qpcr (n = 8 for both). Statistically significant differences between treated groups and untreated controls are shown on each graph as * (P < 0.05), ** (P < 0.01) or *** (P < 0.001).
High concentrations of leptin result in increased ADAMTS5 and MMP13 expression in human chondrocytes isolated from macroscopically normal cartilage
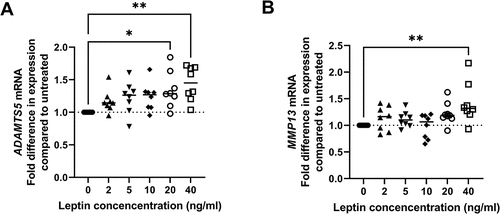
Treatment of human chondrocytes with leptin in concentrations of 2, 5 or 10 ng/ml had no significant effect on ADAMTS5 expression. However, treatment with 20 or 40 ng/ml resulted in a modest increase in ADAMTS5 RNA levels (). MMP13 mRNA levels were significantly higher than untreated controls in chondrocytes treated with 40 ng/ml leptin but not in chondrocytes treated with lower leptin concentrations ().
Figure 3. Effect of leptin on expression of ADAMTS5 and MMP13 in chondrocytes. Chondrocytes were treated with leptin at concentrations of 2, 5, 10, 20 or 40 ng/ml for 24 h before measurement of A ADAMTS5 and B MMP13 by RT-1PCR (n = 8). Statistically significant differences between treated groups and untreated controls are shown on each graph as * (P < 0.05), ** (P < 0.01) or *** (P < 0.001).
Leptin has concentration-dependent effects on HES1 expression in human chondrocytes
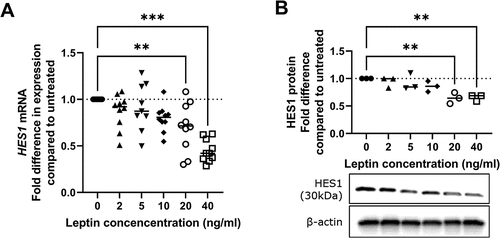
HES1 is a transcriptional regulator of ADAMTS5 and MMP13 Citation27 and has previously been shown to be modulated by leptin in other cell typesCitation28,Citation29. We found RNA levels of HES1 were significantly lower in human chondrocytes treated with 20 or 40 ng/ml leptin but not in chondrocytes treated with lower leptin concentrations (). By western blot, protein levels of HES1 were also found to be significantly lower in chondrocytes treated with leptin at concentrations of 20 or 40 ng/ml but not in chondrocytes treated with lower leptin concentrations ().
Figure 4. HES1 expression following leptin treatment of chondrocytes. Chondrocytes were treated with leptin at concentrations of 2, 5, 10, 20 or 40 ng/ml for 24 h before measurement of A HES1 RNA levels by RT-Qpcr (n = 8) and B HES1 protein levels by western blotting (n = 3). Western blot shown is representative of results for all patients. Statistically significant differences between treated groups and untreated controls are shown on each graph as * (P < 0.05), ** (P < 0.01) or *** (P < 0.001)..
The effects of leptin on ADAMTS5 are at least partially mediated through HES1
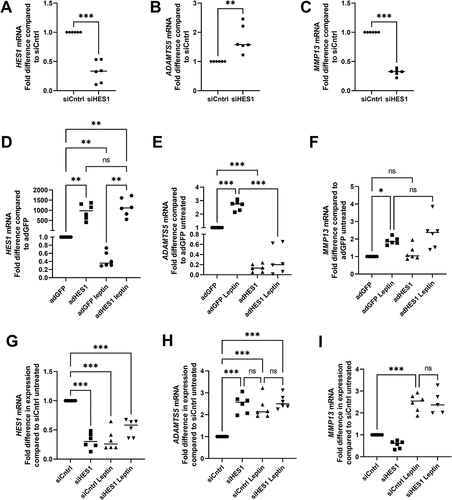
To determine whether reduced HES1 levels contributed to the mechanism by which leptin regulated ADAMTS5 and/or MMP13, we firstly knocked down HES1 in non-leptin treated human chondrocytes using RNAi (). Knockdown of HES1 resulted in a significant increase in ADAMTS5 mRNA levels () but a significant reduction in MMP13 levels in untreated chondrocytes (). To determine the effects of HES1 in leptin-treated chondrocytes, HES1 was over-expressed using adenoviral vector-mediated gene delivery (adHES1) () and cells were treated with/without 40 ng/ml leptin for 24 h. Control cells were transduced with an adenoviral vector bearing a GFP construct (adGFP). Treatment with leptin resulted in elevated ADAMTS5 expression in adGFP-control cells but not in chondrocytes transduced to over-express HES1 (adHES1) (). ADAMTS5 expression was also significantly lower in untreated chondrocytes overexpressing HES1 compared to GFP controls (). In contrast, MMP13 mRNA levels were not significantly different between leptin-treated chondrocytes transduced to over-express HES1 and GFP-expressing controls (). MMP13 mRNA levels were also not significantly different between untreated chondrocytes over-expressing HES1 compared to GFP-expressing controls (). Finally, the effect of leptin (40 ng/ml, 24 h) was determined on chondrocytes in which HES1 had been knocked down. HES1 levels were similarly reduced following either HES1 knockdown (siHES1) or leptin treatment (siCntrl leptin) compared to controls (siCntrl). There was no further reduction in HES1 levels when chondrocytes were transfected with HES1-targetting siRNA and treated with leptin (siHES1 leptin) (). ADAMTS5 levels were significantly higher than siCntrl in the siCntrl leptin and siHES1 treatment groups. There was no further increase in ADAMTS5 levels in chondrocytes transfected with HES1-targetting siRNA and treated with leptin (siHES1 leptin) (). Expression of MMP13 was not significantly different between leptin treated chondrocytes transfected with siCntrl and leptin-treated chondrocytes transfected with siHES1 ().
Figure 5. Role of HES1 in leptin-mediated effects on ADAMTS5 and MMP13. HES1 was knocked down in chondrocytes isolated from macroscopically normal cartilage region within osteoarthritic joints by RNAi and expression of A HES1 B ADAMTS5 and C MMP13 measured by RT-Qpcr 24 h post-transfection. HES1 was over-expressed using adenoviral mediated gene delivery (adHES1) in chondrocytes with control cells infected with an adenoviral vector for GFP (adGFP). Expression of D HES1 was measured 48 h post-transduction by RT-Qpcr. Twenty-four hours post-adenoviral transduction, chondrocytes transduced with the adHES1 and adGFP vectors were incubated with/without 40 ng/ml leptin for 24 h before measurement of E ADAMTS5 and F MMP13 by RT-Qpcr.. (n = 8 for all). Chondrocytes were transfected with HES-1 targeting (siHES1) or non-targeting control siRNA (siCntrl). Twenty-four hours post-transfection, chondrocytes were treated with leptin (40 ng/ml) for an additional 24 h then G HES1, H ADAMTS5 and I MMP13 expression measured by RT-Qpcr (n = 6 for all). Statistically significant differences between treated groups and untreated controls are shown on each graph as * (P < 0.05), ** (P < 0.01), *** (P < 0.001) or ns (non-significant).
Both basal expression of SOX9 and the effects of high leptin on SOX9 expression differ between chondrocytes isolated from female compared to male patients.
Finally, as leptin levels tend to be higher in females than males in vivoCitation30, we compared the sensitivity of female and male chondrocytes to leptin. In non-leptin treated cells, expression of SOX9 and COL2A1 were significantly lower in female compared to male chondrocytes () indicating a difference in basal expression of these two genes between males and females ().
Figure 6. Comparison of effects of leptin on chondrocytes from male versus female donors. Chondrocytes were isolated from macroscopically normal cartilage within osteoarthritic joints from eight female and eight male donors. Chondrocytes from each donor were treated with leptin (2, 5, 10, 20 or 40 ng/ml) and chondrocyte phenotype marker expression measured by RT-Qpcr and compared to levels in untreated controls. A expression of chondrocyte phenotype markers in untreated chondrocytes from male compared to female donors. Magnitude of fold change in gene expression following leptin treatment for B SOX9, C COL2A1, D ACAN, E HES1, F MMP13 and G ADAMTS5 in male compared to female chondrocytes. Statistically significant differences (P < 0.05) between males and females are marked as *. All other comparisons were not significantly different (P > 0.05).
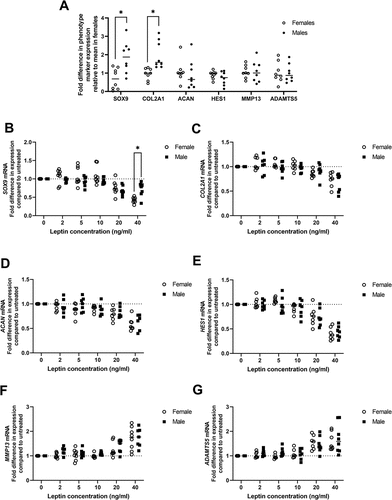
To compare the magnitude of effect of leptin on phenotype marker expression between males and females, the fold change in expression of each gene in leptin-treated chondrocytes relative to untreated chondrocytes for each patient donor was calculated. Chondrocytes from female donors showed a significantly greater magnitude of reduction in SOX9 expression than chondrocytes from male donors when treated with 40 ng/ml leptin (). There were no significant differences between male and female chondrocytes in the magnitude of effect of leptin treatment on any of the other phenotype markers measured or at any other leptin concentration ().
Discussion
The purpose of this study was to determine the effects of the adipokine leptin in concentrations equivalent to those found in synovial fluid in vivo on OA-relevant phenotype marker expression in chondrocytes isolated from the macroscopically normal region of cartilage within osteoarthritic joints. We found that treatment of chondrocytes from macroscopically normal cartilage with leptin at concentrations of 20 or 40 ng/ml (but not lower concentrations) resulted in a significant decrease in SOX9 expression evident at both the RNA and protein level 24 h post-treatment. Similarly, a modest reduction in mRNA levels of the SOX9 target genes ACAN (encoding aggrecan) and COL2A1 (encoding type II collagen) was also evident at this timepoint in chondrocytes treated with 20 or 40 ng/ml leptin. Leptin in concentrations of 10–1000 ng/ml has previously been shown to reduce SOX9, COL2A1 and ACAN expression in murine vertebral growth plate chondrocytesCitation16. However in tibial growth plate chondrocytes, expression of all three genes was increased by leptin treatmentCitation16 and in human OA chondrocytes, high concentrations of leptin (≥100 ng/ml) increased expression of COL2A1 whereas lower concentrations (20 ng/ml) had no effectCitation15. It is possible that the differing effects of leptin observed on SOX9 and/or COL2A1 between studies are at least partly a consequence of differences in basal expression of these markers between chondrocytes from different cartilage sources. For instance, SOX9 expression has been shown to differ in vertebral compared to growth plate chondrocytesCitation16 just as we showed that SOX9 levels also differ between chondrocytes from macroscopically normal and OA cartilage. Similar to previous findings in chondroprogenitorsCitation31, here we found that SOX9 expression differed between chondrocytes from females compared to males and that at the highest leptin concentration tested in this study (40 ng/ml), female chondrocytes exhibited a greater magnitude of reduction in SOX9 compared to male chondrocytes. Taken together these findings suggest that the effects of leptin may differ depending on the initial phenotype of chondrocytes as well as the concentration of leptin treatment.
At concentrations of 20 or 40 ng/ml, we found leptin treatment resulted in a significant increase in ADAMTS5 expression, however an increase in MMP13 was only evident with a concentration of 40 ng/ml leptin. We found no indication that the effects of leptin on ADAMTS5 and MMP13 differed between the sexes. High concentrations of leptin (100–1000 ng/ml) have previously been shown to result in increased ADAMTS5 expression in OA chondrocytesCitation13. Our data adds to these findings, demonstrating that at concentrations at the upper limits of the range observed in synovial fluid (20–40 ng/ml), leptin can also induce ADAMTS5 expression in chondrocytes from macroscopically normal cartilage within OA joints. One previous study has reported increases in MMP13 transcript levels following treatment of the SW1353 cell line or human chondrocytes with 5 ng/ml leptin for 24 hCitation19. However, a larger study involving 46 patient donors found at a concentration of 20 ng/ml, leptin was a weak inducer of MMP13, and effects were only apparent in OA chondrocytes from patients with BMI >30. No increase in MMP13 expression was observed in chondrocytes with BMI <30 at any leptin concentrationCitation15. Although all patients in the present study had BMI >30, we only detected a significant effect of leptin on MMP13 expression at a concentration of 40 ng/ml. This may indicate that chondrocytes from macroscopically normal cartilage (which have lower basal MMP13 expression than chondrocytes from OA cartilage), are less responsive to leptin-mediated effects on MMP13 than OA chondrocytes.
In other tissues, leptin has been shown to influence the expression of HES1Citation28,Citation29, a transcriptional regulator which is also implicated in osteoarthritis developmentCitation27. Two of the target genes of HES1 are ADAMTS5 and MMP13, however to our knowledge the effects of leptin on HES1 have not previously been examined in chondrocytes. Here we found that treatment of chondrocytes with leptin in concentrations of 20 or 40 ng/ml resulted in reduced RNA and protein levels of HES1. This differs from what has been reported in other cell types. In murine neuronal cells, 100 ng/ml leptin was found to promote HES1 expressionCitation29 and in glial cells, 500 ng/ml leptin resulted in increased HES1 RNA and protein levelsCitation28. Whether the difference in effect of leptin on HES1 observed in the present study compared to previous studies is a consequence of cell-type specific differences in response to leptin, or concentration-dependent effects of leptin, remains to be established.
HES1 is predominantly a transcriptional repressorCitation32. However, association with a specific binding partner (calcium/calmodulin kinase II, CaMKII) switches the activity of HES1 such that it promotes rather than represses gene transcriptionCitation27. In murine OA chondrocytes, this has been shown to lead to HES1-mediated promotion of ADAMTS5 and MMP13 expressionCitation27. The effects of HES1 in human chondrocytes from macroscopically normal cartilage have not previously been studied. In contrast to OA chondrocytes, we found that HES1 acts as a transcriptional repressor of ADAMTS5 in chondrocytes from macroscopically normal cartilage. Although we did not study HES1 binding partner association, a possible explanation for this finding is that HES1 binding partners differ in chondrocytes from OA compared to macroscopically normal cartilage. Our data indicate that leptin-mediated repression of HES1 contributed to the mechanism by which leptin upregulated ADAMTS5 expression in chondrocytes from macroscopically normal cartilage.
In contrast to our findings for ADAMTS5, we found that HES1 promoted MMP13 expression in chondrocytes from macroscopically normal cartilage. This suggests that the mechanism by which HES1 regulates MMP13 differs from that of ADAMTS5. In support, previous studies have shown that while the ADAMTS5 gene sequence contains a typical HES1 consensus binding site, there is no identifiable consensus sequence for HES1 binding within the MMP13 gene sequenceCitation27. Although it might be expected that the leptin-induced reduction in HES1 levels would limit the ability of leptin to induce MMP13 expression, we found HES1 over-expression had no significant effect on MMP13 expression in either leptin-treated or non-leptin treated chondrocytes. Overall, our data suggest HES1 is not a major regulator of MMP13 in leptin-treated chondrocytes. Previous studies have implicated NF-κB activity and/or SMAD 1/5 signaling as mediators of the effect of leptin on MMP13 expression in osteoarthritic chondrocytes and/or the SW1353 human chondrocyte cell lineCitation12,Citation19. These pathways may also be involved in mediating the effects of leptin on MMP13 in chondrocytes from macroscopically normal cartilage.
In the present study, synovial fluid leptin concentrations were used as an indicator of the possible concentration range of leptin to which chondrocytes may be exposed in vivo. However, the ability of leptin to diffuse through the cartilage matrix will also influence the extent of leptin exposure in vivo. Although molecules of a greater size than leptin have been shown to be able to diffuse into cartilage, the rate of diffusion is inversely proportional to molecule sizeCitation33. This may mean that the extent of leptin exposure of chondrocytes in vivo differs depending on their location within cartilage and chondrocytes may be exposed to a lower concentration of leptin than is present in synovial fluid. Synovial fluid leptin levels of up to 65.8 ng/ml have been reported in patients with osteoarthritisCitation10, and in the present study we found leptin concentrations of 20–40 ng/ml could induce disease relevant changes in gene expression in chondrocytes isolated from macroscopically normal cartilage from osteoarthritic joints. This suggests that in patients with very high synovial fluid leptin levels, leptin may contribute to inducing phenotypic changes in chondrocytes although how far the effects of leptin permeate through cartilage remains to be determined. High leptin concentrations are more typically found in women than in men and in patients with high BMI and/or metabolic syndromeCitation8–11. Therefore, our data provide support for the hypothesis that high leptin levels may have a role in the mechanism by which metabolic syndrome increases the risk of osteoarthritis. Our data also suggest that higher synovial fluid leptin concentrations found in women may be a risk factor for osteoarthritis development. Such findings are of potential importance as osteoarthritis is more prevalent in women than in menCitation34 and in individuals with metabolic syndromeCitation3.
Acknowledgments
The authors gratefully acknowledge Prof Jillian Cornish, University of Auckland for the donation of leptin for use in this study.
Disclosure statement
No potential conflict of interest was reported by the authors.
Additional information
Funding
References
- Wittenauer R, Smith L, Aden K Priority medicines for Europe and the world “A public health approach to innovation” update on 2004 background paper 6.12 osteoarthritis. 2013.
- Long H, Liu Q, Yin H, Wang K, Diao N, Zhang Y, Lin J, Guo A. Prevalence Trends of site-specific osteoarthritis from 1990 to 2019: findings from the global burden of disease study 2019. Arthritis Rheum. 2022;74(7):1172–1183. doi:10.1002/art.42089.
- Zhuo Q, Yang W, Chen JY, Wang Y. Metabolic syndrome meets osteoarthritis. Nat Rev Rheumatol. 2012;8(12):729–737. doi:10.1038/nrrheum.2012.135.
- Reyes C, Leyland KM, Peat G, Cooper C, Arden NK, Prieto-Alhambra D. Association between overweight and obesity and risk of clinically diagnosed knee, hip, and hand osteoarthritis: a population-based cohort study. Arthritis Rheum. 2016;68(8):1869–1875. doi:10.1002/art.39707.
- Wang C, Song S, Zhang Y, Ge Y, Fang X, Huang T, Du J, Gao J. Inhibition of the Rho/Rho kinase pathway prevents lipopolysaccharide-induced hyperalgesia and the release of TNF-α and IL-1β in the mouse spinal cord. null. 2015;5(1):14553. doi:10.1038/srep14553.
- Beekhuizen M, Gierman LM, van Spil WE, Van Osch GJVM, Huizinga TWJ, Saris DBF, Creemers LB, Zuurmond A-M. An explorative study comparing levels of soluble mediators in control and osteoarthritic synovial fluid. Osteoarthritis Cartilage. 2013;21(7):918–922. doi:10.1016/j.joca.2013.04.002.
- Massengale M, Lu B, Pan JJ, Katz JN, Solomon DH. Adipokine hormones and hand osteoarthritis: radiographic severity and pain. PLos One. 2012;7(10):e47860. doi:10.1371/journal.pone.0047860.
- Presle N, Pottie P, Dumond H, Guillaume C, Lapicque F, Pallu S, Mainard D, Netter P, Terlain B. Differential distribution of adipokines between serum and synovial fluid in patients with osteoarthritis. Contribution of joint tissues to their articular production. Osteoarthritis Cartilage. 2006;14(7):690–695. doi:10.1016/j.joca.2006.01.009.
- Lübbeke A, Finckh A, Puskas GJ, Suva D, Lädermann A, Bas S, Fritschy D, Gabay C, Hoffmeyer P. Do synovial leptin levels correlate with pain in end stage arthritis? Int Orthop. 2013;37(10):2071–2079. doi:10.1007/s00264-013-1982-6.
- Staikos C, Ververidis A, Drosos G, Manolopoulos VG, Verettas D-A, Tavridou A. The association of adipokine levels in plasma and synovial fluid with the severity of knee osteoarthritis. Rheumatology. 2013;52(6):1077–1083. doi:10.1093/rheumatology/kes422.
- Dong N, Gao Y-H, Liu B, Zhao C-W, Yang C, Li S-Q, Liu J-G, Qi X. Differential expression of adipokines in knee osteoarthritis patients with and without metabolic syndrome. Int Orthop. 2018;42(6):1283–1289. doi:10.1007/s00264-018-3761-x.
- Phitak T, Boonmaleerat K, Pothacharoen P, Pruksakorn D, Kongtawelert P. Leptin alone and in combination with interleukin-1-beta induced cartilage degradation potentially inhibited by EPA and DHA. Conn Tiss Res. 2018;59(4):316–331. doi:10.1080/03008207.2017.1385605.
- Yaykasli KO, Hatipoglu OF, Yaykasli E, Yildirim K, Kaya E, Ozsahin M, Uslu M, Gunduz E. Leptin induces ADAMTS-4, ADAMTS-5, and ADAMTS-9 genes expression by mitogen-activated protein kinases and NF-ĸB signaling pathways in human chondrocytes. Cell Biol Int. 2015;39(1):104–112. doi:10.1002/cbin.10336.
- Hui W, Litherland GJ, Elias MS, Kitson GI, Cawston TE, Rowan AD, Young DA. Leptin produced by joint white adipose tissue induces cartilage degradation via upregulation and activation of matrix metalloproteinases. Annals Rheum Dis. 2012;71(3):455–462. doi:10.1136/annrheumdis-2011-200372.
- Pallu S, Francin P-J, Guillaume C, Gegout-Pottie P, Netter P, Mainard D, Terlain B, Presle N. Obesity affects the chondrocyte responsiveness to leptin in patients with osteoarthritis. Arthritis Res Ther. 2010;12(3):R112. doi:10.1186/ar3048.
- Yu B, Jiang K, Chen B, Wang H, Li X, Liu Z. Leptin differentially regulates chondrogenesis in mouse vertebral and tibial growth plates. BMC Musculoskeletal Dis. 2017;18(1):235. doi:10.1186/s12891-017-1601-6.
- Fu R, Han F, Liu L, Yu F, Gui Z, Wang X, Li B, Fang B, Xia L. The effects of leptin on the proliferation and differentiation of primary chondrocytes in vitro and cartilage regeneration in vivo. ACS Biomater Sci Eng. 2019;5(4):1907–1919. doi:10.1021/acsbiomaterials.8b01168.
- Koskinen A, Vuolteenaho K, Nieminen R, Moilanen T, Moilanen E. Leptin enhances MMP-1, MMP-3 and MMP-13 production in human osteoarthritic cartilage and correlates with MMP-1 and MMP-3 in synovial fluid from OA patients. Clinical Exp Rheum. 2011;29(1):57–64. doi:10.1016/S1063-4584(10)60038-6.
- Su Y-P, Chen C-N, Huang K-C, Chang H-I, Lee K-C, Lo C-M, Chang S-F. Leptin induces MMP1/13 and ADAMTS 4 expressions through bone morphogenetic protein-2 autocrine effect in human chondrocytes. J Cell Biochem. 2018;119(4):3716–3724. doi:10.1002/jcb.26593.
- Kishida Y, Hirao M, Tamai N, Nampei A, Fujimoto T, Nakase T, Shimizu N, Yoshikawa H, Myoui A. Leptin regulates chondrocyte differentiation and matrix maturation during endochondral ossification. Bone. 2005;37(5):607–621. doi:10.1016/j.bone.2005.05.009.
- Conde J, Scotece M, López V, Gómez R, Lago F, Pino J, Gómez-Reino JJ, Gualillo O. Adiponectin and leptin induce VCAM-1 expression in human and murine chondrocytes. PLos One. 2012;7(12):e52533. doi:10.1371/journal.pone.0052533.
- Koskinen-Kolasa A, Vuolteenaho K, Korhonen R, Moilanen T, Moilanen E. Catabolic and proinflammatory effects of leptin in chondrocytes are regulated by suppressor of cytokine signaling-3. Arthritis Res Therap. 2016;18(1):215. doi:10.1186/s13075-016-1112-0.
- Rong J, Pool B, Zhu M, Munro J, Cornish J, McCarthy GM, Dalbeth N, Poulsen R. Basic calcium phosphate crystals induce osteoarthritis-associated changes in phenotype markers in primary human chondrocytes by a calcium/calmodulin kinase 2-dependent mechanism. Calcified Tiss Int. 2019;104(3):331–343. doi:10.1007/s00223-018-0494-1.
- Rong J, Zhu M, Munro J, Cornish J, McCarthy GM, Dalbeth N, Poulsen RC. Altered expression of the core circadian clock component PERIOD2 contributes to osteoarthritis-like changes in chondrocyte activity. Chronobiol Int. 2019;36(3):319–331. doi:10.1080/07420528.2018.1540493.
- Moody HR, Heard BJ, Frank CB, Shrive NG, Oloyede AO. Investigating the potential value of individual parameters of histological grading systems in a sheep model of cartilage damage: the modified Mankin method. J Anatomy. 2012;221(1):47–54. doi:10.1111/j.1469-7580.2012.01513.x.
- Oh C, Lu Y, Liang S, Mori-Akiyama Y, Chen D, de Crombrugghe B, Yasuda H. SOX9 regulates multiple genes in chondrocytes, including genes encoding ECM proteins, ECM modification enzymes, receptors, and transporters. PLos One. 2014;9(9):e107577. doi:10.1371/journal.pone.0107577.
- Sugita S, Hosaka Y, Okada K, Mori D, Yano F, Kobayashi H, Taniguchi Y, Mori Y, Okuma T, Chang SH. Transcription factor Hes1 modulates osteoarthritis development in cooperation with calcium/calmodulin-dependent protein kinase 2. Proc Nat Acad Sci. 2015;112(10):3080–3085. doi:10.1073/pnas.1419699112.
- Panza S, Russo U, Giordano F, Leggio A, Barone I, Bonofiglio D, Gelsomino L, Malivindi R, Conforti FL, Naimo GD. Leptin and Notch signaling cooperate in sustaining glioblastoma multiforme progression. Biomolecules. 2020;10(6):886. doi:10.3390/biom10060886.
- Udagawa J, Hashimoto R, Suzuki H, Hatta T, Sotomaru Y, Hioki K, Kagohashi Y, Nomura T, Minami Y, Otani H. The role of leptin in the development of the cerebral cortex in mouse embryos. Endocrinology. 2006;147(2):647–658. doi:10.1210/en.2005-0791.
- Karvonen-Gutierrez CA, Sowers MR, Heeringa SG. Sex dimorphism in the association of cardiometabolic characteristics and osteophytes-defined radiographic knee osteoarthritis among obese and non-obese adults: nHANES III. Osteoarthritis Cartilage. 2012;20(7):614–621. doi:10.1016/j.joca.2012.02.644.
- Koelling S, Miosge N. Sex differences of chondrogenic progenitor cells in late stages of osteoarthritis. Arthritis Rheum. 2010;62(4):1077–1087. doi:10.1002/art.27311.
- Kageyama R, Ohtsuka T, Kobayashi T. The Hes gene family: repressors and oscillators that orchestrate embryogenesis. Development. 2007;134(7):1243–1251. doi:10.1242/dev.000786.
- Travascio F, Valladares-Prieto S, Jackson AR. Effects of solute size and tissue composition on molecular and macromolecular diffusivity in human knee cartilage. Osteoarthritis Cartilage Open. 2020;2(4):100087. doi:10.1016/j.ocarto.2020.100087.
- Srikanth VK, Fryer JL, Zhai G, Winzenberg TM, Hosmer D, Jones G. A meta-analysis of sex differences prevalence, incidence and severity of osteoarthritis. Osteoarthritis Cartilage. 2005;13(9):769–781. doi:10.1016/j.joca.2005.04.014.
