
Abstract
Two ultrasound survey methods were used to determine the presence and activity patterns of New Zealand long-tailed bats (Chalinolobus tuberculatus) in the city of Hamilton. First, 13 monthly surveys conducted at 18 green spaces found C. tuberculatus in only one urban forest reserve, Hammond Bush, where they were found consistently throughout the year. Bat activity was strongly related to temperature. Second, twice-yearly citywide surveys conducted over 2 years determined the distribution and habitat associations of C. tuberculatus. Bats were found only in the southern part of the city and were strongly associated with the Waikato River. Bat activity was negatively correlated with housing and street light density and positively correlated with topographical complexity. In Hamilton, topographical complexity indicates the presence of gullies. Gullies probably provide foraging and roosting opportunities and connect the river to distant forest patches. These results suggest that urban habitats can be useful for bats if gullies can link these to distant habitat fragments.
Introduction
Urban areas are a complex assortment of habitat types (Adams Citation1994) and are subject to rapid changes in factors such as soil and plant cover, temperature and light regimes, water availability and background noise (Pickett et al. Citation2001). Studies on the urban ecology of bats have generally noted a negative relationship between species abundance and urbanisation, yet some species do persist in cities (Gehrt & Chelsvig Citation2003; Sparks et al. Citation2005).
The minimum requirements for bats to survive in any habitat are the presence of productive foraging grounds and appropriate roost sites (Avila-Flores & Fenton Citation2005). For some bat species, urbanisation actually increases the availability of these resources (Estrada & Coates-Estrada Citation2001). For example, Nyctalus noctula, Vespertilio murinus, Eptesicus nilssonii and Pipistrellus pipistrellus have all been recorded foraging around street lights (Rydell et al. Citation1996) and Tadarida brasiliensis is well known for its use of built structures as roosting habitats (Rosenzweig Citation2003). Other species may require the presence of habitat corridors before they are able to exploit city habitats. Edge species such as Pteronotus parnellii and Sturnira lilium use corridors for stopover foraging and resting when patches of resources are distant from each other (Estrada & Coates-Estrada Citation2001) and connectivity provided by tree networks are thought to be beneficial for urban Pipistrellus pipistrellus (Hale et al. Citation2012). Habitat requirements can also change with time, over seasons, with the reproductive cycle or due to hibernation. Such factors may all influence the distribution of bats in a city and the ability of researchers to detect them (Estrada & Coates-Estrada Citation2002).
In New Zealand, the endemic species Chalinolobus tuberculatus is becoming increasingly rare (O'Donnell Citation2000a) and is listed as Nationally Vulnerable under the New Zealand Threat Classification System (O'Donnell et al. Citation2009). It has been suggested that this decline started predominantly as a result of habitat loss, particularly roosting sites, and has continued through ongoing pressure from introduced mammals and the degradation and disturbance of remaining habitats (Daniel & Williams Citation1984; O'Donnell & Sedgeley Citation1999; O'Donnell Citation2001b; O'Donnell et al. Citation2009). Additionally, a lack of public reporting on C. tuberculatus in cities led to the conclusion that the species had become extinct in urban habitats (King Citation2005). However, historical anecdotes recorded by the New Zealand Department of Conservation (DOC) indicated that C. tuberculatus may persist in some cities (Department of Conservation Citation2007).
Ultrasound surveys are a useful method for confirming bat presence and documenting the distribution and habitat associations of bats (Miller & Andersen Citation1984). These surveys are particularly effective in New Zealand where the two extant species of bat, C. tuberculatus and Mystacina tuberculata have distinctive echolocation frequencies (peak amplitude at 40 kHz and 28 kHz, respectively, Parsons Citation1997). This study used two methods of ultrasound survey. First, monthly surveys were conducted at 18 of Hamilton's green spaces with the aim of documenting the presence of and any seasonality in C. tuberculatus in the city. Second, citywide surveys were undertaken with the aim of describing the distribution and habitat associations of C. tuberculatus in Hamilton at the 1 km2 scale.
Methods
Study area
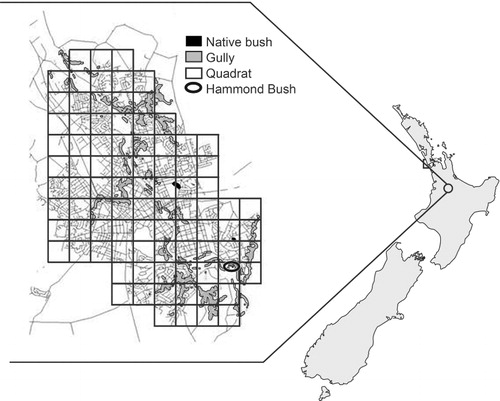
The city of Hamilton is situated in the centre of the Hamilton Ecological District (159,376 ha) in the North Island of New Zealand (37°48′S, 175°18′E) (Clarkson & McQueen Citation2004) (). At the time of study, the city had a population of 122,000 and a land area of 9400 ha. Green spaces within the city limits include forest remnants, such as Hammond Bush, gulley systems, small lakes and the Waikato River (Clarkson et al. Citation2002). Hamilton also contains a network of parks and playing fields dominated by exotic flora. The remaining area is dominated by suburban development and light industrial zones.
Monthly green space surveys
Monthly bat surveys were conducted at 18 of Hamilton's green spaces. The surveys followed the standardised ultrasound detection transect survey method developed by DOC (O'Donnell & Sedgeley Citation2001). A team of two observers undertook a transect survey by walking slowly (approximately 3 km h−1) along a pre-planned transect while listening for the calls of C. tuberculatus using a heterodyne bat detector (Pettersson Elektronik, Uppsala, Sweden) set to 40 kHz (Parsons Citation2001). Transect surveys were undertaken by volunteers trained to recognise echolocation calls using previously recorded ultrasound detector outputs. Surveys were undertaken on two nights each month with up to 10 transects undertaken concurrently per night, the order of the transects was randomised.
The locations of the transects were chosen to represent Hamilton's three major green space types: primary and secondary native green spaces and exotic green spaces. These are defined by Downs et al. (Citation2000). Six green spaces from each category were chosen as transect sites (n = 18). Transects were 1 km long predetermined paths. Nine transects (three from each green space type) were placed in dry areas and nine were placed in areas bordering a notable water body (river or lake within 10 m). All transects followed paths or grass verges in public spaces to allow for easy access and passage. This also selected for edge habitat which is preferred by C. tuberculatus (O'Donnell Citation2001b). The 18 green spaces represented most of the major green spaces in the city and were well distributed across the four city quarters.
All transects were surveyed each month for 13 months and the direction of the 1 km transects were alternated each month to minimise any temporal bias. Observers recorded the location of any bat passes (a sequence of two or more echolocation calls separated by <1 sec of silence), the number of bat passes, the time of each bat pass and the number of any bats detected visually (O'Donnell Citation2000b; O'Donnell & Sedgeley Citation2001). Transect surveys were conducted on nights when there was no rain or strong wind (O'Donnell & Sedgeley Citation2001). The surveys were conducted within the first 2 h after sunset, when C. tuberculatus activity is at its peak (O'Donnell Citation2000b; O'Donnell & Sedgeley Citation2001). Temperature, humidity and wind-speed data for each survey night were obtained from the National Institute of Water and Atmospheric Research (NIWA, Wellington) climate database, and from data collected at the Ruakura weather station within Hamilton.
Kolmogorov-Smirnov and Shapiro-Wilk's W test were used to test for normality and Spearman's correlation coefficient was used to describe the relationships between recorded environmental variables and bat passes per night. Statistica 8 (StatSoft, USA) was used for all analyses.
Twice-yearly citywide surveys
Citywide surveys were conducted in October and March on consecutive years (October 2005 to March 2007, a total of four surveys). October and March were selected because October is a time when bat activity rises after winter and March a time when juvenile bats are volant (O'Donnell Citation2001a). Temperatures at these times are mild and conducive to bat activity (average temperatures for each of the four 2 h surveys were: 12.6 °C, 12.9 °C, 13.03 °C and 13.9 °C).
The city area, defined by the official city limits, was divided into 90, 1 km2 study quadrats (). A 1 km long transect was conducted in each of the quadrats using the same methods and with observers recording the same data, as described for the monthly surveys. Most transects were conducted on foot, following roads and foot paths. However, quadrats that included the river area were done by boat. The boat was allowed to drift at the river's flow rate which is close to a moderate walking speed. During each survey period, all quadrats were surveyed once within a period of two consecutive nights.
Habitat features for each quadrat were derived from 2.5 × 2.5 m resolution data provided by LandSat (USA) images and data sourced from Land Information New Zealand (LINZ, New Zealand), Land Environments of New Zealand (LENZ, Landcare Research, New Zealand) and Land On-line (LOL, New Zealand) data bases and Eagle Orthophotos (USA). In all cases, the New Zealand S14 topographical map area at a scale of 1:250 was used. Each study quadrat was classified with respect to primary land cover type and distance from the Waikato River. Further, a number of derived habitat features were calculated using the Arcview 9 software's (ESRI, USA) spatial analyst density utility. These included housing density, road density, street light density (street light locations were retrieved from a WEL Energy private data base, WEL Energy New Zealand) and topographic complexity (3 m contour line density: comparison with traditional topographic and physical maps showed this to be a direct indicator of the presence of gullies in Hamilton). The study quadrats were classified by mean feature density over the 1 km2; this was calculated for each feature using the Arcview 9 spatial analyst neighbourhood utility by applying ordinal categorical values from 0 (very low) to 5 (very high) as determined by spatial analyst.
Chalinolobus tuberculatus' use of the Waikato River was examined by separately analysing the 17 quadrats that included the river. The scale of this study does not allow for differentiation between the river and riparian zones, thus the river transects included riparian areas. Investigated habitat features included surrounding land cover type within 1 km of the transect and the above derived habitat features. River quadrats were also classified by the presence of habitat connectivity, with 0 meaning no habitat connectivity and 1 meaning habitat connectivity. Habitat connectivity is defined here as the presence of any green space providing an uninterrupted link between the quadrat and a forest patch beyond the city limits. A forest patch was defined as any tree stand, native or exotic, containing more than 10 trees.
The gamma statistic (γ) was used to investigate relationships between pairs of habitat features and between habitat features and bat activity. Chi-squared Automatic Interaction Detection (CHAID) was used to describe possible higher order relationships between multiple interacting habitat features and bat passes. This method constructs non-binary classification trees by using chi-squared tests to determine the next split at each step. It allows for the identification and visualisation of the combination of habitat features that coincide with bat passes. Chi-squared tests (χ2) were used to determine the relationship between bat activity and habitat connectivity. Statistica 8 was used for all analyses.
Results
Monthly green space surveys
Bats were detected in only one of the 18 transects (). This transect traversed Hammond Bush, a long, narrow 1 ha urban forest reserve of the primary native green space category and a water-associated transect. The park consists primarily of Laurelia novae-zelandiae/Beilschmiedia tawa mixed forest. Exotic Eucalyptus spp., Salix cinerea and Pinus radiata are also found. The park's western side is bordered by the Waikato River; the eastern side is bordered by a medium-density urban subdivision.
Table 1 Location of and detection or non-detection of bat activity at the 18 monthly-survey green spaces.
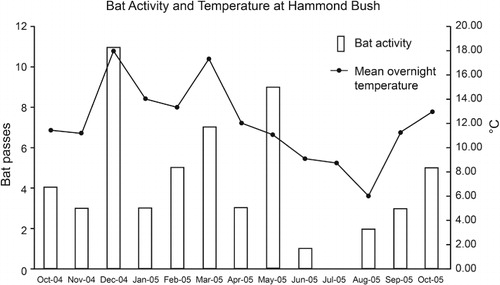
Bats were recorded at Hammond Bush every month between October 2004 and October 2005 with the exception of July 2005 (southern hemisphere winter). shows the number of recorded bat passes each month and the corresponding mean overnight temperature. Bat activity was significantly positively correlated with mean overnight temperature (Rs = 0.695, P < 0.05) but not humidity or wind speed (P > 0.05).
Twice-yearly citywide surveys
Chalinolobus tuberculatus have a discrete range within Hamilton being recorded in only five of the 90 quadrats within the southern extreme of the city limits (). shows the number of recorded bat passes within the five positive quadrats across all four surveys. No significant variation in activity levels or distribution between years or seasons was seen.
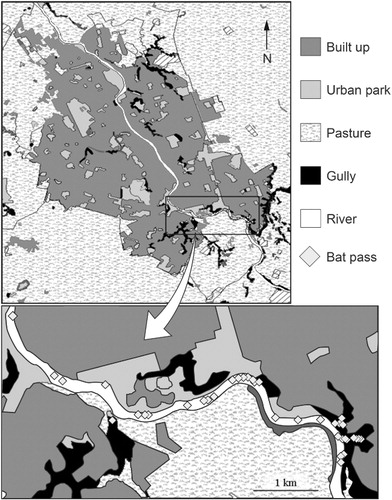
Table 2 Number of bat passes recorded at each active quadrat during each survey.
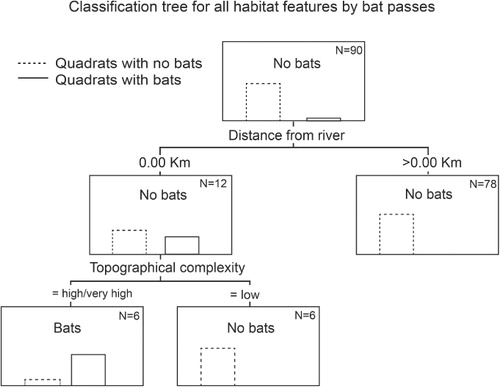
CHAID classification trees developed from all the investigated predictors of bat activity showed that distance from the Waikato River and topographical complexity were the best combined predictors of bat activity (). Of the 90 quadrats, only six included the river and had high or very high topographic complexity. Bat activity was recorded in five of these six quadrats () and no bats were recorded in any other quadrats.
Bats exploited only 5.5 km of the river's 17.5 km length within the city (). Density maps of anthropogenic habitat features indicated that road density increases near the central business district. Street light density was also high in the central business district particularly near the Waikato River, just beyond 5.5 km downstream. Topographical complexity was negatively related to housing density (γ = −0.530, P < 0.05), road density (γ = −0.253, P < 0.05) and street light density (γ = −0.460, P < 0.05).
Patterns of use over the river and river/riparian habitat characteristics
Within the 17 river/riparian quadrats, both street light density and housing density were significantly negatively related with bat passes (γ = −0.961, P < 0.05 and γ = −0.863, P < 0.05, respectively). Topographical complexity was positively related with bat passes (γ = 0.782, P < 0.05) as was habitat connectivity (χ2 = 12.99, P < 0.01).
A strong negative relationship was seen between downstream distance (relative to the city limits) and topographic complexity (γ = −0.998, P < 0.05). Additionally, significant positive relationships were seen between increasing housing and street light density and downstream distance (γ = 0.466, P < 0.05 and γ = 0.547, P < 0.05, respectively).
Discussion
This study confirmed the presence of C. tuberculatus in the city of Hamilton. Chalinolobus tuberculatus are restricted to the southern part of the city and are strongly associated with the Waikato River. Monthly surveys at Hammond Bush showed that bats remain in the city all year long and their activity patterns are positively related to temperature. Chalinolobus tuberculatus presence within the river/riparian quadrats is negatively correlated with housing and street light density and positively correlated with topographical complexity.
Seasonal activity patterns
During the 13 months of green space surveys, C. tuberculatus were found only in Hammond Bush. However, within Hammond Bush, bat activity was recorded throughout the year. Chalinolobus tuberculatus exhibited seasonal activity patterns similar to those recorded for this species in Fiordland and South Canterbury where bats show some activity for most of the year (O'Donnell Citation2000b; Griffiths Citation2007). Activity was highest over the summer months and very low in the winter, with no bat activity recorded in July, which is the middle of the southern hemisphere winter. Mean overnight temperature was a strong predictor of bat activity. This pattern has been previously documented for C. tuberculatus and many other species of insectivorous bats (Racey & Swift Citation1985; Rydell et al. Citation1996; Schulze et al. Citation2000; O'Donnell Citation2000b).
Habitat associations
Bat distribution in patchy landscapes depends on the interplay of three factors: (1) the presence of necessary resources such as prey and roosts; (2) the bats' ability to access resources; and (3) the impact of physical or perceived barriers to movement (Estrada & Coates-Estrada Citation2001, Avila-Flores & Fenton Citation2005). Chalinolobus tuberculatus in Hamilton have a discrete range within the city, which is the same in spring and autumn. They are found only in the southern extreme of the city in river/riparian areas with high topographic complexity.
The strong association between C. tuberculatus activity and the Waikato River suggests that the river/riparian area provides some or all of the resources that urban C. tuberculatus require. The river itself is likely to be an important foraging habitat within the city. Aggregations of emergent insects over water have often been documented as particularly productive prey for numerous bat species (Furlonger et al. Citation1987; Vaughan et al. Citation1996; Vaughan et al. Citation1997; Wickramasinghe et al. Citation2003) and high levels of bat foraging activity has been recorded in urban riparian areas (Threlfall et al. Citation2012). Preference for open water has also been documented in C. tuberculatus in South Canterbury (Griffiths Citation2007) and on the west coast of New Zealand (Greaves et al. Citation2006).
The riparian zone contains much of the remnant native flora in the area (Clarkson et al. Citation2002) and probably presents C. tuberculatus with an opportunity to roost, either during the day or at night. Hammond Bush, where bats were consistently found, is a primary example of a significant urban forest remnant in the riparian zone. It contains old growth native and exotic trees many of which are potential roost trees (O'Donnell & Sedgeley Citation1999). Old trees in the riparian zones and gullies often escaped removal because these areas are steep, wet and unsuitable for development (Clarkson et al. Citation1997). This may be the reason for the positive relationship between C. tuberculatus and high topographic complexity.
In Hamilton, riparian areas and gullies are not the only areas with old growth trees. For example, a kahikatea-dominated remnant forest known as Claudeland's Bush (5.2 ha) (Whaley et al. Citation1997) was another green space selected for monthly survey. It constitutes the single largest remnant of native forest within the city and similar kahikatea remnants have been shown to be good habitats for long-tailed bats (Dekrout Citation2009). Yet bats were never found there. Claudeland's Bush suffers from isolation within the urban matrix; it is surrounded by major city roads and is more than 1 km from the river or any gulley systems. Conversely, Hammond Bush, in the south of the city is connected not only to the river, but also to a major continuous gulley system, which links the southeast of the city with stands of old growth trees in the surrounding rural landscape.
In Hamilton, high topographical complexity equates to the presence of steep, deep and long gulley systems. The strong negative relationship between downstream distance and topographic complexity shows that such gullies are found only in the south of the city. Chalinolobus tuberculatus were present in five of the six river-dominated quadrats with high topographic complexity but were not found anywhere else. This indicates that gullies and waterways are important for urban bats, possibly because they provide habitat connectivity which was also positively related to bat presence. Habitat connectivity has been shown to allow bats access to resources by reducing the isolation between larger resource patches (Estrada & Coates-Estrada Citation2001; Hale et al. Citation2012). This can reduce the energetic demands on commuting bats by providing stopover foraging opportunities and resting sites (Verboom & Spoelstra Citation1999; Murray & Kurta Citation2004; Menzel et al. Citation2005). This is especially important in fragmented landscapes where greater distances between larger resource patches require bats to range more widely (Schulze et al. Citation2000; Estrada & Coates-Estrada Citation2002).
The presence of long-tailed bats has been documented in the rural areas south of Hamilton (Dekrout Citation2009). It is therefore possible that the southern gulley systems that connect Hamilton's river and riparian resources with those beyond the city limits are the reason bats persist in the southern city. However, even if the initial access to the river is limited to the southern gulley systems, the river itself should have the potential to allow bats to move northwards through the city (Law & Chidel Citation2002; Ober & Hayes Citation2008). But bats were not found beyond 5.5 km downstream. In Hamilton, the city's core, which begins near the 5.5 km downstream mark, has a higher density of houses, roads and street lights. This increase in the built infrastructure and subsequent reduction of natural habitat features likely limits the resource base in the city centre. Additionally, increases in lighting and high density human settlement may be aversive to C. tuberculatus, limiting their access to the southern extreme of the city. Future studies could more closely investigate potential barriers to C. tuberculatus movements.
Conclusions
Hamilton's urban biodiversity has been closely linked with the gulley systems and the Waikato River (Clarkson et al. Citation1997; Clarkson & McQueen Citation2004) and this study also indicates such habitat features are important for bats in the city. The river and southern gullies may provide C. tuberculatus with roosting and/or foraging resources and effective access routes to these resources. These results suggest that conservation and management efforts for urban bats should focus on protecting habitat features such as gullies that connect distant habitat patches. However, no studies enable direct comparison with the results reported here and more research is needed to provide definitive conclusions about the habitat associations of urban bats in New Zealand.
Acknowledgements
We would like to thank the University of Auckland and Waikato University for resources and support and Environment Waikato, Hamilton City Council, Forest and Bird, NZ Parks and Conservation Foundation and Bat Conservation International for funds and support. Thank you to the many volunteers who helped with this study and to Dr Nicholas Ling for the use of a boat.
References
- Adams LW 1994. In our own backyard - conserving urban wildlife. Journal of Forestry 92: 24–25.
- Avila-Flores R, Fenton MB 2005. Use of spatial features by foraging insectivorous bats in a large urban landscape. Journal of Mammalogy 86: 1193–1204.10.1644/04-MAMM-A-085R1.1
- Clarkson BD, McQueen J 2004. Ecological restoration in Hamilton City, North Island, New Zealand. In 6th Int'l Conference of the Society for Ecological Restoration, Victoria, Canada.
- Clarkson BD, Merrett M, Downs T 2002. Botany of the Waikato. Hamilton, Waikato Botanical Society.
- Clarkson BD, Wehi PM, Brabyn LK 1997. A spatial analysis of indigenous cover patterns and implications for ecological restoration in urban centres, New Zealand. Urban Ecosystems 10: 441–457.10.1007/s11252-007-0035-6
- Daniel MJ, Williams GR 1984. A survey of the distribution, seasonal activity and roost sites of New-Zealand bats. New Zealand Journal of Ecology 7: 9–25.
- Dekrout AS 2009. Monitoring New Zealand long-tailed bats (Chalinolobus tuberculatus) in urban habitats: ecology, physiology and genetics. Unpublished PhD thesis. Auckland, University of Auckland.
- Department of Conservation 2007. Bat (pekapeka) records 1997–2007. Wellington, Department of Conservation.
- Downs T, Clarkson BD, Beard C 2000. Key ecological sites of Hamilton City; volume 1. CBER Contract Report No. 121, prepared for Hamilton City Council. Hamilton, Centre for Biodiversity and Ecology Research, The University of Waikato.
- Estrada A, Coates-Estrada R 2001. Bat species richness in live fences and in corridors of residual rain forest vegetation at Los Tuxtlas, Mexico. Ecography 24: 94–102.10.1034/j.1600-0587.2001.240111.x
- Estrada A, Coates-Estrada R 2002. Bats in continuous forest, forest fragments and in an agricultural mosaic habitat-island at Los Tuxtlas, Mexico. Biological Conservation 103: 237–245.10.1016/S0006-3207(01)00135-5
- Furlonger CL, Dewar HJ, Fenton MB 1987. Habitat use by foraging insectivorous bats. Canadian Journal of Zoology 65: 284–288.10.1139/z87-044
- Gehrt SD, Chelsvig JE 2003. Bat activity in an urban landscape: patterns at the landscape and microhabitat scale. Ecological Applications 13: 939–950.10.1890/02-5188
- Greaves GJ, Mathieu R, Seddon PJ 2006. Predictive modelling and ground validation of the spatial distribution of the New Zealand long-tailed bat (Chalinolobus tuberculatus). Biological Conservation 132: 211–221.10.1016/j.biocon.2006.04.016
- Griffiths RW 2007. Activity patterns of long-tailed bats (Chalinolobus tuberculatus) in a rural landscape, South Canterbury, New Zealand. New Zealand Journal of Zoology 34: 247–258.10.1080/03014220709510083
- Hale JD, Fairbrass AJ, Matthews TJ, Sadler JP 2012. Habitat composition and connectivity predicts bat presence and activity at foraging sites in a large UK conurbation. PloS ONE 7(3): e33300.10.1371/journal.pone.0033300
- King CM ed. 2005. The handbook of New Zealand Mammals. 2nd edition. Auckland, Oxford University Press.
- Law B, Chidel M 2002. Tracks and riparian zones facilitate the use of Australian regrowth forest by insectivorous bats. Journal of Applied Ecology 39: 605–617.10.1046/j.1365-2664.2002.00739.x
- Menzel JM, Ford WM, Menzel MA, Carter TC, Gardner JE, Garner JD et al. 2005. Summer habitat use and home-range analysis of the endangered Indiana bat. Journal of Wildlife Management 69: 430–436.10.2193/0022-541X(2005)069%3C0430:SHUAHA%3E2.0.CO;2
- Miller LA, Andersen BB 1984. Studying bat echolocation signals using ultrasonic detectors. Zeitschrift Fur Saugetierkunde-International Journal of Mammalian Biology 49: 6–13.
- Murray SW, Kurta A 2004. Nocturnal activity of the endangered Indiana bat (Myotis sodalis). Journal of Zoology 262: 197–206.10.1017/S0952836903004503
- Ober HK, Hayes JP 2008. Influence of vegetation on bat use of riparian areas at multiple spatial scales. Journal of Wildlife Management 72: 396–404.10.2193/2007-193
- O'Donnell CFJ 2000a. Conservation status and causes of decline of the threatened New Zealand Long-tailed Bat Chalinolobus tuberculatus (Chiroptera: Vespertilionidae). Mammal Review 30: 89–106.10.1046/j.1365-2907.2000.00059.x
- O'Donnell CFJ 2000b. Influence of season, habitat, temperature, and invertebrate availability on nocturnal activity of the New Zealand long-tailed bat (Chalinolobus tuberculatus). New Zealand Journal of Zoology 27: 207–221.10.1080/03014223.2000.9518228
- O'Donnell CFJ 2001a. Advances in New Zealand mammalogy 1990–2000: long-tailed bat. Journal of the Royal Society of New Zealand 31: 43–57.10.1080/03014223.2001.9517638
- O'Donnell CFJ 2001b. Home range and use of space by Chalinolobus tuberculatus, a temperate rainforest bat from New Zealand. Journal of Zoology 253: 253–264.10.1017/S095283690100022X
- O'Donnell CFJ, Christie JE, Hitchmough RA, Lloyd B, Parsons S 2009. The conservation status of New Zealand bats. New Zealand Journal of Zoology 37: 297–311.10.1080/03014223.2010.513395
- O'Donnell CFJ, Sedgeley JA 1999. Use of roosts by the long-tailed bat, Chalinolobus tuberculatus, in temperate rainforest in New Zealand. Journal of Mammalogy 80: 913–923.10.2307/1383260
- O'Donnell CFJ, Sedgeley JA 2001. Guidelines for surveying and monitoring long-tailed bat populations using line transects. DOC Science Internal Series 12. Wellington, Department of Conservation. 20 p.
- Parsons S 1997. Search-phase echolocation calls of the New Zealand lesser short-tailed bat (Mystacina tuberculata) and long-tailed bat (Chalinolobus tuberculatus). Canadian Journal of Zoology 75: 1487–1494.10.1139/z97-772
- Parsons S 2001. Identification of New Zealand bats in flight from analysis of echolocation calls by artificial neural networks. Journal of Zoology (London) 253: 447–456.10.1017/S0952836901000413
- Pickett STA, Cadenasso ML, Grove JM, Nilon CH, Pouyat RV, Zipperer WC et al. 2001. Urban ecological systems: linking terrestrial ecological, physical, and socioeconomic components of metropolitan areas. Annual Review of Ecology and Systematics 32: 127–157.10.1146/annurev.ecolsys.32.081501.114012
- Racey PA, Swift SM 1985. Feeding ecology of Pipistrellus pipistrellus (Chiroptera, Vespertilionidae) during pregnancy and lactation. Journal of Animal Ecology 54: 205–215.10.2307/4631
- Rosenzweig ML 2003. Win-win ecology: how the earth's species can survive in the midst of human enterprise. New York, Oxford University Press.
- Rydell J, Entwistle A, Racey PA 1996. Timing of foraging flights of three species of bats in relation to insect activity and predation risk. Oikos 76: 243–252.10.2307/3546196
- Schulze MD, Seavy NE, Whitacre DF 2000. A comparison of the phyllostomid bat assemblages in undisturbed Neotropical forest and in forest fragments of a slash-and-burn farming mosaic in Peten, Guatemala. Biotropica 32: 174–184.
- Sparks DW, Ritzi CM, Duchamp JE, Whitaker JO 2005. Foraging habitat of the Indiana bat (Myotis sodalis) at an urban–rural interface. Journal of Mammalogy 86: 713–718.10.1644/1545-1542(2005)086[0713:FHOTIB]2.0.CO;2
- Threlfall CG, Law B, Banks PB 2012. Influence of landscape structure and human modifications on insect biomass and bat foraging activity in an urban landscape. PloS ONE 7: e38800.10.1371/journal.pone.0038800
- Vaughan N, Jones G, Harris S 1996. Effects of sewage effluent on the activity of bats (Chiroptera: Vespertilionidae) foraging along rivers. Biological Conservation 78: 337–343.10.1016/S0006-3207(96)00009-2
- Vaughan N, Jones G, Harris S 1997. Habitat use by bats (Chiroptera) assessed by means of a broad-band acoustic method. Journal of Applied Ecology 34: 716–730.10.2307/2404918
- Verboom B, Spoelstra K 1999. Effects of food abundance and wind on the use of tree lines by an insectivorous bat, Pipistrellus pipistrellus. Canadian Journal of Zoology-Revue Canadienne De Zoologie 77: 1393–1401.10.1139/cjz-77-9-1393
- Whaley PT, Clarkson BD, Smale MC 1997. Claudlands Bush: ecology of an urban Kahikatea (Dacrycarpus darcrydioides) forest remnant in Hamilton New Zealand. Tane 36: 131–155.
- Wickramasinghe LP, Harris S, Jones G, Vaughan N 2003. Bat activity and species richness on organic and conventional farms: impact of agricultural intensification. Journal of Applied Ecology 40: 984–993.10.1111/j.1365-2664.2003.00856.x