
ABSTRACT
We sampled populations of forest-floor dwelling cave and ground wētā using footprint tracking tunnels and spotlight transect counts in southern beech forest, New Zealand. Samples were compared to estimates of wētā density based on mark–recapture estimates from 25 m2 enclosures. Both activity indices captured variability in cave wētā in time and space, were strongly correlated with each other, and have the potential for monitoring cave wētā activity levels. Comparisons between indices and cave wētā density estimates were equivocal, as recapture rates were too low to calculate high-resolution density estimates. We also found that cave wētā counts had a curved relationship increasing with temperature, and a negative relationship with increasing shrub and woody debris cover. Based on these preliminary results, tracking tunnels could be a viable method of monitoring cave wētā as they appear more efficient than transect counts and are relatively inexpensive. However, further calibration trials are needed to determine if indices mirror robust population density estimates.
Introduction
Environmental indicators are now used globally to report on the general state of the environment and measure trends in global biodiversity (Hammond et al. Citation1995; UNEP-WCMC Citation2009). A wide range of indicator concepts, from broad ecosystem health indicators to population trend indicators for selected species, are applied to measuring biodiversity (Caro & O'Doherty Citation1999). However, a carefully selected subset of biodiversity indicators needs to be measured if broad trends in environmental conditions and progress toward biodiversity goals are to be established (Hoare et al. Citation2010). As part of the New Zealand Department of Conservation's (DOC) indicator species programme (Lee et al. Citation2005), a representative range of taxa have been selected as potential indicator species to report on progress towards mitigating the prime threats to biodiversity (Monks et al. Citation2013). However, a recent strategic review within DOC has noted gaps in the range of biodiversity monitoring methods required for adequate conservation reporting and the particular need to develop more tools for the inventory and monitoring of rare, cryptic and data-deficient species (Monks et al. Citation2013).
Biodiversity in New Zealand is under threat from recent anthropogenic effects such as major habitat loss, fragmentation and impacts of exotic browsing animals and predators (Wardle et al. Citation2001; Worthy & Holdaway Citation2002; Bellingham & Lee Citation2006). Predation by introduced mammals is the primary threat to indigenous biodiversity (e.g. Pryde et al. Citation2005; Hoare et al. Citation2007; Innes et al. Citation2010) and so is an important focus for state-of-the-environment reporting in New Zealand. Integrated mammalian pest control has frequently been used to attempt recovery of threatened species, particularly birds and lizards (e.g. Tocher Citation2006; Innes et al. Citation2010; O'Donnell & Hoare Citation2012). Less work has occurred on measuring the response of invertebrates to management of predators, despite them representing the largest group of animals affected by predation (e.g. Daniel Citation1973; Ramsay Citation1978). Hence, the large ground-dwelling orthoptera (wētā) have been identified as potential invertebrate species for reporting on (1) trends in populations of widespread forest species (for State of the Environment reporting), and (2) benefits of conservation management as part of DOC's programmes to restore New Zealand's biodiversity (Monks et al. Citation2013). Orthoptera are found in all forests in New Zealand including its offshore islands.
Few well-calibrated and verified methods are available for monitoring invertebrate biodiversity in New Zealand. This problem in part reflects the considerable diversity of invertebrates and the need to develop a broad range of monitoring methods to measure the responses of populations to management. Monitoring methods for nocturnal arboreal tree wētā (Hemideina) and giant wētā (Deinacrida) are among the most advanced for invertebrates and have been useful for monitoring responses to management, particularly in northern podocarp–hardwood forests (Trewick & Morgan-Richards Citation2000; Rufaut & Gibbs Citation2003; Bleakley et al. Citation2006; Watts et al. Citation2008, Citation2010, Citation2011). However, monitoring methods for the most ubiquitous wētā species, the ground wētā (Hemiandrus spp., Anostostomatidae) and cave wētā (Rhaphidophoridae), are less advanced (Jamieson et al. Citation2000; Watts et al. Citation2011). Both groups combined represent > 70 species and > 20 endemic genera that inhabit most terrestrial environments (Cook et al. Citation2010; Johns Citation1997; Monteith & Field Citation2001). The aim of this paper is to extend the research into population monitoring methods conducted to date on tree and giant wētā to these two other major groups of wētā (ground wētā and cave wētā; from hence forth referred to simply as ‘wētā’) that are characteristic of South Island beech forests. Both groups are potential indicators of the health of forest floor invertebrate populations before and after pest control programmes aimed at controlling rodents and mustelids. Our objectives are to (1) evaluate the utility of two index methods (footprint tracking tunnels and spotlight transects) for monitoring cave and ground wētā in southern beech forests, (2) to determine if such indices are correlated with mark–recapture estimates of density, and (3) to use the indices to investigate the climatic and environmental factors influencing the detection and distribution of ground-dwelling wētā.
Methods
Study area
The study was conducted in the Eglinton Valley, eastern Fiordland in the South Island, New Zealand (44°58'S, 168°01'E). The 50-km long glacial valley has steep sides and a 0.5–1.5 km-wide flat floor. The valley is dominated by temperate Fuscospora and Lophozonia rainforest (red beech Fuscospora fusca, silver beech Lophozonia menziesii, mountain beech Fuscospora cliffortioides), which covers gentle glacial terraces and outwash fans on the lower hill slopes and then rises steeply to the timberline at c.1200 m above sea level. Specifically, the study was conducted on terraces dominated by red beech adjacent to Walker Creek and Mackay Creek in the lower valley.
Sampling grids and activity indices
We undertook monitoring on four 100 × 100 m sampling grids.
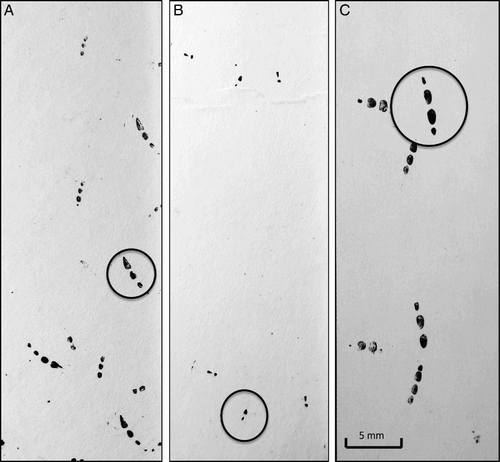
Figure 1. Examples of wētā metatarsal footprints recorded from captive wētā: A, Tallitropsis sedilloti, B, Pleioplectron sp., C, Hemiandrus sp. The metatarsal prints are circled, showing the key differences between the species: Pleioplectron sp. only track two of the metatarsal pads, while T. sedilloti and Hemiandrus sp. lagging metatarsal pads are shaped differently (triangular for T. sedilloti and oval for Hemiandrus sp.).
Grids were located 280–320 m above sea level, 0.7–4.3 km apart and were considered independent of each other relative to likely wētā movement patterns (Chappell et al. Citation2014). They were reasonably flat, but also featured some low escarpment faces. Vegetation covering the grids was predominantly mature red beech, although other beech species and tall hardwood shrubs such as Carpodetus serratus and Griselinia littoralis were also common. Mature beech forest was interspersed with open areas dominated by moss, leaf litter, and small logs and branches.
Each grid contained 24–25 tracking tunnels (‘Black Trakka’: Gotcha Traps) spaced at 25 m intervals. The tracking cards were pre-inked and baited in the middle with approximately 5 g of peanut butter. Peanut butter was recommended by Watts et al. (Citation2008) for giant wētā tracking tunnels, and a trial we conducted before commencing sampling suggested that baiting increased tracking rates of cave and ground wētā. The cards were left out for four nights on each grid per sampling session. They were checked each day, the presence of wētā prints was recorded, the species was identified using the tracking card reference collection, and the card was replaced if there was sufficient tracking to obscure subsequent wētā prints.
Twenty-five 10 m transects, all orientated in an east–west direction, were also established on each grid. Transects occurred 15 m apart on each 100 m line, with 25 m separating the lines. Observers were allocated 12 different transects each night to control for observer bias. Observers aimed to search transects for approximately 7 minutes, using a head torch and prodding the ground gently with a stick to startle wētā and thereby enhance detection. Shrubs and trees that occurred on transects were examined up to a height of 1 m. Observers were highly familiar with the locally common wētā species, so the majority of wētā discovered were easily recognised and recorded to the genus level. Although some misidentification of very small cave wētā may have occurred, the locally common species had distinctive thoracic and abdominal markings and were easily identifiable even as juveniles. Transect searches were carried out from 2130 h to 0000 h. Transects were not searched in rain to avoid precipitation altering probability of detection.
Sampling was conducted in three summer sessions: 14–28 November and 30 November–22 December 2012, and 14–25 February 2013. During the first two sampling sessions, data were collected by one observer, with the aim of developing viable monitoring index methods and density estimates for cave and ground wētā. The third monitoring period was conducted by eight observers with the aim of calibrating viable monitoring indices against a mark–recapture based density estimate.
Identifying wētā footprints
Surveys were conducted before the sampling period to determine which wētā species were locally common. Hemideina sp. did not occur at the site. Locally common species (Pleioplectron sp., Tallitropsis sedilloti, Hemiandrus sp.) were identified using morphological characters that have previously been informative for Orthoptera identification. A minimum of three representatives of each locally common wētā species were captured and individually enclosed in a tracking tunnel overnight. Representatives ranged from juveniles to adults for each species. Footprints were also obtained for six bush cockroaches (Cellatoblatta sp.) due to their similarity to Hemiandrus prints. The size and arrangement of the footprints were noted for each species and the cards obtained from the trials were used as references when analysing the grid tracking cards. Wētā tarsal pad lengths were not measured.
Mark–recapture estimates
Mark–recapture density estimates were obtained in the February monitoring period by sampling 5 × 5 m wētā enclosures. Enclosures were constructed from black 1 m high polythene, dug into the ground to a depth of approximately 10 cm to prevent the wētā from burrowing. One-metre garden stakes provided the scaffolding for the polythene. Each grid contained one enclosure, which replaced a transect. The enclosure was located at a representative site that had (1) recorded the mean number of wētā for the grid during the November–December sampling session, (2) one large (> 1 m diameter) red beech tree, (3) no more than 25% shrub cover, and (4) > 50% leaf litter. These criteria ensured that a representative range of habitats was sampled within each enclosure, while still keeping the enclosures reasonably homogeneous.
Each wētā enclosure was sampled over four consecutive nights between 2130 h and 0000 h. The number of wētā caught and marked was recorded, including their position within the enclosure. All wētā larger than 10 mm (body size) were marked on the dorsal side of the abdomen with a small (< 2 mm) dot of nail varnish. Marks did not allow for individual identification, but each night's sampling was designated a different colour of nail varnish. Cave wētā in particular can be difficult to catch as they tend to jump away from observers, but in this case the polythene walls of the enclosure restricted their movements, giving us a reasonably high capture rate.
Environmental and other variables
Weather data were obtained from The National Climate Database (http://cliflo.niwa.co.nz). Data were received from the Eglinton Valley Knobs Flat climate station (climate station 37382, 44°97'S, 168°02'E), 350 m above sea level. Weather characteristics that were included in analyses were mean hourly temperature (°C) and relative humidity (%). As transect habitat was three-dimensional, habitat measurements were taken both at ground level and at a height of 1 m for each transect. The percentage of leaf litter, moss, moss-covered detritus and woody debris at ground level were visually assessed. Trees and shrubs were assessed at 1 m above ground using the same method.
Analysis
The presence of wētā species’ footprints on the tracking cards was converted to a tracking rate for the grid as whole, while the metric calculated for transects was the number of wētā observed for each transect; both are considered indices of abundance. These two indices were averaged for each grid within sampling sessions. Variability in the frequency of occurrence of wētā on transects and tracking tunnels among sampling sessions and grids were examined using one-way analyses of variance (ANOVA) and Tukey tests. The Pearson product-moment correlation coefficient r was used to examine correlations between indices.
The index of dispersion I =
was calculated for Pleioplectron sp. grids and wētā enclosures to ascertain whether intraspecific aggregation was occurring (Fowler et al. Citation1998). Indices were calculated to investigate whether grids were large enough to capture spatial variation in wētā distribution, and how this compared to spatial variation within the 5 × 5 m wētā enclosures. Grid indices were calculated from the cumulative number of wētā found on each transect over each monitoring session. Enclosure indices were calculated by mapping the first recorded locations of wētā found in the enclosure on to a 5 × 5 m grid schematic, where each of the 25 cells provided a data point of the cumulative number of wētā found in that 1 × 1 m cell. These data were then used to calculate the mean and variance of wētā found in the enclosure. Deviations from a random distribution were tested using the chi-squared probability distribution χ2
= I(n–1), based on (n–1) degrees of freedom, where n = the sample size of 24 or 25 sample units per grid (Fowler et al. Citation1998). Indices of dispersion were calculated for the November, December and February monitoring sessions to determine whether spatial distribution changed temporally.
We explored relationships between spotlight wētā counts from all three sampling sessions and habitat variables graphically. Moss and moss-covered debris did not appear to have any correlation with wētā counts and were therefore left out of future analyses. We used a generalised linear mixed-effects modelling approach to investigate the effects of weather (temperature and relative humidity; both linear and polynomial relationships) and habitat variables (% of transect covered by leaf litter and woody debris at ground level; % of transect occupied by shrubs and trees at 1 m above ground) on sightings of wētā during spotlight transects. Each model contained observer and transect within site as random effects. We started with a full model, then used stepwise elimination to find the best model (dropping the least significant term until all remaining terms were significant at α = 0.05).
Abundance of wētā in each enclosure was estimated using the Huggins closed population estimator Mh (Huggins Citation1991), allowing for a possible behavioural effect to capture (i.e. the probability of recapture to be different from the probability of first capture) and heterogeneous capture probabilities using a two-group finite mixture model (Pledger Citation2000). Analysis was conducted using Program MARK Version 5.1 (White & Burnham Citation1999). All other statistical analyses were performed in the programme R (Version 2.15.1; R Development Core Team Citation2012).
Results
Identification of footprints
The arrangement of the prints differed significantly between the different species tested, although there was a similarity in footprint size. Pleioplectron sp. only tracked two metatarsal pads, while T. sedilloti and Hemiandrus sp. tracked between three and four metatarsal pads. These latter two taxa were distinguishable from each other by the shape of the lagging metatarsal pad print: T. sedilloti have a triangular print while the prints of Hemiandrus are distinctly oval ().
Activity indices
Both tracking tunnels and transect counts detected wētā frequently in all sampling periods (A, B). The majority of wētā were identified as the cave wētā Pleioplectron sp., both visually from transects (89.5%, n = 2158) and by tracks on tracking tunnel cards. On transects, the remainder of wētā detected were the cave wētā T. sedilloti (8.2%, n = 198) and ground wētā Hemiandrus sp. (2.3%, n = 55). A small sample of wētā were measured using a ruler, these individuals ranged in length from c.7 mm to 50 mm, with the majority being small (< 30 mm). On tracking cards, Pleioplectron sp. were detected 87.6% of the time (n = 445), followed by Hemiandrus at 7.7% (n = 39) and T. sedilloti at 4.7% (n = 24). Because of low activity rates in these latter species, we only analyse the data for Pleioplectron sp. in this paper.
Figure 2. Mean (±SE) percentage footprint tracking rate (A), and mean number of cave wētā, Pleioplectron sp., per spotlight transect (B), on four sampling grids during three sampling sessions, Eglinton Valley, November 2012 to February 2013. Transects in Grid 2 were not sampled in December.
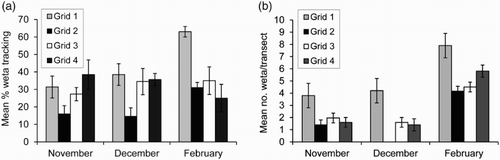
Tracking sessions were run over five nights in November and December and four nights in February. There was some variation in mean footprint tracking rates for Pleioplectron sp. between sampling sessions and grids (A; one-way ANOVAs). Frequency of tracking was similar on Grids 2, 3 and 4 between sessions (November, December, February: Grid 2, F2,11 = 3.78, P = 0.06; Grid 3, F2,11 = 0.46, P = 0.65; Grid 4, F2,11 = 1.01, P = 0.39), but Pleioplectron sp. tracking varied on Grid 1 (F2,11 = 7.83, P = 0.008) resulting from a significantly higher tracking rate in February (Tukey test, P < 0.05; A). There was more variation within season than between grids, with activity varying among grids in November (F3,16 = 2.43, P = 0.03) and December (F3,16 = 3.72, P = 0.03), with most variation in February (F3,16 = 7.15, P = 0.004).
The mean duration of spotlight counts on transects was similar across sampling sessions (November = 7.0 ± 0.6 SD min, n = 99; December = 7.1 ± 0.4, n = 75; February = 6.9 ± 2.9, n = 309), although times were more variable when multiple observers were used in February (Bartlett's test, P < 0.001). Counts of Pleioplectron sp. on transects varied among grids within each sampling session (B; one-way ANOVAs: November, F3,96 = 4.43, P = 0.006; December, F3,96 = 7.25, P = 0.002; February, F3,96 = 6.45, P < 0.001), with counts being highest on Grids 1 and 3 (Tukey tests, P < 0.05). Counts also varied significantly between sampling sessions on each grid (one-way ANOVAs, all P < 0.002), with highest numbers consistently counted on grids in February (B; Tukey tests, P < 0.05). Many of these activity patterns were consistent when comparing tracking tunnels with transects (A, B). For example, activity was significantly higher on Grid 1 in February than in other months (F2,11 = 7.83, P = 0.008 for tracking tunnels; F2,71 = 6.76, P < 0.002 for counts on transects; Tukey tests, P < 0.05).
Spatial analyses
The indices of dispersion for each grid were > 1 for all three monitoring sessions, indicating significant intra-specific aggregations of Pleioplectron sp. at this scale (). However, only one wētā enclosure (in Grid 4) contained a significant aggregation of Pleioplectron sp. (χ2 [d.f = 24] = 41.1 P = 0.016), with all other enclosures displaying a random, fine-scale distribution of Pleioplectron sp.
Table 1. Indices of dispersion with associated chi-squared statistics of cave wētā, Pleioplectron sp., measured across transects (at 25 m spacing) and points within enclosures (at 1 m spacing), over three monitoring periods.
Correlations among wētā indices
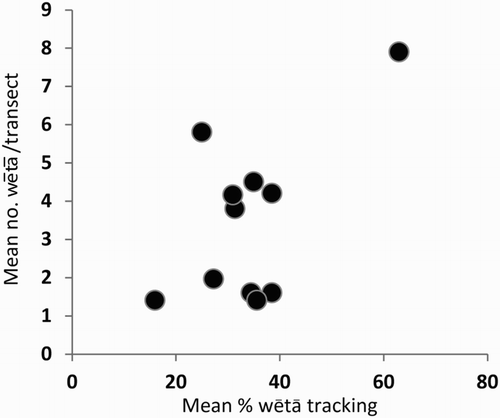
Overall, average activity on transects was strongly correlated with activity in tracking tunnels (Pearson correlation coefficient r = 0.603, P = 0.04; ). However, comparisons between these indices and estimates of abundance were not possible because of low sample sizes. Recapture rates in enclosures were low: on average, only 17% of Pleioplectron sp. were ever captured more than once. Of the 300 Pleioplectron sp. captured within the four enclosures over the four nights, 250 (83.3%) were only captured once, 45 (15%) were captured twice, 5 (1.7%) were captured three times, and none captured four times. Density within enclosures appeared to be high with > 200 Pleioplectron sp. in 25 m2. However, only three population estimates were calculated: N1 = 213.6 (95% confidence interval [95% CI] 150.2–335.1), N2 = 240.7 (95% CI 176.2–386.6) and N3 = 254.3 (95% CI 122.0–626.4) in the enclosures from Grids 1, 2 and 3, respectively. Program Mark could not calculate estimates for enclosure 4; which was probably caused by attempting to fit an overly complex model to the smallest data set. In addition, there was significant clumping of Pleioplectron sp. within enclosure 4, whereas distributions within other enclosures were random ().
Figure 3. The relationship between mean percentage footprint tracking rate and mean number of cave wētā, Pleioplectron sp. on spotlight transects (all data combined; each point represents a different grid × sampling session comparison).
Factors influencing detection of wētā
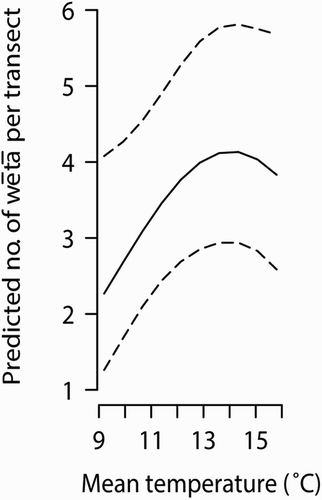
We used transect data to determine factors influencing the detection of Pleioplectron sp. as this index had higher resolution than the tracking tunnel data. The best model based on stepwise elimination of terms was one that included temperature (linear and polynomial elements), woody debris and shrubs. Temperatures during counts ranged from 9.2 to 15.8 °C. Pleioplectron sp. sightings were positively correlated with temperature (z = 2.238, P = 0.0253), with the highest sightings at intermediate temperatures of c.14 °C (z = −2.545, P = 0.0109) (). Sightings were negatively correlated with proportion of both woody debris and shrubs on transects (z = 0.2408, P = 0.0160 and z = −2.069, P = 0.0386, respectively). Proportion of transects containing trees and relative humidity (linear and polynomial terms) were not correlated with Pleioplectron sp. sightings (P > 0.05 for all).
Figure 4. The predicted numbers of cave wētā, Pleioplectron sp., under the temperature conditions experienced during spotlight transects in February.
Discussion
Footprint tracking tunnels have been used to monitor giant wētā (Deinacrida spp.; Watts et al. Citation2008, Citation2010) and to suggest population increases for arboreal tree wētā (Hemideina spp.) following predator removal (Watts et al. Citation2011). Our results indicate that tracking tunnels and spotlight transects are both useful for detecting the most common ground-dwelling wētā in our study area, Pleioplectron sp. . These indices captured variability in Pleioplectron sp. activity in time and space, were correlated with each other, and have the potential for monitoring cave wētā activity levels over longer time frames. It was useful to focus this research in beech forests because the majority of recent predator control operations run by the DOC are in beech-dominant forests (e.g. > 600,000 ha over the last year; G Elliott pers. comm.). Similarly, a focus on ground-dwelling wētā, which are likely to be influenced by ground-foraging predators (rats and stoats), fills a research gap and complements research on arboreal and giant wētā.
Measuring indices of animal abundance is generally cheaper and easier than attempting to measure actual density (Pollock et al. Citation2002). Effective monitoring programmes using indices have two basic requirements: they need to have relatively high detection rates and low variability if they are to be useful at indicating population responses to management or environmental perturbations over short or useful time frames. We consider that the number of wētā on 10 × 1 m transects sampled activity in representative habitats present in the study area. We recorded high detection rates and these counts correlated with footprint tracking rates, indicating that footprint tracking rates provide an index of the number of wētā present in the general area. However, future research using tracking tunnels to monitor cave and ground wētā would benefit from measuring tarsal pad size against wētā prints for each species in order to generate a more robust key (see Watts et al. Citation2011 for an example of this method).
The indices of dispersion that we calculated from transect counts suggest that Pleioplectron sp. typically occur in clusters over a 1 ha area, and are randomly dispersed when sampled across a 25 m2 area. This result implies that conducting cave wētā sampling over a 10,000 m2 area is sufficient to capture the species’ spatial variability. Little is known about aggregations or movements of cave wētā, however, giant wētā are thought to display little site fidelity, moving often and spreading themselves across the landscape (e.g. McIntyre Citation2001; Watts et al. Citation2010).
Three areas, however, require further work before we can have confidence that such indices reflect population changes or could be used to inform management. First, further calibration trials with more replicates and a greater range of wētā and predator densities are needed to determine if indices mirror robust estimates of population density, as has been done for predators (e.g. Brown et al. Citation1996). Trends in animal abundance can be derived from indices by assuming that the index is monotonically related to population size (Caughley Citation1977). This assumption is best tested by obtaining indices of abundance for populations of known or estimated size. Mark–recapture studies of small forest dwelling wētā are challenging, largely because wētā can be highly cryptic, are difficult to mark (e.g. Chappell et al. Citation2014) and identify (Fitness et al. Citation2015), and have low recapture probabilities (e.g. Watts et al. Citation2010) (thus raising uncertainties about what proportion and which cohorts are marked and whether samples are biased or not). In our pilot study, we had great difficulty in capturing and keeping cave wētā in traditional non-lethal pitfall traps (Luff Citation1975) and the majority of wētā were too small to mark individually (four designs tested, unpubl. data). In this study we were only able to obtain three estimates of density, which were too coarse to enable calibration against our indices. These low-resolution density estimates were due to low numbers of recaptured Pleioplectron sp., and small sample size in the case of Grid 4. Low recapture rates could potentially have been caused by Pleioplectron sp. altering their behaviour after capture, although this limitation is somewhat unavoidable. Although using 5 × 5 m enclosures for mark–recapture estimates of cave wētā seems to have potential, we recommend that future studies sample for at least seven nights to ensure high enough recapture rates. Likewise, future mark–recapture studies should endeavour to mark wētā with less conspicuous marks, because it is possible that we influenced recapture rates by marking wētā using coloured nail polish.
Second, future sampling will benefit from optimising and standardising samples, focusing on peak periods of activity and avoiding conditions where there is a low probability of detection. In our study, sampling of Pleioplectron sp. was optimised at c.13–15°C. Determining optimal temperatures for sampling is crucial for poikilothermic animals, in which activity may increase linearly with temperature, at least to a physiological maximum (O'Donnell Citation2000; Hoare et al. Citation2009). We also found that wētā sightings were negatively correlated with shrubs and woody debris. This finding may relate to detectability as opposed to actual wētā habitat preference, as the structural complexity of shrubs and woody debris makes them harder to search for wētā. Differences in detectability due to background habitat patchiness highlights a possible limitation of using observer counts for sampling wētā. For this reason, future sampling should endeavour to standardise habitat as much as possible, or factor habitat measurements into the analysis.
Third, the assumption that introduced mammalian predators depress invertebrate numbers in New Zealand needs testing. Invertebrates, particularly wētā, are frequently consumed by introduced predators (e.g. Daniel Citation1973; Ramsay Citation1978; Smith et al. Citation2005), and there are species that have become extinct on the mainland yet still survive on predator-free island refuges (Gibbs Citation1998). Additionally, there are instances where increases in invertebrate activity, particularly larger species, coincided with eradications of predators (Green Citation2002; Rufaut & Gibbs Citation2003; Watts et al. Citation2011). Conversely, Sinclair et al. (Citation2005) recorded a significant decrease in invertebrate diversity following rat eradication on Kapiti Island, although increased insectivorous bird densities and fluctuating weather patterns could have influenced this result. Watts et al. (Citation2014) also found that beetles did not dramatically increase in abundance or species richness after intensive mammal control at two biodiversity sanctuaries. However, most invertebrate species lack studies assessing the effects of predator impacts on their population viability. It is likely that some species, particularly larger species, are more vulnerable than others (Gibbs Citation1998; Ruscoe et al. Citation2013), so the notion that introduced predators impact on large invertebrate populations across a range of species and ecosystem types requires further investigation, as does the identity of significant predators. Decreases in mammalian predator pressure following pest control must be carefully disentangled from the impacts of increased insectivorous birds (Watts et al. Citation2014).
Similarly to the finding of Watts et al. (Citation2010) for giant wētā, we suggest that tracking tunnels have potential for indexing cave wētā; they appear more efficient than using visual counts because the tracking tunnels can be left over several nights whereas searches have to be repeated if few wētā are active. In addition, tunnels are relatively cheap to run, and observers can take advantage of a comprehensive pre-existing network of standardised tracking tunnel lines being monitored for predators around the country (Gillies & Williams Citation2002). However, caution should be observed when inferring trends in wētā numbers until further calibration has been undertaken, largely because tracking results may be biased if wētā, or predators, return more often to tunnels on successive nights once they have consumed baits or if the predators using tunnels influence wētā tracking in a biased manner.
Acknowledgements
We are grateful to Shanna Rose, Jason van de Wetering, Maddie van de Wetering, Dan Palmer, Antje Leseberg, and Kerry Weston for assisting with field trials, Peter Johns for identifying wētā, and Eric Edwards, Stephen Hartley, Corinne Watts, Chris Green and Warren Chinn for providing valuable advice on the design of the trials. Corrine Watts and an anonymous reviewer provided helpful comments that improved this manuscript.
Associate Editor: Dr Rob Cruickshank.
Disclosure statement
No potential conflict of interest was reported by the authors.
Additional information
Funding
References
- Bellingham PJ, Lee WG. 2006. Distinguishing natural processes from impacts of invasive mammalian herbivores. In: Allen RB, Lee WG, editors. Biological invasions in New Zealand. Ecological Studies 186. Berlin: Springer-Verlag Heidelberg; p. 323–338.
- Bleakley C, Stringer I, Robertson A, Hedderley D. 2006. Design and use of artificial refuges for monitoring adult tree weta, Hemideina crassidens and H. thoracica. DOC Research & Development Series No. 233. Wellington: Department of Conservation.
- Brown KP, Moller H, Innes J, Alterio N. 1996. Calibration of tunnel tracking rates to estimate relative abundance of ship rats (Rattus rattus) and mice (Mus musculus) in a New Zealand forest. New Zeal J Ecol. 20:271–275.
- Caro TM, O'Doherty G. 1999. On the use of surrogate species in conservation biology. Conserv Biol. 13:805–814. doi:10.1046/j.1523-1739.1999.98338.x.
- Caughley GC. 1977. Analysis of vertebrate populations. New York: John Wiley and Sons.
- Chappell EM, Webb DS, Tonkin JD. 2014. Notes on sexual size dimorphism, sex ratio and movements of adult ground weta Hemiandrus maculifrons (Walker)(Orthoptera: Anostostomatidae). New Zeal Entomol. 37:83–92. doi: 10.1080/00779962.2013.856377
- Cook LD, Trewick SA, Morgan-Richards M, Johns PM. 2010. Status of the New Zealand cave weta (Rhaphidophoridae) genera Pachyrhamma, Gymnoplectron and Turbottoplectron. Invertebr Syst. 24:131–138. doi: 10.1071/IS09047
- Daniel ML. 1973. Seasonal diet of the ship rat (Rattus rattus rattus) in lowland forest in New Zealand. Proc New Zeal Ecol Soc. 20:21–30.
- Fitness JL, Morgan-Richards M, Ball OP, Godfrey AJR, Trewick SA. 2015. Improved resolution of cave weta diversity (Orthoptera: Rhaphidophoridae): ecological implications for Te Paki, Far North, New Zealand. New Zeal J Zool. 42:1–16. doi:10.1080/03014223.2014.983939.
- Fowler J, Cohen L, Jarvis P. 1998. Practical field statistics for field biology. Chichester: John Wiley & Sons.
- Gibbs GW. 1998. Why are some weta (Orthoptera: Stenopelmatidae) vulnerable yet others are common? J Insect Conserv. 2:161–166. doi:10.1023/A:1009660200402.
- Gillies C, Williams D. 2002. Using tracking tunnels to monitor rodents and other small mammals. Department of Conservation unpublished report HAMRO-60778. Hamilton: DOC Northern Regional Office.
- Green CJ. 2002. Recovery of invertebrate populations on Tiritiri Matangi Island, New Zealand following eradication of Pacific rats (Rattus exculans) [abstract]. In: Veitch CR, Clout MN, editors. Turning the tide: the eradication of invasive species. Gland, Switzerland; Cambridge, UK: IUCN SSC Invasive Species Specialist Group; p. 407.
- Hammond A, Adriaanse A, Rodenburg E, Bryant D, Woodward R. 1995. Environmental indicators: a systematic approach to measuring and reporting on environmental policy performance in the context of sustainable development. Washington, DC: World Resources Institute.
- Huggins RM. 1991. Some practical aspects of conditional likelihood approach to capture experiments. Biometrics. 47:725–732. doi:10.2307/2532158.
- Hoare JM, Adams LK, Bull LS, Towns DR. 2007. Attempting to manage complex predator-prey interactions fails to avert imminent extinction of a threatened New Zealand skink population. J Wildlife Manage. 71:1576–1584. doi:10.2193/2006-488.
- Hoare JM, O'Donnell CFJ, Westbrooke I, Hodapp D, Lettink M. 2009. Optimising the sampling of skinks using artificial retreats based on weather conditions and time of day. Appl Herpetol. 6:379–390. doi:10.1163/157075309X12531848432985.
- Hoare JM, O'Donnell CFJ, Wright EF. 2010. Selection of indicator species for state of the environment reporting: a case study from New Zealand. Pac Conservat Biol. 16:76–82. doi: 10.1071/PC100076
- Innes J, Kelly D, Overton JM, Gillies C. 2010. Predation and other factors currently limiting New Zealand forest birds. New Zeal J Ecol. 34:86–114.
- Jamieson IG, Forbes MR, McKnight EB. 2000. Mark-recapture study of mountain stone weta Hemideina maori (Orthoptera: Anostostomatidae) on rock tor ‘islands’. New Zeal J Ecol. 24:209–214.
- Johns P. 1997. The Gondwanaland weta: family Anostostomatidae (formerly in Stenopalmatidae, Henicidae or Mimnermidae): nomenclatural problems, world checklist, new genera and species. J Orthoptera Res. 6:125–138. doi:10.2307/3503546.
- Lee W, McGlone M, Wright E. 2005. Biodiversity inventory and monitoring: a review of national and international systems and a proposed framework for future biodiversity monitoring by the Department of Conservation. Wellington: Landcare Research.
- Luff ML. 1975. Some features influencing the efficiency of pitfall traps. Oecologia. 19:345–357. doi:10.1007/BF00348110.
- McIntyre ME. 2001. The ecology of some large weta species in New Zealand. In: Field LH, editor. The biology of wetas, king crickets and their allies. Wallingford: CABI Publishing; p. 231–242.
- Monks JM, O'Donnell CFJ, Wright EF. 2013. Selection of potential indicator species for measuring and reporting on trends in widespread native taxa in New Zealand. DOC Research and Development Series 338. Wellington: Department of Conservation.
- Monteith GB, Field LH. 2001. Australian king crickets: distribution, habitats and biology (Orthoptera: Anostostomatidae). In: Field LH, editor. The biology of wetas, king crickets and their allies. Wallingford: CABI Publishing; p. 79–94.
- O'Donnell CFJ. 2000. Influence of season, habitat, temperature, and invertebrate availability on nocturnal activity by the New Zealand long-tailed bat (Chalinolobus tuberculatus). New Zeal J Zool. 27:207–221. doi: 10.1080/03014223.2000.9518228
- O'Donnell CFJ, Hoare JM. 2012. Quantifying the benefits of long-term integrated pest control for forest bird populations in a New Zealand temperate rainforest. New Zeal J Ecol. 36:131–140.
- O'Donnell CFJ, Phillipson SM. 1996. Predicting the occurrence of mohua predation from the seedfall, mouse and predator fluctuations in beech forests. New Zeal J Zool. 23:287–293. doi:10.1080/03014223.1996.9518087.
- Pledger S. 2000. Unified maximum likelihood estimates for closed population capture-recapture models for mixtures. Biometrics. 54:888–898. doi:10.2307/2533843.
- Pollock KH, Nichols JD, Simons TR, Farnsworth GL, Bailey LL, Sauer JR. 2002. Large scale wildlife monitoring studies: statistical methods for design and analysis. Envirometrics. 13:105–119. doi:10.1002/env.514.
- Pryde MA, O'Donnell CFJ, Barker RJ. 2005. Factors influencing survival and long-term population viability of New Zealand long-tailed bats (Chalinolobus tuberculatus): implications for conservation. Biol Conserv. 126:175–185. doi: 10.1016/j.biocon.2005.05.006
- Ramsay GW. 1978. A review of the effect of rodents on the New Zealand invertebrate fauna. In: Dingwall PR, Atkinson IA, Hay C, editors. The ecology and control of rodents in New Zealand nature reserves. Department of Lands and Survey Information Series No. 4. Wellington: Department of Lands and Survey; p. 89–97.
- R Development Core Team. 2012. R: a language and environment for statistical computing. In: vol 2013. Vienna, Austria: R Foundation for Statistical Computing.
- Rufaut CG, Gibbs GW. 2003. Response of a tree weta population (Hemideina crassidens) after eradication of the Polynesian rat from a New Zealand island. Restor Ecol. 11:13–19. doi: 10.1046/j.1526-100X.2003.00058.x
- Ruscoe WA, Sweetapple PJ, Perry M, Duncan RP. 2013. Effects of spatially extensive control of invasive rats on abundance of native invertebrates in mainland New Zealand forests. Conserv Biol. 27:74–82. doi:10.1111/j.1523-1739.2012.01932.x.
- Sinclair L, McCartney J, Godfrey J, Pledger S, Wakelin M, Sherley G. 2005. How did invertebrates respond to eradication of rats from Kapiti Island, New Zealand?. New Zeal J Zool. 32:293–315. doi:10.1080/03014223.2005.9518421.
- Smith DH, Jamieson IG, Peach RM. 2005. Importance of ground weta (Hemiandras spp.) in stoat (Mustela erminea) diet in small montane valleys and alpine grasslands. New Zeal J Ecol. 29:207–214.
- Tocher MD. 2006. Survival of grand and Otago skinks following predator control. J Wildlife Manage. 70:31–42. doi:10.2193/0022-541X(2006)70[31:SOGAOS]2.0.CO;2.
- Trewick SA, Morgan-Richards M. 2000. Artificial weta roosts: a technique for ecological study and population monitoring of tree weta (Hemideina) and other invertebrates. New Zeal J Ecol. 24:201–208.
- UNEP-WCMC. 2009. International expert workshop on the 2010 biodiversity indicators and post-2010 indicator development. Cambridge: UNEP-WCMC.
- Wardle DA, Barker GM, Yeates GW et al. 2001. Introduced browsing mammals in natural New Zealand forests: aboveground and belowground consequences. Ecol Monogr. 71:587–614. doi:10.1890/0012-9615(2001)071[0587:IBMINZ]2.0.CO;2.
- Watts CH, Armstrong DP, Innes J, Thornburrow D. 2011. Dramatic increase in weta (Orthoptera) following mammal eradication on Maungatautari—evidence from pitfalls and tracking tunnels. New Zeal J Ecol. 35:261–272.
- Watts CH, Stringer I, Thornburrow D, MacKenzie D. 2010. Are footprint tracking tunnels suitable for monitoring giant weta (Orthoptera: Anostostomatidae)? Abundance, distribution and movement in relation to tracking rates. J Insect Conserv. 15:433–443. doi:10.1007/s10841-010-9321-3.
- Watts CH, Thornburrow D, Cave V, Innes J. 2014. Beetle community changes following pest mammal control at two biodiversity sanctuaries in Wellington, New Zealand. J Roy Soc New Zeal. 44:61–87. doi:10.1080/03036758.2013.875478.
- Watts CH, Thornburrow D, Green CJ, Agnew WR. 2008. Tracking tunnels: a novel method of detecting a threatened New Zealand giant weta (Orthoptera: Anostostomatidae). New Zeal J Ecol. 32:92–97.
- White GC, Burnham KP. 1999. Program MARK: survival estimation from populations of marked animals. Bird Study. 46:S120–S139. doi:10.1080/00063659909477239.
- Worthy TH, Holdaway RN. 2002. The lost world of the moa: prehistoric life of New Zealand. Bloomington/Christchurch: Indiana University Press/Canterbury University Press.