
ABSTRACT
The little penguin Eudyptula minor is primarily an inshore forager with its range generally limited to c. 30 km of breeding sites during the nesting period. However, exceptions with greater foraging distances have been recorded in Australia. To investigate the foraging range plasticity in New Zealand we used GPS tracks gathered on 68 individuals in three regions of central New Zealand between 2011 and 2016. Foraging patterns varied between sites and between years. Tracks revealed that penguins can rely on distant foraging areas while incubating, with nesting birds travelling up to 214 km to feed. Isotope analyses of blood samples showed that this distant food across deep waters (0–200 m) is likely to be squid dominated. During the chick rearing period, birds undertook a diet shift to a higher trophic level while foraging closer to their colony, and possibly near river plumes. These findings highlight the need to consider the little penguins’ large potential foraging ranges when managing threats and changes to the environment.
Introduction
The little penguin (Eudyptula minor) is endemic to Australasia with a breeding range between 26°S–47°S and 115°E–176°W (Marchant and Higgins Citation1990). One species of little penguin is currently recognised by New Zealand authorities (Gill et al. Citation2010), although DNA analyses by Grosser et al. (Citation2015) suggest two distinct lineages treated as separate species: Eudyptula novaehollandiae, predominantly in Australia and southeastern New Zealand (hereafter, the Australian taxon) and Eudyptula minor, occurring throughout the remainder of New Zealand and the Chatham Islands (hereafter, the New Zealand taxon) (Overeem et al. Citation2008; Peucker et al. Citation2009; Grosser et al. Citation2016). The Australian taxon is known to feed predominantly within 30 km of its nests during the chick rearing stage (Hoskins et al. Citation2008; Agnew Citation2014; Pelletier et al. Citation2014), as does the New Zealand taxon (Mattern et al. Citation2001; Zhang et al. Citation2015). Unusually long foraging trips have been recorded only in the eastern Great Australian Bight where penguins foraged up to 118 km from their nests (Wiebkin et al. Citation2005).
Little penguins breed in waters of annual mean sea surface temperature (SST) between 14–22 °C in Australia and 11–18 °C in New Zealand (Uddstrom & Oien Citation1999). They forage by diving mostly at depths less than 50 m (Chiaradia et al. Citation2007) to feed on fish, squid and crustaceans. Their diet is dominated by pilchard (Sardinops sagax) and anchovy (Engraulis australis) in Australia (Chiaradia et al. Citation2010), while in New Zealand the key prey are the slender sprat (Spratelloides gracilis), Graham’s gudgeon (Grahamichthys radiata) (Fraser & Lalas Citation2004) and arrow squid (Nototodarus sloanii; Flemming et al. Citation2013), although there is variation in dietary composition between sites.
Many other aspects of the little penguin’s biology also vary across its range. The breeding schedule spans the period between April and December with both intra and interpopulation variation (Marchant & Higgins Citation1990). Different environmental drivers affecting the onset of breeding have been identified: for the Australian taxon (including Otago populations), earlier laying dates within a colony have been correlated with a higher SST at some sites (Cullen et al. Citation2009), but with lower SST at others (Perriman et al. Citation2000; Berlincourt & Arnould Citation2015). Further, higher SST has been correlated with both higher (Cullen et al. Citation2009; Agnew et al. Citation2015) and lower breeding success (Cannell et al. Citation2012).
In contrast to the Australian taxon, the penguins in the New Zealand taxon raise only one clutch per breeding season (Bull Citation2000; Heber et al. Citation2008). The foraging behaviour and breeding success also differ between the two taxa (Mattern et al. Citation2004; Numata et al. Citation2004). These complex relationships suggest a range of factors influencing the habitat suitability for little penguins. Although the species has received considerable research (Chambers et al. Citation2014), spatial requirements for the New Zealand taxon have been studied only twice, each time during a single breeding season (Mattern et al. Citation2001; Zhang et al. Citation2015).
The penguins’ foraging areas are known to be influenced by areas of enhanced productivity such as frontal zones (Bost et al. Citation2009), eddies (Bon et al. Citation2015), upwelling (Crawford et al. Citation2007) or seamounts (Kokubun et al. Citation2015) where food resources are more predictable within a highly variable marine environment. As a result of terrestrial run-off, river plumes with a high nutrient concentration enhance primary production in a down-plume direction (Dagg et al. Citation2004). These areas of high productivity are also selectively used as foraging areas by flying seabirds (Matsumoto et al. Citation2016) and the little penguins in Australia (Kowalczyk et al. Citation2015b).
Given the variability observed in the breeding and foraging behaviour of little penguins across their range, we used tracking devices and analyses of isotope ratios to examine the foraging behaviour of the New Zealand little penguin taxon at three different breeding sites (with different marine habitat characteristics), and over several years. We expected to find plasticity in the species’ behaviour as they adapt to local environmental variations. We also examined whether penguins selectively foraged near river plumes when these occurred within their range.
Methods
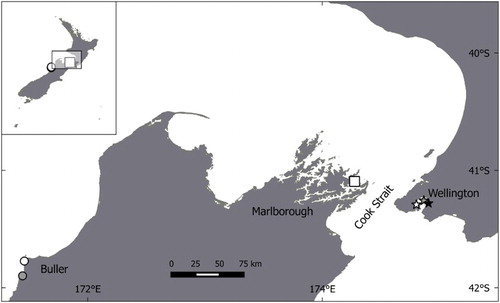
The study was conducted in three regions of New Zealand (). The first site, Wellington, included three colonies within Wellington Harbour: Balaena Bay (−41.292°S, 174.802°E); Matiu/Somes Island (−41.258°S, 174.865°E); and Days Bay (−41.276°S, 174.903°E), which together host c. 200 breeding pairs of little penguins. Banding records show bird exchange between these colonies (G. Taylor, pers. obs.). Wellington Harbour is shallow, with depth mostly less than 20 m (NIWA Citation2016) and it receives the discharge from the Hutt River, on average 22 m3/s (Young & Foster Citation1986). The second site, in Marlborough Region, was at Motuara Island (−41.094°S, 174.272°E) near the mouth of Queen Charlotte Sound (hereafter, the Sound) where c. 300 pairs breed (Renner & Davis Citation1999). The Sound does not have any major rivers draining into it, and it is mostly less than 50 m deep. It opens onto Cook Strait, which plunges to depths of 100 m only 9 km north of the colony. The third site, in the Buller Region, included two colonies: Cape Foulwind (−41.093°S, 174.271°E) and Nile River (−41.890°S, 171.453°E). These two colonies were 15 km distant from each other and together they contain c. 75 pairs (K-J. Wilson, pers. obs.). The bathymetry at this site follows the gently sloping continental shelf: 50 m deep at 7 km offshore; 100 m at 13 km; and 150 m at 23 km. The Nile River, a river of 16 m3/s (K. Walter, NIWA, 2017), and the very large Buller River (423 m3/s) occur to the south and north of these colonies, respectively.
Figure 1. Location of the study sites in central New Zealand. Sites are in Buller Region at Nile River (grey circle) and Cape Foulwind (white circle); Marlborough at Motuara Island (white square) and Wellington at Balaena Bay (white star), Matiu/Somes Island (grey star) and Days Bay (black star).
Unmarked breeding birds were captured by hand at their nest or near the nest on their way to/from the sea. GPS tracking devices were attached to the bird, with a maximum of one bird per nest per breeding stage. The aim was to record one foraging trip for each deployment. Handling procedures lasted less than 10 min and the heads of the penguins were covered to minimise stress. Both males and females were tracked during incubation and/or the chick rearing stage. Loggers were deployed on the central dorsal area (Chiaradia et al. Citation2005) with Tesa 4651 waterproof tape following Wilson et al. (Citation1997) in order to minimise feather damage. As the dataset was collected by several different teams, different kinds of GPS loggers and satellite search times were used (). Sample sizes and numbers of tracks recorded per site are shown in . Zhang et al. (Citation2015) describes attachment techniques used at Matiu/Somes Island. The most commonly used loggers for the remaining studies were IgotU GT-120 GPS units (Mobile Action Technology), sealed in waterproof heat-shrink tubing and measuring 80 × 25 × 12 mm. The dry-weight of the whole package was 25 g and represented 2.5 ± 0.2% of the bird’s weight. Most birds were weighed in a bag with a spring balance (± 25 g) prior to and after their trips. Breeding success was defined as the mean number of chicks fledged per pair, monitored by weekly burrow checks with burrowscope Taupe (Sextant Technology Ltd.) until 9 November (chicks fledging) for Marlborough and by nest box checks at the start and end of the breeding season for penguins in the Wellington and Buller study sites.
Table 1. GPS loggers used to track little penguins at each study site each year.
Table 2. Tracking parameters (mean ± SD) obtained from 68 little penguins tracked at three sites in central New Zealand between 2011 and 2016.
Spatial analysis
A foraging trip was defined by the time spent at sea by an individual between its departure from the colony and its return. All the locations were filtered using the method of Austin et al. (Citation2003) in the package ‘DiveMove’ (Luque Citation2007) developed in the R software (R Core Team Citation2016). Unrealistic travel speed greater than 2 m/s (Hoskins et al. Citation2008) were removed, involving 3% of the locations. The GPS technology we used show where the penguins went and how long they stayed there. When the sample sizes were equal or greater than three individuals, their spatial distribution was determined by the kernel-density estimation (Worton Citation1989) with the KernelUD function in R package ‘adehabitat’ (Calenge Citation2006). The 95% utilisation distribution (UD) represent the overall activity area, including transit and foraging with no distinction (Brothers et al. Citation1998). However, the 50% UD, referred to as the focal area, represent the places where the largest concentrations of locations occurred. Hence, the focal area is likely to represent the most important foraging areas (Wood et al. Citation2000). A test with resampled tracks (to get the same sampling interval between loggers) against the pooled data showed no significant difference between resulting UDs. As kernels rely on a probability function (Worton Citation1989) rather than the number of locations, we kept the pooled data. The h smoothing factor, which depends on the spread of the UDs, was defined for the first time by the software (hdef method) and then by ourselves, with a value fitting all the results from the same site or same period in order to allow accurate comparisons (). Areas were calculated using the kernel.area function.
To investigate similarity in foraging areas over the years, the spatial overlap between 50% UDs was calculated using the kerneloverlap function. The overlap index was calculated with the Bhattacharyya’s Affinity as it is appropriate to quantify the overall similarity between UDs (Fieberg & Kochanny Citation2005). All the kernels were plotted in the software QGIS (QGIS Development Team Citation2016). Tracking parameters (maximum range, total distance travelled, trip duration) were calculated for complete tracks only (). Incomplete tracks due to logger failures were excluded from the calculations.
To investigate a possible influence of river outflow on penguin foraging range, we calculated the distance between the mouth of the nearest large river and each study colony in GIS (QGIS Development Team Citation2016). A river was arbitrarily considered large when its mean flow was greater than 10 m3/s (Young & Foster Citation1986). The distance was plotted against the mean maximum foraging distance known for the colony. We used our study sites and added data from Agnew (Citation2014) for a study of penguins near Oamaru in these analyses. The relationship between maximum foraging range and distance to a large river was tested using a linear regression with data pooled across years at each site.
Isotope analyses
To estimate the potential diet of penguins, blood samples were collected from birds at the Marlborough study site in 2015. A sample of 0.1 mL blood was taken from the tarsal vein at logger retrieval and stored in 70% ethanol. We investigated potential differences in the penguins’ diet between breeding stages, using the stable isotope ratios of carbon (13C/12C) and nitrogen (15N/14N) in the whole blood. These ratios change in a predictable and quantifiable way along the food chain (Hobson & Clark Citation1992a, Citation1992b). As δ15N increases with the trophic level and δ13C varies according to the area that prey come from, isotopes allow determination of the relative trophic levels and detection of prey consumption from inshore versus offshore waters (Hobson et al. Citation1994). Less intrusive than stomach flushing techniques, the isotopic niche is a proxy of the trophic niche (Jaeger et al. Citation2010). Isotope ratios in whole blood reflect a period of dietary integration of about 4 weeks (Bearhop et al. Citation2002). Blood samples were freeze-dried for processing and subsampled with 0.5 mg of ground and dried blood loaded into separate tin capsules. Carbon and nitrogen content and isotopic composition were analysed in duplicate using an Isoprime isotope ratio mass spectrometer interfaced to a EuroEA elemental analyser in continuous-flow mode (EA-IRMS). Working reference standards (leucine, EDTA, caffeine, hair and sucrose) were calibrated against international reference materials (IAEA-N1, IAEA-N2, IAEA-CH6 and IAEA-CH7) and blanks were included during each run for calibration. Isotopic ratios (15N/14N and 13C/12C) are expressed as isotopic deviations defined as:where Rs is the isotopic ratio measured for the sample and Rref is the international standard. The δ13C value is relative to the international Vienna Pee Dee Belemnite (VPDB) standard, and the δ15N value is relative to atmospheric air. Raw values were normalised using internal standards calibrated to international standards and results are expressed in points per thousand (‰) versus the specific reference. Analytical precision of the measurements is ± 0.2‰, and reproducibility of the results is within ± 0.2‰ for carbon and ± 0.3‰ for nitrogen (1σn). Isotopic niches were compared between stages from Bayesian standard ellipses computed in the R package ‘siar’ (Parnell & Jackson Citation2013).
Statistics
Due to the small sample sizes at some sites, and the lack of data for some years, statistics were limited to site and/or breeding stage comparisons within the same year. We reduced possible autocorrelation of trips by considering only the birds’ first foraging trip, when they did several consecutive short trips. Prior to performing statistical tests, data exploration revealed non-normality, so site and breeding stage comparisons were performed with a non-parametric Kruskal-Wallis rank sum test. With the isotope results we tested for differences in isotopic niche between breeding stages at one site using a one-way ANOVA. Results are shown by mean ± standard deviation.
Results
Inter-stage variability
Wellington penguins foraged mostly within Wellington Harbour and within 12 ± 12 km of their colony (). During the incubation and chick rearing stages, trip duration was between 1 and 3 days. Two incubating birds also did trips into Cook Strait and Palliser Bay up to 36 km from their colony. The tracking parameters () showed no differences in their range (H(1) = 1.63, P = 0.2), distance travelled (H(1) = 0.4, P = 0.5) or trip duration (H(1) = 0.1, P = 0.6) between breeding stages.
Figure 2. Inter-annual variability of Wellington penguins foraging areas between 2011, 2012 and 2014. The light grey area represents the home range (95% UD), the dark grey the focal area (50% UD). Study colonies are shown by stars: grey for Matiu/Somes Island, white for Balaena Bay and black for Days Bay. The black circle shows the Hutt River mouth. The dashed line is 50 m bathymetric contour; the solid line is 100 m.
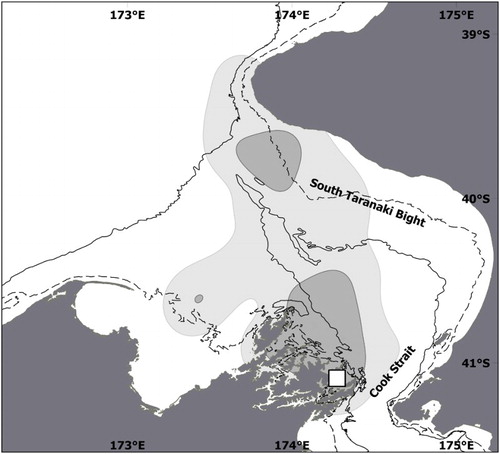
At the other study sites, trip parameters did differ between stages (). In Marlborough in 2015, incubating birds foraged within 102 ± 69 km of their colony (minimum = 1 km, maximum = 214 km) and their trips lasted 7 ± 4 days (minimum = 1 day, maximum = 16 days). Three birds undertook short-distance trips within 10 km of the colony. Three other birds undertook medium-distance trips 40–75 km from the colony towards Cook Strait and other areas of the Marlborough Sound. Eight birds crossed Cook Strait to forage 93–214 km away, as far as the Taranaki Bight on the west coast of the North Island (). After trips during the incubation period, birds came back 75 ± 70 g heavier (minimum = −50 g, maximum = + 175 g).
Figure 3. Foraging areas of Motuara Island little penguins during incubation stage in 2015. The light grey area represents the home range (95% UD), the dark grey the focal area (50% UD). Study colony is shown by the white square. The dashed line is 50 m bathymetric contour; the solid line is 100 m.
A total of 66% of the nests belonging to birds undertaking short-distance trips were successful (breeding success = 1 ± 1 chick per pair). In contrast, all the nests tended by birds undertaking medium-distance trips failed: the chicks hatched but were not fed. However, a total of 75% of nests tended by birds undertaking long-distance trips (range = 104–173 km, up to 13 days) were successful. Only two birds (which went 169 and 214 km away for 9 and 11 days, respectively) failed to provision their chicks. Such long trips did not reduce breeding success (H(2) = 0.5, P = 0.9; ) and eventually these nests had the best breeding success (1.3 ± 0.9 chick per pair).
Figure 4. Boxplot of the incubation foraging range distributions by breeding success (n = 14). Long foraging trips are also undertaken by successful birds.
At chick rearing stage, birds undertook shorter trips (H(1) = 9.6, P = 0.001) closer to the colony (H(1) = 10.6, P = 0.001). They fed within 6–10 km in and outside the Sound during 1-day trips, and 36–43 km away in Cook Strait during 2-day trips. They came back to the colony 57 ± 86 g heavier (minimum = −75 g, maximum = + 225 g), but these measures may be biased as some birds were weighed before feeding chicks and others afterwards.
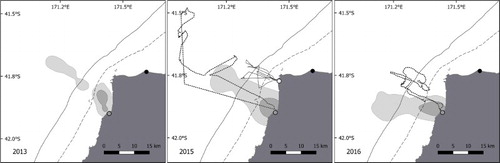
Inter-stage differences were also evident in Buller Region with longer tracks undertaken during incubation (), but the sample sizes (n = 1 for both 2015 and 2016) were too small to be statistically tested.
Figure 5. Inter-annual variability of Buller little penguin foraging areas between 2013, 2015 and 2016. The light grey area represents the home range (95% UD), the dark grey the focal area (50% UD). Study colonies are shown by the circles: grey for Nile River, white for Cape Foulwind. Tracks not included in kernel calculation due to small samples sizes are shown: in 2015, incubation track from Nile River (dotted line) and chick-rearing stage track from Cape Foulwind (black line), and in 2016 an incubation track from Nile River (dotted line). The black circle shows the Buller River mouth. The dashed line is 50 m bathymetric contour; the solid line is 100 m.
Inter-site variability
Within each year, the penguins’ tracks showed significant differences between sites (). Marlborough penguins performed longer duration trips (H(1) = 3.75, P = 0.003), travelled to locations farther away (H(1) = 6.72, P = 0.009) and covered more distance (H(1) = 3.83, P = 0.05) than the Wellington Harbour penguins tracked during the same months in 2014. Marlborough penguins showed no significant differences when compared to Buller birds in their range (F(1) = 1.4, P = 0.24), distance travelled (F(1) = 0.65, P = 0.42) or trip duration (H(1) = 48, P = 0.06) while raising chicks in 2015.
Inter-annual variability
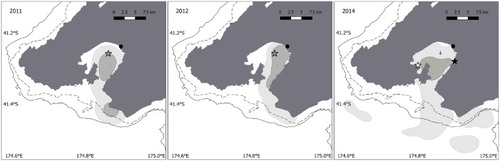
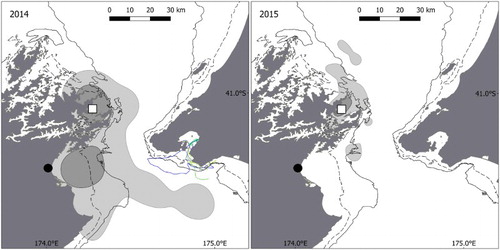
Between years, the Wellington and Buller penguins used a similar range. At Wellington, over 3 years (), no significant differences occurred in their range distance (H(2) = 3.11, P = 0.21). On a scale from 0 to 1, their focal areas overlapped by 0.87, 0.75 and 0.8 for 2011/2012, 2012/2014 and 2011/2014 comparisons, respectively. In Buller () the birds also used a similar range over 3 years (H(2) = 2.4, P = 0.3) and the overlap in focal areas was 0.63, 0.42 and 0.77 for 2013/2015, 2013/2016 and 2015/2016 comparisons, respectively. However, inter-annual variations occurred in Marlborough (). Penguins raising chicks spent longer at sea (H(1) = 15.7, P = < 0.001), travelled greater distances (H(1) = 5.3, P = 0.02) and went further away (H(1) = 6.6, P = 0.01) in 2014 than in 2015. These differences were reflected in the breeding outputs, with productivity per pair of 0.13 and 1 chicks fledged per pair in 2014 and 2015, respectively (). In 2014, penguins also used a foraging area two times larger, including visited localities not used in 2015 ().
Figure 6. Inter-annual variability of Marlborough little penguin foraging areas between 2014 and 2015. The light grey area represents the home range (95% UD), the dark grey the focal area (50% UD). Study colony is shown by the white square; the black circle shows the Wairau River mouth. The dashed line is 50 m bathymetric contour; the solid line is 100 m.
Isotopic niche
The stable isotope ratios for Marlborough birds in 2015 revealed a dietary shift between breeding stages. Both δ13C and δ15N values were significantly different (F(1) = 7.3, P = 0.01 and F(1) = 4.9, P = 0.03, respectively). Isotopic niches, represented by the ellipses (), showed an area of 0.8 for incubating birds compared with 0.3 for birds raising chicks. This suggests that birds sampled during the incubation period fed on a broader range of offshore-dominated prey. In contrast, birds sampled while feeding chicks fed on a narrower range of prey from higher trophic levels, from inshore-dominated prey. The small overlap between the two isotopic niches (3.8% of the incubation ellipse and 10.9% of the chick rearing ellipse) showed a clear segregation between stages, coinciding with a spatial shift in their foraging areas. The offshore carbon signature corresponded to birds foraging mostly across the Cook Strait, while the inshore carbon signature corresponded to birds foraging mostly in and off the mouth of the Sound.
Figure 7. Whole blood δ13C and δ15N values of tracked little penguins during incubation (black triangles, n = 14) and during chick rearing (grey circles, n = 16). Standard Bayesian ellipse areas corrected (solid line) and uncorrected (dashed lines) for small sample sizes are shown for incubation and chick rearing (black and grey lines, respectively).
River distance
Birds nesting further from large rivers foraged at greater distances from their nests. We found a positive relationship between the mean maximum foraging distance and distance to a large river. This correlation did not hold during chick rearing (R2 = 0.06, t = 0.2, NS) but was significant during incubation (R2 = 0.96, t = 6.8, P = 0.02) ().
Figure 8. Relationship between the mean maximum foraging range and the distance from colony to a major river (> 10 m3/s). Little penguins nesting far from a river had a greater foraging range. Study colonies are shown by symbols. Solid symbols represent data for the incubation stage and open symbols for the chick-rearing stage.
Discussion
Inter-site variability
The foraging range of little penguins in central New Zealand showed strong differences between sites. Our study of GPS tracks revealed that most of the variability in foraging ranges between colonies occurred during the incubation period. Furthermore, the tracks we obtained from penguins at the Buller and Marlborough sites challenge the assumption that little penguins are exclusive near-shore feeders. Thus, the long trips of little penguins reported by Wiebkin et al. (Citation2005) from the Great Australian Bight are not an exception; rather, they demonstrate the adaptability of this species to a range of marine habitats. Strong site effects appear to influence the foraging behaviour of little penguins across their range. Similar results have been found for the Magellanic penguin (Spheniscus magellanicus; Wilson et al. Citation2005) and the Humbolt penguin (S. humbolti; Hennicke & Culik Citation2005), and explained by site-specific prey distributions and abundance. As the foraging trip distance is negatively correlated with prey availability (Inchausti et al. Citation2003; Ballard et al. Citation2010), it is likely that little penguins undertook long foraging trips offshore because of poorer prey accessibility near the colony.
In contrast to the behaviour of penguins during the incubation stage, birds behaved more like classic inshore foragers during the chick rearing stage, as noted in the previous tracking results from Motuara Island (Mattern et al. Citation2001), Wellington (Zhang et al. Citation2015), Otago (Agnew Citation2014) and Australia (Hoskins et al. Citation2008; Pelletier et al. Citation2014; Kowalczyk et al. Citation2015a). It is likely that the limited ability of chicks to fast constrains the breeders’ range at this stage. Only at Motuara Island in 2014 did birds maintain a large foraging range. The birds at this site are known to have a high diving effort (Mattern et al. Citation2004; Chiaradia et al. Citation2007) and these long trips appear to be associated with low prey availability (Inchausti et al. Citation2003; Ballard et al. Citation2010) in the Sound. Only the breeding birds from inside a large harbour (Wellington) showed a stable foraging range. Further work associating prey abundance, foraging strategy and isotopic niche in a gradient of oceanic to sheltered inshore breeding sites would be useful to understand how environmental conditions influence breeding strategies and how little penguins from both New Zealand and Australian taxa can adapt to perturbations in their environment (Ancel et al. Citation2013).
Inter-annual comparisons
Little penguins at the Wellington site showed a consistency between years, as was also recorded at Oamaru in New Zealand (Agnew Citation2014), in Bass Strait (Hoskins et al. Citation2008; Berlincourt & Arnould Citation2015) and at Port Phillip Bay (Kowalczyk et al. Citation2015a) in Australia. For Marlborough birds, the long-distance foraging trips had been suspected by previous workers at the same colony (Numata et al. Citation2000; Mattern et al. Citation2001; Renner & Davis Citation2001) and our records suggest that the South Taranaki Bight may be used each year during incubation. Inter-annual variability occurred at Motuara Island at chick rearing stage. As reproductive success is correlated with prey density (Croll et al. Citation2006) and foraging trip length (Boersma & Rebstock Citation2009), the differences in breeding success and foraging range observed between 2014 and 2015 suggest that little penguins experienced different prey availability within the Sound between years. Little penguins appear to adapt to low prey availability by increasing their foraging range and area. However, their low breeding success showed that they were unable to fully compensate for low prey availability during unusual environmental events conditions (Ropert-Coudert et al. Citation2015).
Inter-stage differences
While no significant effect of breeding stage was apparent for the Wellington Harbour nesting birds, penguins on the West Coast and Marlborough Sound sites did show clear differences between breeding stages. Incubating penguins usually undertook longer trips than chick rearing birds (Hull et al. Citation1997; Charrassin et al. Citation1998; Collins et al. Citation1999). This breeding stage difference was reinforced by the isotope results for Marlborough birds.
The nitrogen ratios from Motuara Island birds are among the lowest recorded for this species, comparable to those recorded at Stewart Island (Flemming & van Heezik Citation2014) where penguins have a squid dominated diet (Nototodarus sloanii) and comparable to a few individuals from Phillip Island (Chiaradia et al. Citation2016) where N. gouldi contribute to the diet. Penguins that feed mostly on fish species show isotope ratios that indicate a higher trophic level (Chiaradia et al. Citation2010; Flemming & van Heezik Citation2014; Chilvers et al. Citation2015). The eastern South Taranaki Bight, where Motuara Island penguin forage during incubation, is known to receive by horizontal advection the upwelled waters from the Tasman Basin (Bowman et al. Citation1983; Shirtcliffe et al. Citation1990). This phenomenon induces a phytoplankton bloom at intervals of 10–15 days, as well as a high macro-zooplankton biomass (James & Wilkinson Citation1988; Bradfordgrieve et al. Citation1993). This area of continental shelf also hosts two species of arrow squid (N. sloanii and N. gouldi) with a main spawning area for the latter (Uozumi & Forch Citation1995; Hurst et al. Citation2012). These squids hatch in April–May and, according to the ageing regression of Uozumi & Forch (Citation1995), they should have a dorsal mantle length (DML) between 40 mm and 64 mm by September (123 to 153 days later) when penguins forage there. Squids of comparable size (total length between 90–120 mm) are taken by little penguins (Flemming et al. Citation2013). Hence, the South Taranaki Bight squids are very likely to be part of the diet of Motuara Island penguins.
At chick rearing stage, trophic level enrichment has been recorded by Chiaradia et al. (Citation2012) with little penguins targeting small fish such as anchovies or pilchards (Dann et al. Citation2000). Peak energy requirements occur during chick rearing (Chiaradia & Nisbet Citation2006) when more ‘valuable’ prey such as energetically-rich fish are taken (Hislop et al. Citation1991). Marlborough penguins follow the same pattern, which can indicate a possible intentional search for fish or reflect just an opportunistic use of higher trophic level prey near the colony (Chiaradia et al. Citation2016). A pilchard fishery existed in Marlborough and Tasman Bay from the 1880s, but the fishery collapsed and closed in 1950 (Paul et al. Citation2001). Pilchard stock shortage is known in Australia to negatively affect the penguin populations (Dann et al. Citation2000), but we do not know how New Zealand penguins responded to this overfishing. To date, it is not known whether the fish stock has recovered, but it is noteworthy that pilchard has not been identified as a prey for penguins in New Zealand (Van Heezik Citation1990; Fraser & Lalas Citation2004; Lalas et al. Citation2004; Flemming et al. Citation2013).
Motuara Island, a predator-free site adjacent to a marine reserve, would initially appear to be an ideal habitat for little penguins. Surprisingly, they rely on a > 16,000 km2 area to feed, shunning the marine reserve. The Sound provided only part of their food in some years and then low prey availability led to poor breeding success. The Sound ecosystem is undergoing change, with sedimentation from forestry (Fahey & Coker Citation1992) and mussel aquaculture (Kaspar et al. Citation1985), as well as seabed dredging from scallop fisheries (Bull Citation1989). Tracking penguins nesting further into the Sound would be useful to explore in detail how the local ecosystem is used by the species. Birds nesting at the head of the Sound are likely to be too far from the open ocean to regularly feed in Cook Strait.
The westerly wind-driven upwelling (Stanton Citation1976; Bowman et al. Citation1983), which sustains the South Taranaki Bight food web, exposes the Marlborough penguins to wind variability. Wind direction and speed had significant influence on foraging mass gain for rockhopper penguins (Eudyptes chrysocome), with greatest gain with moderate westerlies and least gain with strong easterlies and storm conditions (Dehnhard et al. Citation2013). As wind can have a strong influence on little penguin prey availability (Dann & Chambers Citation2013), this may make some little penguin colonies in New Zealand sensitive to climate change if patterns of wind change as a result (Boning et al. Citation2008; Langlais et al. Citation2015).
Foraging area characteristics and relation to rivers
The relationship between foraging range and distance to a major river suggests that penguins could forage closer to the colony when a river enters the sea nearby. Nutrient-rich freshwater enhances phytoplankton production in the sea, with a maximum production in a down-plume direction located at an intermediate salinity gradient (Dagg et al. Citation2004). These fine-scale fronts, which are likely to attract penguin prey, induce a selective foraging at Port Philipp Bay (Kowalczyk et al. Citation2015b). River input can consist of a tongue-like freshwater mass at the river mouth, and penguin tracks showed movement by birds towards the Waitaki River mouth from the Oamaru colonies (Mattern et al. Citation2001; Agnew Citation2014) and the Ruamahanga River mouth from Wellington birds (C. Bost, Te Papa Tongarewa, unpubl. data, 2014). Large discharges and cumulative effects of rivers can also enhance a buoyant low-salinity surface layer transported by wind and current (Stanton Citation1976; Vincent et al. Citation1991) further offshore: 33‰ salinity surface water can be found up to 35 km off the west coast of New Zealand’s South Island (Stanton Citation1976). With large rainfall in New Zealand, freshwater-induced surface layers could be an alternative predictable prey resource, especially when the wind-driven coastal upwellings (Stanton Citation1976; Bowman et al. Citation1983) are subdued.
These freshwater inputs are undergoing change from agricultural intensification, with both water abstraction for irrigation and nutrient concentration changes (Wilcock et al. Citation2011). Through altering water quality, remote land-based activities can affect marine ecosystems (Fahey & Coker Citation1992; Schramm et al. Citation1996). Are little penguins affected by changes in freshwater inputs? With a potential relationship between New Zealand little penguins and large river outflows, this is a conservation management question worthy of further study.
Conservation implications of long-distance foraging
Our findings highlight the need for more research into the at-sea requirements of little penguins. Foraging range and main prey types vary between colonies, leading to potentially different habitat and resource requirements across the range of the species. Conservation efforts need to take this variation into account to protect little penguins which are currently in decline across New Zealand (BirdLife International Citation2016). Variable foraging ecology may expose little penguins to threats that, when it was thought only small ranges were used for foraging at sea, were not previously considered important. Our improved understanding of foraging range shows that little penguins may be exposed to dredging or seabed mining on foraging habitat far from known colonies. Penguins at the colonies we studied in Wellington, Buller and Marlborough all feed in areas where seabed mining and dredging activities have been proposed. Proposals for significant seabed disturbance are currently being assessed in the South Taranaki Bight and the west coast including Buller (Trans-Tasman Resources Citation2016), in Wellington Harbour and Cook Strait (CentrePort Citation2016). There are potential adverse effects of these activities for penguin populations because of sustained benthic disturbance increasing water turbidity and disrupting marine food webs. This may affect the penguins’ foraging efficiency, survivorship and breeding. A recent review of the status of little penguin populations in New Zealand (BirdLife International Citation2016) showed that there were few large (> 200 pairs) populations of little penguins in New Zealand (K-J. Wilson, West Coast penguin Trust, Te Papa, unpubl. data), of which two are in Marlborough and in Wellington Harbour. Threats to these populations therefore are significant at the taxon level.
Conclusion
Variable foraging ranges, and possibly influences of freshwater outflows in determining key foraging areas, appear to be a feature of New Zealand little penguin populations studied to date. The long distances travelled by little penguins also highlight the potential for adverse effects of dredging or seabed mining activities, even at some distance from known breeding sites. Even though little penguins are considered one of the better studied seabirds in the Australasian region (Chambers et al. Citation2014), the ecological processes driving the intra- and inter-population variability are still to be discovered. Further work for the New Zealand taxon is needed to assess the population’s viability in the face of a changing environment.
Acknowledgements
We thank the funders for this research: Te Papa, Deakin University, Department of Conservation (DOC) and University of Auckland. Also, thanks to the many volunteers and colleagues who assisted with the field programmes. We appreciate the advice, assistance and consent to work at the study sites from DOC, Te Atiawa, Port Nicholson Block Claim (Wellington); Te Atiawa ki te Waka a Maui Trust (Marlborough); and Ngai Tahu (Buller). Thank you to Jean Baptiste Thiebot for his advice on stable isotopes analysis. Thanks to the two anonymous reviewers who gave us helpful comments on the manuscript. Associate Editor: Jim Briskie.
Disclosure statement
No potential conflict of interest was reported by the authors.
ORCID
Timothée A. Poupart http://orcid.org/0000-0003-4120-933X
References
- Agnew P. 2014. Demographic parameters, foraging and responses to environmental variation of little penguins [Eudyptula minor]. Dunedin (NZ): University of Otago. Available from: https://ourarchive.otago.ac.nz/bitstream/handle/10523/5754/AgnewPhilippaM2015PhD.pdf?sequence=1.
- Agnew P, Lalas C, Wright J, Dawson S. 2015. Variation in breeding success and survival of little penguins Eudyptula minor in response to environmental variation. Marine Ecology Progress Series. 541:219–229. doi: 10.3354/meps11538
- Ancel A, Beaulieu M, Gilbert C. 2013. The different breeding strategies of penguins: a review. Comptes Rendus Biologies. 336:1–12. doi: 10.1016/j.crvi.2013.02.002
- Austin D, McMillan JI, Bowen WD. 2003. A three-stage algorithm for filtering erroneous Argos satellite locations. Marine Mammal Science. 19:371–383. doi: 10.1111/j.1748-7692.2003.tb01115.x
- Ballard G, Dugger KM, Nur N, Ainley DG. 2010. Foraging strategies of Adélie penguins: adjusting body condition to cope with environmental variability. Marine Ecology Progress Series. 405:287–302. doi: 10.3354/meps08514
- Bearhop S, Waldron S, Votier SC, Furness RW. 2002. Factors that influence assimilation rates and fractionation of nitrogen and carbon stable isotopes in avian blood and feathers. Physiological and Biochemical Zoology. 75:451–458. doi: 10.1086/342800
- Berlincourt M, Arnould JPY. 2015. Influence of environmental conditions on foraging behaviour and its consequences on reproductive performance in little penguins. Marine Biology. 162:1485–1501. doi: 10.1007/s00227-015-2685-x
- BirdLife International. 2016. Eudyptula minor. The IUCN Red List of Threatened Species 2016. Available from: http://dx.doi.org/10.2305/IUCN.UK.2016-3.RLTS.T22697805A93641015.en
- Boersma PD, Rebstock GA. 2009. Foraging distance affects reproductive success in Magellanic penguins. Marine Ecology Progress Series. 375:263–275. doi: 10.3354/meps07753
- Bon C, Della Penna A, d’Ovidio F, Arnould JYP, Poupart T, Bost CA. 2015. Influence of oceanographic structures on foraging strategies: macaroni penguins at Crozet Islands. Movement Ecology. 3:32. doi: 10.1186/s40462-015-0057-2
- Boning CW, Dispert A, Visbeck M, Rintoul SR, Schwarzkopf FU. 2008. The response of the Antarctic circumpolar current to recent climate change. Nature Geoscience. 1:864–869. doi: 10.1038/ngeo362
- Bost CA, Cotte C, Bailleul F, Cherel Y, Charrassin JB, Guinet C, Ainley DG, Weimerskirch H. 2009. The importance of oceanographic fronts to marine birds and mammals of the southern oceans. Journal of Marine Systems. 78:363–376. doi: 10.1016/j.jmarsys.2008.11.022
- Bowman M, Kibblewhite A, Murtagh R, Chiswell S, Sanderson B. 1983. Circulation and mixing in greater cook strait, New-Zealand. Oceanologica Acta. 6:383–391.
- Bradfordgrieve JM, Murdoch RC, Chapman BE. 1993. Composition of macrozooplankton assemblages associated with the formation and decay of pulses within an upwelling plume in greater Cook Strait, New Zealand. New Zealand Journal of Marine and Freshwater Research. 27:1–22. doi: 10.1080/00288330.1993.9516541
- Brothers N, Gales R, Hedd A, Robertson G. 1998. Foraging movements of the shy albatross Diomedea cauta breeding in Australia; implications for interactions with longline fisheries. Ibis. 140:446–457. doi: 10.1111/j.1474-919X.1998.tb04606.x
- Bull L. 2000. Fidelity and breeding success of the blue penguin Eudyptula minor on Matiu-Somes Island, Wellington, New Zealand. New Zealand Journal of Zoology. 27:291–298. doi: 10.1080/03014223.2000.9518237
- Bull MF. 1989. The New Zealand scallop fishery: a brief review of the fishery and its management. Proceedings of the Australasian Scallop Workshop; 1989; Hobart (Australia).
- Calenge C. 2006. The package “adehabitat” for the R software: a tool for the analysis of space and habitat use by animals. Ecological Modelling. 197:516–519. doi: 10.1016/j.ecolmodel.2006.03.017
- Cannell BL, Chambers LE, Wooller RD, Bradley JS. 2012. Poorer breeding by little penguins near Perth, Western Australia is correlated with above average sea surface temperatures and a stronger Leeuwin Current. Marine and Freshwater Research. 63:914–925. doi: 10.1071/MF12139
- CentrePort. 2016. The channel deepening project. Available from: www.centreportbigpicture.co.nz/project-overview
- Chambers LE, Dann P, Cannell B, Woehler EJ. 2014. Climate as a driver of phenological change in southern seabirds. International Journal of Biometeorology. 58:603–612. doi: 10.1007/s00484-013-0711-6
- Charrassin JB, Bost CA, Putz K, Lage L, Dahier T, Zorn T, Le Maho Y. 1998. Foraging strategies of incubating and brooding king penguins Aptenodytes patagonicus. Oecologia. 114:194–201. doi: 10.1007/s004420050436
- Chiaradia A, Forero MG, Hobson KA, Cullen JM. 2010. Changes in diet and trophic position of a top predator 10 years after a mass mortality of a key prey. Ices Journal of Marine Science. 67:1710–1720. doi: 10.1093/icesjms/fsq067
- Chiaradia A, Forero MG, Hobson KA, Swearer SE, Hume F, Renwick L, Dann P. 2012. Diet segregation between two colonies of little penguins Eudyptula minor in southeast Australia. Austral Ecology. 37:610–619. doi: 10.1111/j.1442-9993.2011.02323.x
- Chiaradia A, Nisbet ICT. 2006. Plasticity in parental provisioning and chick growth in little penguins Eudyptula minor in years of high and low breeding success. Ardea. 94:257–270.
- Chiaradia A, Ramírez F, Forero MG, Hobson KA. 2016. Stable isotopes (δ13C, δ15N) combined with conventional dietary approaches reveal plasticity in central-place foraging behavior of little penguins Eudyptula minor. Frontiers in Ecology and Evolution. 3:154. doi: 10.3389/fevo.2015.00154
- Chiaradia A, Roper-Coudert Y, Healy M, Knott N. 2005. Finding the balance: the effect of the position of external devices on little penguins. Polar Bioscience. 18:46–53.
- Chiaradia A, Ropert-Coudert Y, Kato A, Mattern T, Yorke J. 2007. Diving behaviour of little penguins from four colonies across their whole distribution range: bathymetry affecting diving effort and fledging success. Marine Biology. 151:1535–1542. doi: 10.1007/s00227-006-0593-9
- Chilvers B, Morgan K, Finlayson G, Sievwright K. 2015. Diving behaviour of wildlife impacted by an oil spill: a clean-up and rehabilitation success? Marine Pollution Bulletin. 100:128–133. doi: 10.1016/j.marpolbul.2015.09.019
- Collins M, Cullen JM, Dann P. 1999. Seasonal and annual foraging movements of little penguins from Phillip Island, Victoria. Wildlife Research. 26:705–721. doi: 10.1071/WR98003
- Crawford RJM, Underhill LG, Upfold L, Dyer BM. 2007. An altered carrying capacity of the Benguela upwelling ecosystem for African penguins (Spheniscus demersus). Ices Journal of Marine Science. 64:570–576. doi: 10.1093/icesjms/fsm009
- Croll DA, Demer DA, Hewitt RP, Jansen JK, Goebel ME, Tershy BR. 2006. Effects of variability in prey abundance on reproduction and foraging in chinstrap penguins (Pygoscelis antarctica). Journal of Zoology. 269:506–513. doi: 10.1111/j.1469-7998.2006.00090.x
- Cullen JM, Chambers LE, Coutin PC, Dann P. 2009. Predicting onset and success of breeding in little penguins Eudyptula minor from ocean temperatures. Marine Ecology Progress Series. 378:269–278. doi: 10.3354/meps07881
- Dagg M, Benner R, Lohrenz S, Lawrence D. 2004. Transformation of dissolved and particulate materials on continental shelves influenced by large rivers: plume processes. Continental Shelf Research. 24:833–858. doi: 10.1016/j.csr.2004.02.003
- Dann P, Chambers L. 2013. Ecological effects of climate change on little penguins Eudyptula minor and the potential economic impact on tourism. Climate Research. 58:67–79. doi: 10.3354/cr01187
- Dann P, Norman FI, Cullen JM, Neira FJ, Chiaradia A. 2000. Mortality and breeding failure of little penguins, Eudyptula minor, in Victoria, 1995–96, following a widespread mortality of pilchard, Sardinops sagax. Marine and Freshwater Research. 51:355–362. doi: 10.1071/MF99114
- Dehnhard N, Ludynia K, Poisbleau M, Demongin L, Quillfeldt P. 2013. Good days, bad days: wind as a driver of foraging success in a flightless seabird, the southern rockhopper penguin. PLoS ONE. 88:e79487. doi: 10.1371/journal.pone.0079487
- Fahey BD, Coker RJ. 1992. Sediment production from forest roads in Queen Charlotte forest and potential impact on marine water quality, Marlborough Sounds, New Zealand. New Zealand Journal of Marine and Freshwater Research. 26:187–195. doi: 10.1080/00288330.1992.9516514
- Fieberg J, Kochanny CO. 2005. Quantifying home-range overlap: the importance of the utilization distribution. Journal of Wildlife Management. 69:1346–1359. doi: 10.2193/0022-541X(2005)69[1346:QHOTIO]2.0.CO;2
- Flemming SA, van Heezik Y. 2014. Stable isotope analysis as a tool to monitor dietary trends in little penguins Eudyptula minor. Austral Ecology. 39:656–667. doi: 10.1111/aec.12128
- Flemming SA, Lalas C, van Heezik Y. 2013. Little penguin (Eudyptula minor) diet at three breeding colonies in New Zealand. New Zealand Journal of Ecology. 37:199–205.
- Fraser MM, Lalas C. 2004. Seasonal variation in the diet of blue penguins (Eudyptula minor) at Oamaru, New Zealand. Notornis. 51:7–15.
- Gill BJ, Bell BD, Chambers GK, Medway DG, Palma RL, et al. 2010. Checklist of the birds in New Zealand, Norfolk and Macquarie Islands, and the Ross Dependency Antarctica. 4th edition. Wellington: Te Papa Press in association with the Ornithological Society of New Zealand. 512 p.
- Grosser S, Burridge CP, Peucker AJ, Waters JM. 2015. Coalescent modelling suggests recent secondary-contact of cryptic penguin species. PLoS ONE. 10:e0144966. doi:10.1371/journal.pone.0144966 doi: 10.1371/journal.pone.0144966
- Grosser S, Rawlence NJ, Anderson CNK, Smith IWG, Scofield RP, Waters JM. 2016. Invader or resident? Ancient-DNA reveals rapid species turnover in New Zealand little penguins. Proceedings of the Royal Society B: Biological Sciences. 283:20152879. doi: 10.1098/rspb.2015.2879
- Heber S, Wilson KJ, Molles L. 2008. Breeding biology and breeding success of the blue penguin (Eudyptula minor) on the west coast of New Zealand’s South Island. New Zealand Journal of Zoology. 35:63–71. doi: 10.1080/03014220809510103
- Hennicke JC, Culik BM. 2005. Foraging performance and reproductive success of Humboldt penguins in relation to prey availability. Marine Ecology Progress Series. 296:173–181. doi: 10.3354/meps296173
- Hislop JRG, Harris MP, Smith JGM. 1991. Variation in the calorific value and total energy content of the lesser sandeel (Ammoddytes marinus) and other fish preyed on by seabirds. Journal of Zoology. 224:501–517. doi: 10.1111/j.1469-7998.1991.tb06039.x
- Hobson KA, Clark RG. 1992a. Assessing avian diets using stable isotopes I: Turnover of 13 C in tissues. The Condor. 94:181–188. doi: 10.2307/1368807
- Hobson KA, Clark RG. 1992b. Assessing avian diets using stable isotopes II: factors influencing diet-tissue fractionation. The Condor. 94:189–197. doi: 10.2307/1368808
- Hobson KA, Piatt JF, Pitocchelli J. 1994. Using stable isotopes to determine seabird trophic relationships. The Journal of Animal Ecology. 63:786–798. doi: 10.2307/5256
- Hoskins AJ, Dann P, Ropert-Coudert Y, Kato A, Chiaradia A, Costa DP, Arnould JPY. 2008. Foraging behaviour and habitat selection of the little penguin Eudyptula minor during early chick rearing in Bass Strait, Australia. Marine Ecology Progress Series. 366:293–303. doi: 10.3354/meps07507
- Hull CL, Hindell MA, Michael K. 1997. Foraging zones of royal penguins during the breeding season, and their association with oceanographic features. Marine Ecology Progress Series. 153:217–228. doi: 10.3354/meps153217
- Hurst RJ, Ballara SL, MacGibbon D, Triantafillos L. 2012. Fishery characterisation and standardised CPUE analyses for arrow squid (Nototodarus gouldi and N. sloanii), 1989–90 to 2007–08, and potential management approaches for southern fisheries 47. Wellington: Ministry for Primary Industries.
- Inchausti P, Guinet C, Koudil M, Durbec JP, Barbraud C, Weimerskirch H, Cherel Y, Jouventin P. 2003. Inter-annual variability in the breeding performance of seabirds in relation to oceanographic anomalies that affect the Crozet and the Kerguelen sectors of the Southern Ocean. Journal of Avian Biology. 34:170–176. doi: 10.1034/j.1600-048X.2003.03031.x
- Jaeger A, Connan M, Richard P, Cherel Y. 2010. Use of stable isotopes to quantify seasonal changes of trophic niche and levels of population and individual specialisation in seabirds. Marine Ecology Progress Series. 401:269–277. doi: 10.3354/meps08380
- James MR, Wilkinson VH. 1988. Biomass, carbon ingestion and ammonia excretion by zooplankton associated with an upwelling plume in western Cook Strait, New Zealand. New Zealand Journal of Marine and Freshwater Research. 22:249–257. doi: 10.1080/00288330.1988.9516297
- Kaspar H, Gillespie P, Boyer I, MacKenzie A. 1985. Effects of mussel aquaculture on the nitrogen cycle and benthic communities in Kenepuru Sound, Marlborough Sounds, New Zealand. Marine Biology. 85:127–136. doi: 10.1007/BF00397431
- Kokubun N, Lee WY, Kim JH, Takahashi A. 2015. Chinstrap penguin foraging area associated with a seamount in Bransfield Strait, Antarctica. Polar Science. 9:393–400. doi: 10.1016/j.polar.2015.10.001
- Kowalczyk ND, Reina RD, Preston TJ, Chiaradia A. 2015a. Environmental variability drives shifts in the foraging behaviour and reproductive success of an inshore seabird. Oecologia. 178:967–979. doi: 10.1007/s00442-015-3294-6
- Kowalczyk ND, Reina RD, Preston TJ, Chiaradia A. 2015b. Selective foraging within estuarine plume fronts by an inshore resident seabird. Frontiers in Marine Science. 2:42. doi: 10.3389/fmars.2015.00042
- Lalas C, Armer M, Jillett J, Houston DM. 2004. Effects of a warm-water event on diet and breeding of blue penguins at Oamaru, New Zealand. New Zealand Journal of Zoology. 31:116–116.
- Langlais CE, Rintoul SR, Zika JD. 2015. Sensitivity of Antarctic circumpolar current transport and eddy activity to wind patterns in the Southern Ocean. Journal of Physical Oceanography. 45:1051–1067. doi: 10.1175/JPO-D-14-0053.1
- Luque SP. 2007. Diving behaviour analysis in R. R News. 7:8–14.
- Marchant S, Higgins PJ, co-ordinating editors. 1990. Handbook of Australian, New Zealand & Antarctic birds, Volume 1: Ratites to ducks; Part A, Ratites to petrels. Melbourne: Oxford University Press; pp. 125–126, 246–259.
- Matsumoto S, Yamamoto T, Kawabe R, Ohshimo S, Yoda K. 2016. The Changjiang River discharge affects the distribution of foraging seabirds. Marine Ecology Progress Series. 555:273–277. doi: 10.3354/meps11834
- Mattern T, Davis LS, Culik B, Houston DM. 2001. Foraging ranges and breeding success of blue penguins (Eudyptula minor) at two different locations in New Zealand. New Zealand Journal of Zoology. 28:437–438.
- Mattern T, Davis LS, Houston DM, Culik B. 2004. Comparative diving behaviour in blue penguins, Queen Charlotte Sound and North Otago. New Zealand Journal of Zoology. 31:115–115.
- NIWA. 2016. New Zealand regional bathymetry. Available from: https://www.niwa.co.nz/our-science/oceans/bathymetry.
- Numata M, Davis LS, Renner M. 2000. Prolonged foraging trips and egg desertion in little penguins (Eudyptula minor). New Zealand Journal of Zoology. 27:277–289. doi: 10.1080/03014223.2000.9518236
- Numata M, Davis LS, Renner M. 2004. Growth and survival of chicks in relation to nest attendance patterns of little penguins (Eudyptula minor) at Oamaru and Motuara Island, New Zealand. New Zealand Journal of Zoology. 31:263–269. doi: 10.1080/03014223.2004.9518379
- Overeem RL, Peucker AJ, Austin CM, Dann P, Burridge CP. 2008. Contrasting genetic structuring between colonies of the World's smallest penguin, Eudyptula minor (Aves: Spheniscidae). Conservation Genetics. 9:893–905. doi: 10.1007/s10592-007-9414-z
- Parnell A, Jackson A. 2013. SIAR: stable isotope analysis in R. R package version 4.2. Available from: https://CRAN.R-project.org/package=siar.
- Paul LJ, Taylor R, Parkinson DM. 2001. Pilchard (Sardinops neopilchardus) biology and fisheries in New Zealand, and a review of pilchard (Sardinops, Sardina) biology, fisheries, and research in the main world fisheries. Wellington: Ministry of Fisheries.
- Pelletier L, Chiaradia A, Kato A, Ropert-Coudert Y. 2014. Fine-scale spatial age segregation in the limited foraging area of an inshore seabird species, the little penguin. Oecologia. 176:399–408. doi: 10.1007/s00442-014-3018-3
- Perriman L, Houston D, Steen H, Johannesen E. 2000. Climate fluctuation effects on breeding of blue penguins (Eudyptula minor). New Zealand Journal of Zoology. 27:261–267. doi: 10.1080/03014223.2000.9518234
- Peucker AJ, Dann P, Burridge CP. 2009. Range-wide phylogeography of the little penguin (Eudyptula minor): evidence of long-distance dispersal. The Auk. 126:397–408. doi: 10.1525/auk.2009.08055
- QGIS Development Team. 2016. QGIS geopgraphic information system. Open Source Geospatial Foundation Project. http://www.qgis.org/.
- R Core Team. 2016. R: a language and environment for statistical computing. Vienna (Austria): R Foundation for Statistical Computing. Available from: www.R-project.org/
- Renner M, Davis LS. 1999. Short communication: sexing little penguins Eudyptula minor from Cook Strait, New Zealand, using discriminant function analysis. Emu. 99:74–79. doi: 10.1071/MU99009C
- Renner M, Davis LS. 2001. Survival analysis of little penguin Eudyptula minor chicks on Motuara Island, New Zealand. Ibis. 143:369–379. doi: 10.1111/j.1474-919X.2001.tb04938.x
- Ropert-Coudert Y, Kato A, Meyer X, Pellé M, MacIntosh A, Angelier F, Chastel O, Widmann M, Arthur B, Raymond B. 2015. A complete breeding failure in an Adélie penguin colony correlates with unusual and extreme environmental events. Ecography. 38:111–113. doi: 10.1111/ecog.01182
- Schramm W, Lotze HK, Schories D. 1996. Eutrophication and macroalgal blooms in inshore waters of the German Baltic coast: the Schlei Fjord, a case study. In: Rijstenbil, JW, Kamermans P, Nienhuis PH, editors. EUMAC Synthesis rep. Netherlands Institute of Ecology (NIOO-KNAW); p. 17–73.
- Shirtcliffe TGL, Moore MI, Cole AG, Viner AB, Baldwin R, Chapman B. 1990. Dynamics of the Cape Farewell upwelling plume, New Zealand. New Zealand Journal of Marine and Freshwater Research. 24:555–568. doi: 10.1080/00288330.1990.9516446
- Stanton B. 1976. Circulation and hydrology off the west coast of the South Island, New Zealand. New Zealand Journal of Marine and Freshwater Research. 10:445–467. doi: 10.1080/00288330.1976.9515629
- Trans-Tasman Resources. 2016. Offshore iron ore extraction. Available from: http://www.ttrl.co.nz/projects/.
- Uddstrom MJ, Oien NA. 1999. On the use of high-resolution satellite data to describe the spatial and temporal variability of sea surface temperatures in the New Zealand region. Journal of Geophysical Research: Oceans. 104:20729–20751. doi: 10.1029/1999JC900167
- Uozumi Y, Forch E. 1995. Distribution of juvenile arrow squids Nototodarus gouldi and Nototodarus sloanii (Cephalopoda, Oegopsida) in New Zealand waters. Fisheries Science. 61:566–573.
- Van Heezik Y. 1990. Diets of yellow-eyed, Fiordland crested and little blue penguin breeding sympatrically on Codfish Island, New Zealand. New Zealand Journal of Zoology. 17:543–548. doi: 10.1080/03014223.1990.10422952
- Vincent WF, Howard-Williams C, Tildesley P, Butler E. 1991. Distribution and biological properties of oceanic water masses around the South Island, New Zealand. New Zealand Journal of Marine and Freshwater Research. 25:21–42. doi: 10.1080/00288330.1991.9516451
- Wiebkin AS, Page B, Goldworthy S, Ward T, Paton D. 2005. Satellite tracking little penguins in South Australia. New Zealand Journal of Zoology. 32:269–270.
- Wilcock RJ, Nash D, Schmidt J, Larned ST, Rivers MR, Feehan P. 2011. Inputs of nutrients and fecal bacteria to freshwaters from irrigated agriculture: case studies in Australia and New Zealand. Environmental Management. 48:198–211. doi: 10.1007/s00267-011-9644-1
- Wilson RP, Putz K, Peters G, Culik B, Scolaro JA, Charrassin JB, Ropert-Coudert Y. 1997. Long-term attachment of transmitting and recording devices to penguins and other seabirds. Wildlife Society Bulletin. 25:101–106.
- Wilson RP, Scolaro JA, Gremillet D, Kierspel MAM, Laurenti S, Upton J, Gallelli H, Quintana F, Frere E, Muller G, et al. 2005. How do Magellanic penguins cope with variability in their access to prey? Ecological Monographs. 75:379–401. doi: 10.1890/04-1238
- Wood A, Naef-Daenzer B, Prince P, Croxall J. 2000. Quantifying habitat use in satellite-tracked pelagic seabirds: application of kernel estimation to albatross locations. Journal of Avian Biology. 31:278–286. doi: 10.1034/j.1600-048X.2000.310302.x
- Worton BJ. 1989. Kernel methods for estimating the utilization distribution in home-range studies. Ecology. 70:164–168. doi: 10.2307/1938423
- Young D, Foster B. 1986. Faces of the river—New Zealand’s living water. Auckland: Listener.
- Zhang J, O’Reilly KM, Perry GLW, Taylor GA, Dennis TE. 2015. Extending the functionality of behavioural change-point analysis with k-means clustering: a case study with the little penguin (Eudyptula minor). Plos ONE. 10:e0122811.doi:10.1371/journal.pone.0122811