
ABSTRACT
Bennett's (Notamacropus rufogriseus) and dama (N. eugenii) wallabies have been increasing in numbers and distribution in mainland New Zealand. Here, we update their current distributions; estimate current rates of spread to predict their future distributions; and describe the extent of suitable habitat for each species. Current distributions based on breeding populations and probable distributions based on outlier confirmed sightings resulting from natural dispersal and illegal liberations suggest that Bennett's and dama wallabies currently occupy between 5322–15,229 km2 (532,200–1,522,900 ha) and 1865–4126 km2 (186,500–412,600 ha), respectively. In 50 years, best- and worst-case estimates predict that they could occupy as much as 5883–44,226 km2 (588,300–4,422,600 ha) and 1912–40,579 km2 (191,200–4,057,900 ha), respectively. Habitat suitability was predicted to be high in the North and South islands, except for areas of high elevation, intensive agriculture with limited woody vegetative cover and large urban centres. In the absence of widespread intensive control, the ranges currently occupied by Bennett's and dama wallabies are predicted to increase by up to 7- and 20-fold (respectively) in 50 years. As their distributions continue to expand, they will become more difficult to control and their impacts more widespread. We suggest that progressively containing wallabies within increasingly smaller distributions and reducing their numbers to minimise damage within those distributions should be considered the top management priorities. If progressive containment is feasible it could lead to eventual eradication.
Introduction
Introduced wild mammalian herbivores pose a significant threat to native ecosystems and production landscapes in many invaded areas (e.g. Pimental et al. Citation2000; Vázquez Citation2002; van Wieren & Bakker Citation2008; Latham et al. Citation2017). Their feeding and activity habits impact native vegetation, plantation forests, and agricultural and horticultural crops (Leader-Williams Citation1988; Williams et al. Citation1995; Vázquez Citation2002), as well as intensify soil erosion (Bayne et al. Citation2004; Gangoso et al. Citation2006). Their impacts are often most severe on island ecosystems (Courchamp et al. Citation2003) and this is evident in New Zealand where the flora evolved in the absence of mammalian herbivory (Greenwood & Atkinson Citation1977).
Excluding moose (Alces alces), 22 mammalian herbivores have extant wild populations in New Zealand following introductions that occurred mostly during the mid to late 1800s and early 1900s (King Citation2005). Many of these species have been shown to cause significant damage to agriculture and the environment (see Cowan Citation2005; Forsyth & Tustin Citation2005; Norbury & Reddiex Citation2005; Nugent & Fraser Citation2005; Parkes Citation2005; and references therein). Among these are five species of wallabies that have extant wild populations in New Zealand following liberations that occurred in the late 1800s for private collections and sport hunting (King Citation2005). Two species, Bennett's wallaby (Notamacropus rufogriseus) and dama (or tammar as it is commonly called in Australia) wallaby (N. eugenii), have well-established populations in mainland New Zealand (Warburton Citation2005a, Citation2005b) and a further three species occur only on Kawau Island in the Hauraki Gulf, North Island (Warburton Citation1986). One of the species now confined to Kawau Island was eradicated from two islands (Rangitoto and Motutapu) in the Hauraki Gulf in the 1990s (Mowbray Citation2002).
Bennett's and dama wallabies have increased in numbers and distribution since their initial releases, and like some species of macropods (kangaroos and wallabies) in their native Australia (Caughley et al. Citation1987; Di Stefano Citation2004), they have had significant unwanted impacts in some invaded areas. The primary impacts that Bennett's and dama wallabies have in New Zealand are damage to agriculture, seedlings within exotic plantation forests (mostly Pinus radiata) and native vegetation. Bennett's wallaby has been recognised as a pasture pest since the 1940s (Warburton Citation2005b). The plant species that form the bulk of their diet are the same as those grazed by sheep (McLeod Citation1986). Accordingly, if wallabies are allowed to reach moderate-to-high densities (estimated at c. ≥ 2 per ha, or level 3 on the Guilford Scale; an index based on wallaby faecal pellet density and sign and sightings), they may reduce stocking rates of livestock (Warburton Citation2005b; NPCA Citation2015); although this relationship needs to be quantified. Dama wallabies are also primarily grazers, with up to c. 70% of their diet comprising pasture species (Williamson Citation1986). Although they are better adapted to living in forest interior than Bennett's wallabies, forest-dwelling dama wallabies tend to be smaller and have lower kidney fat reserves than individuals with ready access to grassed clearings or pasture (Williamson Citation1986).
Bennett's wallabies browse a number of native plant species (McLeod Citation1986), and can contribute significantly to the depletion of forest understorey and prevent regeneration of palatable species (Warburton Citation2005b). Although dama wallabies prefer edge habitats they are able to live solely within native podocarp/mixed hardwood forests (Williamson Citation1986). In forested habitats with few grassy clearings, the diet of dama wallabies comprises a high percentage of native plants. For example, Williamson (Citation1986) reported that only 3% of the diet of forest interior dama wallabies was composed of grasses, whereas native kāmahi (Weinmannia racemosa) and māhoe (Melicytus ramiflorus) together made up c. 50% of their diet. Knowlton & Panapa (Citation1982) erected three permanent 20 m × 20 m plots in the Lake Okataina Scenic Reserve, North Island. One plot excluded only dama wallaby, one plot excluded red deer (Cervus elaphus) and dama wallaby, and one plot was left open to both mammalian herbivores as a control. Results from these plots showed that browsing of seedlings by dama wallabies prevented the regeneration of the most palatable species and that plant species diversity was 57% higher where dama wallabies were excluded (Knowlton & Panapa Citation1982; Wallace & Wallace Citation1995; Wright Citation2017). Benes (Citation2001) and Wright (Citation2017) concluded that the combined effects of dama wallabies and red deer noticeably altered forest understorey composition and structure, and that the regeneration of the most palatable plant species will require the removal or reduction to low densities of both taxa. At high densities, wallabies can also impact soils and accelerate erosion rates (Warburton et al. Citation1995).
The management of wallabies in New Zealand is the responsibility of affected regional councils (Warburton Citation2005a, Citation2005b) and all affected regions include wallabies in their regional pest management plans (RPMP). These plans have objectives to keep wallabies at low abundances, prevent spread outside of containment areas delineated by councils and eliminate isolated populations outside of containment areas (). Importantly, the responsibility for wallaby control on private land lies with the landowner and regional councils can issue ‘notices of compliance’ to landowners when wallaby numbers on their properties are assessed and found to be too high (e.g. if Bennett's wallaby density is ≥ level 4 on the Guilford Scale; NPCA Citation2015; G. Sullivan, Environment Canterbury, pers. comm., 15 January 2016). The most common methods currently used for reducing wallaby numbers include shooting (primarily from the ground) and poisoning using sodium fluoroacetate (compound 1080) or potassium cyanide in Feratox pellets deployed in bait stations (Choquenot & Warburton Citation2006; Shapiro et al. Citation2011; NPCA Citation2015). If landowners fail to manage wallabies in accordance with RPMP rules they can be subject to legal action under the Biosecurity Act 1993.
Figure 1. Historical and current distribution and confirmed sightings and kills (since 2000) of Bennett's wallabies in South Island and dama wallabies in North Island. The black dots represent the sighting and kill locations used to estimate probable distributions using kernel density estimators (see Methods for details); the white dots (Bennett's wallaby only) represent outlying observations suspected to be illegally-liberated individuals. Containment areas were delineated by regional councils. They were designed to contain all known breeding populations of wallabies and have geographic boundaries, such as large rivers, urban areas and mountains that provide defensible boundaries against range expansion by wallabies. The details associated with confirmed wallaby sightings and kills were provided by regional councils and the New Zealand Department of Conservation.
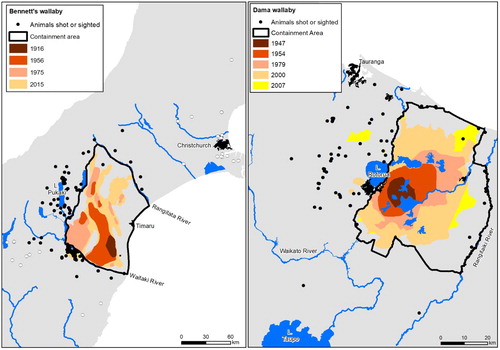
As of 2016, Environment Canterbury's annual budget for Bennett's wallaby management included c. $66,000 for compliance inspections, c. $16,000 for faecal pellet transect monitoring and c. $20,000 for incursion response (G. Sullivan, Environment Canterbury, pers. comm., 15 January 2016). Similarly, Bay of Plenty and Waikato Regional Councils had a joint dama wallaby management programme with a combined annual budget of c. $210,000, plus an additional contribution of c. $10,000 from the New Zealand Department of Conservation (DOC) (G. Corbett, Bay of Plenty Regional Council, pers. comm., 15 January 2016). This expenditure did not include control work paid for by landowners affected by wallabies, for which we do not have estimates. The combined council and agency budget of c. $320,000 per year for control and surveillance of wallabies in mainland New Zealand, and additional landowner expenditure for control, have probably been effective at slowing their rate of spread, but it has failed to prevent them spreading via natural dispersal from their designated containment boundaries (). For example, Bennett's wallabies have used bridges and dams to cross the Waitaki River at the southern edge of their containment area and established a breeding population that straddles southern Canterbury and northern Otago (Warburton et al. Citation2014). Moreover, the number of enforcement notices issued to properties with higher than permissible numbers of Bennett's wallabies has on average increased since 2004 (none prior to 2004; 5.2 enforcement notices from 2004–2017; max. = 16 in 2015), despite comparable effort being put into compliance inspections during that period (B. Glentworth, Environment Canterbury, unpubl. data).
Despite recent range expansions, no primary research has been done on either species of wallaby on mainland New Zealand since the 1980s, and no reviews have been undertaken since 2005 (Warburton Citation2005a, Citation2005b). The objectives of this work were: 1. to update the current distributions of Bennett's wallaby and dama wallaby in mainland New Zealand; 2. estimate current natural rates of spread and use these to predict future distributions over the next 50 years; and 3. describe the extent of suitable habitat for each species in mainland New Zealand.
Methods
Wallaby distributions and rates of spread
Historical and current distributions for Bennett's and dama wallabies have been delineated by affected regional councils (Environment Canterbury, Otago Regional Council, Bay of Plenty Regional Council and Waikato Regional Council) based on qualitative and quantitative surveys conducted by them and DOC. We define these as ‘current distributions’ of known breeding populations of wallabies. However, since the early 2000s regional councils and DOC have collated numerous confirmed sightings and kills of wallabies outside of the current distributions and these records are likely the result of illegal liberations and/or natural dispersal (). As Lindström et al. (Citation2013) point out, including outlying observations of individuals may be particularly important for estimating population rates of spread and predicting future distributions, because these estimates will include individuals dispersing at the invasion front, as opposed to residents located proximally to the front. In this sense, omitting dispersing individuals may underestimate actual rates of spread at the leading edge of the invasion front. Accordingly, we used 265 and 82 outlying sighting/kill locations (all of which were assumed to have originated from natural dispersal) for Bennett's wallaby and dama wallaby, respectively (see , ‘Animals shot or sighted’), to estimate the current ‘probable distribution’. These boundaries were estimated as the 95% isopleth of kernel density estimators (KDE) around the outlying observations plus 200 random points drawn within the current distribution. The 200 points were used to depict the area identified as currently occupied by wallabies and were randomly drawn to avoid biasing the KDE towards specific areas within this distribution. The 2015 boundaries of the current and probable distributions represent best- and worst-case management scenarios, respectively, from which to predict future distributions of wallabies.
We calculated natural rates of spread (m yr−1) for Bennett's wallaby for each of the three time periods for which distributions had been delineated: 1916‒1956, 1956‒1975 and 1975‒2015. Similarly, we used four time periods for which distributions had been delineated for dama wallaby: 1947‒1954, 1954‒1979, 1979‒2000 and 2000‒2007. In addition, we also calculated rates of spread between the latest (pre-2015) council delineated distributions (1975 for Bennett's and 2007 for dama) and the probable distributions constructed using the additional confirmed outlying sightings and kills. Rates of spread for each period were estimated by calculating the straight-line distance between polygon boundaries depicting two consecutive time periods (e.g. 1916‒1956). Because range expansion does not occur at the same rate around the boundary, we sampled the distance between the two polygons every 100 m and then constructed a distribution of annual rates of spread for each period. For this analysis we excluded all established populations that have resulted from known illegal liberations (e.g. Bennett's wallaby population at the northern end of Lake Pukaki; Warburton et al. Citation2014).
We predicted wallaby range expansion under four natural spread scenarios: 1. low rate of spread (1st quartile annual rate of spread) from the current distribution; 2. high rate of spread (3rd quartile) from the current distribution; 3. low rate of spread (1st quartile) from the probable distribution; and 4. high rate of spread (3rd quartile) from the probable distribution (see values highlighted bold in ). We used 1st and 3rd quartiles instead of the mean or median of the distribution of rates of spread because the former was inappropriate given that the data were right-skewed and the latter did not depict the large rates of spread reported from some parts of the invasion front of both species. We used the 2015 polygon boundaries (current or probable) as the starting distribution from which to incrementally model annual spread. To include biological realism to the modelling process, we constructed layers that biased rates of spread in ArcGIS 10.2 (ESRI Citation2015). These included a hard ‘barrier to movement’ layer that completely prevented the extension of wallaby range and included the following features: the South Island main divide (Bennett's wallaby only); major rivers; man-made canals in the Canterbury High Country (Bennett's wallaby only); large lakes; and large towns. However, we allowed spread to occur through this barrier at bridges and dams, i.e. wallabies could extend their range beyond barriers but this was biased towards and slowed by crossing features. In addition to hard barriers, we also included a semi-permeable barrier for mountain ranges (excluding the main divide) ≥ 1500 m above sea level (a.s.l.). This layer allowed wallaby range expansion to occur across these high elevations, but the rate of spread was set at half that of elevations < 1500 m a.s.l. Using this modelling approach, we ran each of the four scenarios previously described for 50 years to estimate Bennett's wallaby and dama wallaby distribution at 5, 10, 20 and 50 years into the future. Range expansion for each wallaby species was modelled separately. Finally, we ran a fifth scenario to estimate the impact of human-assisted spread on the future distribution of Bennett's wallaby. In this case, we included recent confirmed sightings and kills that occurred distally to the area included in the probable distribution assuming they represented illegally-liberated established populations (based on information from regional councils and DOC), and allowed these to expand following the rules described above and using a high rate of spread. We did not conduct a similar analysis for dama wallaby because the worst-case scenario (expansion from the probable distribution at a high rate of spread) resulted in a distribution that already included all extreme outlying observations.
Table 1. Bennett's wallaby and dama wallaby natural rates of spread (m yr−1) in mainland New Zealand for three and four different time periods, respectively. Estimates were derived for the known historical distributions as well as the ‘current’ and ‘probable’ (defined as the 95% kernel density estimator around sightings and kill locations) distributions. Rates of spread for a given period were calculated as the distance between the two distributions, measured every 100 m along the distributional boundary. We estimate best-case (current distribution) and worst-case (probable distribution) rates of spread (see descriptions in Methods). Values used to model wallaby range expansion under four different scenarios are shown in bold: we refer to the 1st quartile as a low rate of spread, whereas the 3rd quartile as a high rate of spread.
Wallaby habitat suitability
The range expansion models described above depict future distributions at a given point in time representing first-order selection (sensu Johnson Citation1980) by wallabies. These models do not describe habitat use within predicted future distributions. To identify suitable habitat for Bennett's and dama wallabies and predict potential distribution in New Zealand, we used Maxent 3.3.3 (Phillips et al. Citation2006). Maxent is a machine learning approach for modelling species distributions from presence-only records. Maxent has been shown to perform as well, or better than, other methods for modelling these kind of data (Elith et al. Citation2006). In addition to presence data, Maxent uses a number of randomly selected points (called ‘pseudo-absences’) that are then combined with biophysical covariates to construct an index of habitat suitability for each cell ranging from 0 (least suitable habitat) to 1 (most suitable habitat). Presence data for Bennett's and dama wallabies were obtained from three sources. First, locations of incidental observations or where animals had been killed outside known wallaby distributions were obtained from regional councils and DOC (). Second, we randomly drew 300 and 267 locations for Bennett's wallaby and dama wallaby, respectively, from within their current distributions to represent occurrence within these areas. Finally, for Bennett's wallaby we also included the locations of 27 pellet transects surveyed since 1993 and a further 11 transects surveyed since 2008, all of which recorded wallaby presence (G. Sullivan and B. Glentworth, Environment Canterbury, unpubl. data). In total, we used 631 and 349 presence-only records for Bennett's wallaby and dama wallaby, respectively. Each wallaby species was modelled separately.
Based on wallaby biology in New Zealand (Warburton Citation2005a, Citation2005b), we identified 14 biophysical variables as potentially important predictors of habitat suitability (). These variables were generated from three different datasets: LENZ (Land Environments of New Zealand, Leathwick et al. Citation2003); LCDB (Land Cover Data Base v4.1, www.lcdb.scinfo.org.nz); and a digital elevation model (DEM) of New Zealand (www.lris.scinfo.org.nz). All these datasets were in raster format except for LCDB, which was converted to a 25 m resolution raster prior to analyses. Biophysical variables were collected within 1 km2 (100 ha) cells; this cell size was chosen as a compromise between estimates of home range size for wallabies in New Zealand (only available for dama wallaby: c. 0.4 km2 [40 ha]; Williamson Citation1986) and a practical unit size for conducting field surveys (Karanth et al. Citation2009).
Table 2. Biophysical variables used to model habitat suitability for Bennett's wallaby and dama wallaby in mainland New Zealand using incidental observations in Maxent. Variables were collected from the source layer within 1 km2 (100 ha) cells. The last two columns show the relative contributions of each biophysical variable included in each model. Models were fitted separately for Bennett's wallaby and dama wallaby. Variables with a high relative contribution to model fit are shown in bold.
We assessed the performance of the Maxent models by determining how well the model discriminated between suitable and unsuitable habitat over a range of thresholds. To do this, we estimated the area under the receiver operating characteristic curve (ROC–AUC), which represents the probability that a randomly chosen presence site will be ranked as more suitable than a randomly chosen pseudo-absence site (Fielding & Bell Citation1997). A model with AUC = 0.5 performs no better than random, a model with an AUC value between 0.7 and 0.8 has acceptable discrimination, and a model with an AUC value > 0.8 has excellent discrimination and indicates that the model has high predictive power (Fielding & Bell Citation1997). An additional measure of performance is the regularised training gain, which describes how much better the Maxent distribution fits the presence data compared to a uniform distribution, where all cells have the same probability and a training gain of 0. The exponential of the training gain is a measure of how many times higher the sample likelihood is compared to a random cell (Yost et al. Citation2008). For example, if the gain is 2, it means that the average sample likelihood is exp(2) ≈ 7.4 times higher than that of a random background pixel.
Results
Wallaby distributions and rates of spread
Chronological distributions for Bennett's wallaby and dama wallaby show significant geographical range expansion since early 1900s, and recent (post-2000) confirmed sightings and kills outside of current containment areas indicate continuing expansion (). The predicted future distributions of Bennett's and dama wallabies are shown in and . Currently, Bennett's and dama wallabies occupy c. 5322 km2 (532,200 ha) and c. 1865 km2 (186,500 ha), respectively. Assuming low natural rates of spread () from the current distributions, future distributions for Bennett's and dama wallabies are predicted to increase by c. 550 km2 (55,000 ha) and c. 50 km2 (5000 ha), respectively, over 50 years (, ; ). This represents an increase of 10% for Bennett's wallaby, but only a trivial increase (2.5%) for dama wallaby. Assuming high rates of spread () from the current distributions, distributions are predicted to increase to c. 9621 km2 (962,100 ha) for Bennett's wallaby and c. 3265 km2 (326,500 ha) for dama wallaby (, ; ).
Figure 2. Predicted distributions of Bennett's wallaby at five time periods using four different estimates of rate of spread and two distributional polygons. A–B, Expand Bennett's wallaby 2015 ‘current distribution’ using either a low (16.5 m yr−1) or a high annual rate of spread (181.7 m yr−1), respectively; C–D, expand Bennett's wallaby 2015 ‘probable distribution’ using either a low (353.5 m yr−1) or a high annual rate of spread (827.8 m yr−1), respectively; E, predicted distribution of Bennett's wallaby including six illegally-liberated outlying populations. The 2015 ‘probable distribution’ was allowed to expand using a high annual rate of spread (827.8 m yr−1).
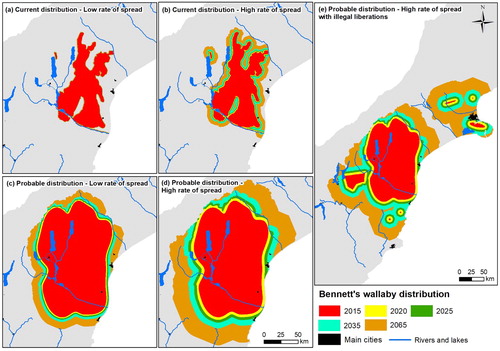
Figure 3. Predicted distributions of dama wallaby at five time periods using four different estimates of rate of spread and two distributional polygons. A–B, Expand dama wallaby 2015 ‘current distribution’ using either a low (3.1 m yr−1) or a high annual rate of spread (92.9 m yr−1), respectively; C–D, expand dama wallaby 2015 ‘probable distribution’ using either a low (592.9 m yr−1) or a high annual rate of spread (1981.3 m yr−1), respectively.
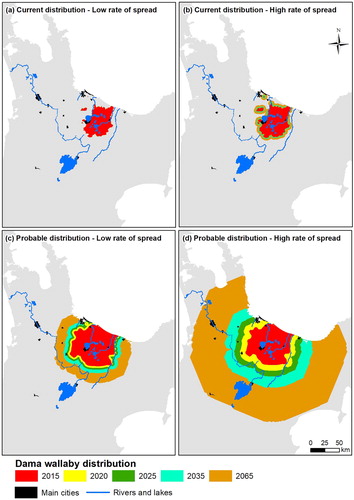
Table 3. Size of predicted distributions (km2) for Bennett's wallaby and dama wallaby in mainland New Zealand. Distributions are predicted at five time periods using four different estimates of rate of spread for each species and two different distributions, ‘current’ and ‘probable’.
The probable distribution of Bennett's wallaby is 14,135 km2 (1,413,500 ha), which is almost three times larger than the current distribution (; ). Assuming a low or a high rate of spread from the probable distribution, Bennett's wallaby range is predicted to increase in 50 years to 20,631 km2 (2,063,100 ha; C) or 28,447 km2 (2,844,700 ha; D), respectively. The probable distribution of dama wallaby is 4126 km2 (412,600 ha), which is more than double the size of the current distribution (; ). Assuming a low or a high rate of spread from the probable distribution, dama wallaby range is predicted to increase in 50 years to 11,070 km2 (1,107,000 ha; C) or 40,579 km2 (4,057,900 ha; D), respectively.
Including illegally-liberated established populations, the probable distribution of Bennett's wallaby is 15,229 km2 (1,522,900 ha; E). Predicting range expansion using these populations as the starting range and a high rate of spread resulted in large range expansions into northern Otago and mid-Canterbury (E; ). The distribution in 50 years under this scenario is predicted to be 44,226 km2 (4,422,600 ha) or 55% larger than under the maximum size predicted under a solely natural spread scenario (28,447 km2 [2,844,700 ha]).
Wallaby habitat suitability
The Maxent model for Bennett's wallaby predicted abundant suitable habitat within most of the eastern parts of the South Island and some suitable habitat in West Coast and Southland regions (A). The primary lower elevation areas from which Bennett's wallabies are predicted to be absent are associated with high production exotic grassland (e.g. dairy farms) and larger urban centres. Similarly, the model predicted low habitat suitability at high elevations in the South Island's mountains, with the caveat that most valleys provide at least moderately suitable habitat for Bennett's wallaby. Three variables (minimum temperature of coldest month, percent pasture in hill and high country, and average slope) had a combined relative contribution of 84% (). The AUC (0.92) and Gain (1.31) values indicated that the Maxent model for Bennett's wallaby performed well.
Figure 4. Predicted habitat suitability derived using Maxent, estimated using incidental observations of wallabies (i.e. presence-only data). A, Bennett's wallaby in South Island; B, dama wallaby in North Island. Bright red and orange colours indicate areas predicted to be excellent to good wallaby habitat (HSI = 1), pale blue indicates moderately suitable habitat and dark blue represents poor habitat (HSI = 0).
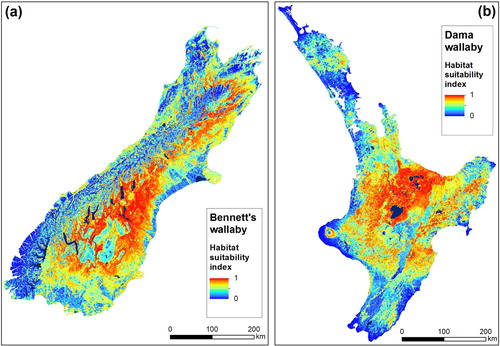
The Maxent model for dama wallaby predicted abundant suitable habitat within most central parts of the North Island (Bay of Plenty, Waikato and Manawatu–Wanganui), much of Hawke's Bay and Gisborne regions, and smaller, but not insignificant parts of Northland, Auckland, Taranaki and Wellington regions (B). High production exotic grassland (e.g. dairy farms) was the primary variable responsible for dama wallaby absence at lower elevations. The model also predicted low habitat suitability at high elevations and around major urban centres. Four variables (minimum temperature of coldest month, average slope, percent forest and average annual temperature) had a combined relative contribution of 85% (). The AUC (0.96) and Gain (1.72) values indicated that the Maxent model for dama wallaby performed well.
Discussion
Empirical estimates of rate of spread associated with the current distributions were highly variable across time periods for both species. Additionally, historical rates of spread were usually far greater than more recent estimates. This could arise from three non-mutually exclusive factors. First, rates of spread could have slowed recently as the wallaby invasion front met unsuitable habitat. Second, control of wallabies, particularly at the invasion front, may have been adequate to halt or minimise dispersal and thus population spread. This seems unlikely (at least) for Bennett's wallaby, because their distribution and numbers have increased since the disbandment of the wallaby control unit in South Canterbury in 1992 (Choquenot & Warburton Citation2006). Third, estimates of rate of spread associated with the current distributions may be representative of movement by individuals that reside on the proximal edge of the core breeding population, rather than of movement by dispersers (that generally occur at low densities) at the invasion front (e.g. Lindström et al. Citation2013). Interestingly, we found that recent rates of spread estimated using the probable distributions were comparable to the earliest historical estimates, suggesting that estimates using the current distributions do not accurately depict dispersal behaviour/movement at the invasion front. Greater rates of spread than those used here have been estimated for brushtail possums (Trichosurus vulpecula) in some areas (e.g. c. 8400 m yr−1 in Northland [Te Kao to Te Paki], 1983–late 1986; Clout & Ericksen Citation2000). Similarly, the estimated rates of spread for several wild ungulate species introduced into New Zealand are either much larger (e.g. 8690 m yr−1, chamois Rupicapra rupicapra) or comparable (e.g. 1770 m yr−1, red deer; 805 m yr−1, fallow deer) (Caughley Citation1963) to the spread values we used. As with possums in New Zealand (Cowan Citation2005), dispersal of wallabies in Australia is strongly biased towards young males attempting to avoid male–male competition (Eldridge & Coulson Citation2015), although the biological drivers of wallaby dispersal in New Zealand remains a knowledge gap.
High variation in estimated rates of spread created difficulty in determining appropriate values with which to predict future distributions. We consider that projections using low rates of spread (1st quartile) from the current distributions are unrealistic, as they do not account for the large number of recent confirmed sightings and kills outside of the current distributions. In the absence of widespread future control they are, at best, optimistically low. It is also unclear whether it is more appropriate to model future wallaby distributions using the current breeding distributions delineated by councils or (what we term) the probable distributions (i.e. including the large number of confirmed sightings and kills that occur outside council delineations). If these outlying locations represent breeding populations, even at low densities, then the use of the higher estimated rates of spread to model future distributions ( or , or ) may provide more realistic projections. New surveillance methodology may help confirm the presence of low density breeding populations outside of containment areas, and thus refine estimates of rates of spread. In the absence of these data, we speculate that future wallaby distributions are likely best represented by or , or or . Although not worst-case scenarios, these represent significant range increases for both species. For example, in 50 years the distribution of Bennett's wallaby is predicted to increase in area by 81%–288% with respect to the currently delineated range. For dama wallaby, the range increase would be between 75%–494%. If existing illegal liberations (assuming they are established breeding populations) are included into the estimate for Bennett's wallaby, then the distribution at 50 years is predicted to increase in area by c. 730%.
Further evidence for potential large increases (under current control levels, which appear insufficient to contain populations) in the distributions of both wallaby species comes from our habitat suitability modelling. Bennett's wallaby has been confirmed south of the Waitaki River (Warburton et al. Citation2014), and the availability of suitable habitat for wallabies invading southwards suggests that their range will increase substantially in the absence of effective control. There is also ample suitable habitat north of the current distribution of Bennett's wallaby, so we would also predict continuing expansion in that direction. The availability of suitable habitat for Bennett's wallabies means that they could occupy most of the South Island if allowed to expand. Similarly, the predicted continued expansion of dama wallabies into Mamaku and Horohoro, and invasion of places like Oropi and Te Urewera, seems reasonable given that forest types around these locations are similar to those already occupied by dama wallabies (Williamson Citation1986). Although the beech and podocarp dominated forests on the upper slopes of Te Urewera may be less suitable, lower altitude forests dominated by kāmahi (Weinmannia racemosa) and māhoe (Melicytus ramiflorus) are likely to be suitable habitat for dama wallabies (Williamson Citation1986). The habitat suitability model for dama wallaby supports these predictions, with this species likely to occupy most of the North Island (except for areas heavily influenced by intensive agriculture) if not contained.
Our rate of spread models predict future distributions of Bennett's and dama wallabies at five different time periods. This is important for management agencies because it incrementally illustrates the extent of each region likely to be impacted by wallabies if they are not sufficiently controlled. However, these models were not designed to assess habitat preferences, occupancy or densities within future predicted distributions. We acknowledge that the future predicted wallaby distributions shown here will probably overestimate the actual area occupied by wallabies. For example, dama wallabies are believed to avoid areas of intensive dairying with inadequate scrub/forest cover and thus those should be subtracted from their predicted range, that is 15% (5983 km2 [598,300 ha] of 40,579 km2 [4,057,900 ha]) of their predicted range in 50 years. Even accounting for this, dama wallaby are still predicted to increase by c. 1750% under a worst-case scenario. It would have been useful to constrain predicted future distributions by estimated habitat suitability to estimate actual area impacted by wallabies at various points in the future. However, we did not do this because of the subjectivity in choosing an appropriate cut-off value to translate habitat suitability into occurrence (Liu et al. Citation2005), and future changes in land use that could alter the availability and extent of suitable wallaby habitat.
We used environmental data surrounding confirmed wallaby locations to estimate suitable habitat for Bennett's and dama wallabies, and extrapolated this information to get an indication of areas that may be affected by wallabies in the future. Because these analyses used environmental data from wallaby presences (i.e. within the areas they currently occupy), they are probably biased towards predicting similar habitats elsewhere in each of the islands as being the most suitable. For areas that have not yet been invaded by wallabies it is more difficult to predict their suitability because of a lack of data. Thus, habitat suitability models should be considered to represent the minimum area likely to be occupied by wallabies in the absence of effective control. Moreover, because wallabies have not reached their equilibrium distribution in New Zealand, predictions from the Maxent model should be taken cautiously (Elith et al. Citation2010). One way of addressing these limitations would have been to fit the suitability models with wallaby presence data from their native Australia and use these models to extrapolate suitability in New Zealand. However, many uninvaded habitat types in New Zealand differ substantially from those in their native ranges, suggesting that such an approach may not be very informative; although some environmental variables, such as variation in rainfall in Tasmania, could be. Nevertheless, both models performed well (based on AUC), and thus we can be confident that areas where wallabies are likely to occur have been highlighted. Wallabies are likely to occur throughout the New Zealand mainland, with the exception of high elevations, urban areas and high production exotic grassland (e.g. dairy farms). It is possible that suitable habitat might have been underestimated in high production exotic grassland because the lack of fine-scale vegetation data meant that refugia (patches of scrub, hedgerows and riparian corridors) within these areas could not be easily identified. However, the spatial and temporal resolution of our analyses should be sufficient to guide wallaby management in both islands.
Populations of Bennett's and dama wallabies currently persist outside of containment areas and these, as well as confirmed new out-of-containment-area sightings and kills, appear to be increasing. Based on moderate empirical estimates of rates of spread, and in the absence of widespread sustained control or containment, the distributions of both species are predicted to increase substantially over the next 50 years, resulting in further impacts on agriculture, native vegetation and, potentially, contributing to soil erosion within newly invaded areas. If allowed to increase in distribution and numbers, they may have additional unwanted impacts through, for example, increased rates of collisions with motor vehicles as occurs in their native Australia (e.g. Bond & Jones Citation2014). The current levels of surveillance and control done by agencies and landowners is likely insufficient to prevent further geographical spread of wallabies. Significantly more funding and a well-coordinated strategy will be needed to achieve this. Effective management of these species will also require surveillance, detection and control methods that are fit for purpose, and these are seen as the highest priorities for the progressive containment of wallabies in New Zealand.
Acknowledgements
We thank personnel from Environment Canterbury, Bay of Plenty, Otago and Waikato regional councils, and the New Zealand Department of Conservation for providing data and valuable discussion. P. Cowan (Manaaki Whenua Landcare Research), E. van Eyndhoven (Ministry for Primary Industries) and two anonymous reviewers provided invaluable comments on earlier versions of the manuscript.
Disclosure statement
No potential conflict of interest was reported by the authors.
Additional information
Funding
References
- Bayne P, Harden R, Davies I. 2004. Feral goats (Capra hircus L.) in the Macleay River gorge system, north-eastern New South Wales, Australia. I. Impacts on soil erosion. Wildlife Research. 31:519–525. doi: 10.1071/WR03039
- Benes M. 2001. The effects of dama wallaby (Macropus eugenii) and red deer (Cervus elaphus) on the native vegetation of the Okataina Scenic Reserve [Unpublished MSc thesis]. Hamilton (NZ): University of Waikato.
- Bond ARF, Jones DN. 2014. Roads and macropods: interactions and implications. Australian Mammalogy. 36:1–14. doi: 10.1071/AM13005
- Caughley C, Shepherd N, Short J. 1987. Kangaroos: their ecology and management in the sheep rangelands of Australia. Cambridge (UK): Cambridge University Press.
- Caughley G. 1963. Dispersal rates of several ungulates introduced into New Zealand. Nature. 200:280–281. doi: 10.1038/200280b0
- Choquenot D, Warburton B. 2006. Modelling the cost-effectiveness of wallaby control in New Zealand. Wildlife Research. 33:77–83. doi: 10.1071/WR05008
- Clout M, Ericksen K. 2000. Anatomy of a disastrous success: the brushtail possum as an invasive species. In: Montague TL, editor. The brushtail possum: biology, impact and management of an introduced marsupial. Lincoln (NZ): Manaaki Whenua Press; p. 1–9.
- Courchamp F, Chapuis J-L, Pascal M. 2003. Mammal invaders on islands: impact, control and control impact. Biological Reviews. 78:347–383. doi: 10.1017/S1464793102006061
- Cowan PE. 2005. Brushtail possum. In: King CM, editor. The handbook of New Zealand mammals. 2nd ed. Melbourne: Oxford University Press; p. 56–80.
- Di Stefano J. 2004. The importance of ecological research for ecosystem management: the case of browsing by swamp wallabies (Wallabia bicolor) in commercially harvested native forests. Ecological Management and Restoration. 5:61–67. doi: 10.1111/j.1442-8903.2004.00170.x
- Eldridge MDB, Coulson GM. 2015. Family Macropodidae (kangaroos and wallabies). In: Wilson DE, Mittermeier RA, editors. Handbook of the mammals of the world. Vol. 5. Monotremes and marsupials. Barcelona: Lynx Edicions; p. 630–735.
- Elith J, Graham C, Anderson R, Dudik M, Ferrier S, Guisan A, Hijmans R, Huettmann F, Leathwick J, Lehmann A, et al. 2006. Novel methods improve prediction of species distributions from occurrence data. Ecography. 29:129–151. doi: 10.1111/j.2006.0906-7590.04596.x
- Elith J, Kearney M, Phillips S. 2010. The art of modelling range-shifting species. Methods in Ecology and Evolution. 1:330–342. doi: 10.1111/j.2041-210X.2010.00036.x
- ESRI. 2015. ArcGIS Desktop: Release 10.2. California: Environmental Systems Research Institute.
- Fielding AH, Bell JF. 1997. A review of methods for the assessment of prediction errors in conservation presence/absence models. Environmental Conservation. 24:38–49. doi: 10.1017/S0376892997000088
- Forsyth DM, Tustin KG. 2005. Himalayan tahr. In: King CM, editor. The handbook of New Zealand mammals. 2nd ed. Melbourne: Oxford University Press; p. 361–373.
- Gangoso L, Donázar JA, Scholz S, Palacios CJ, Hiraldo F. 2006. Contradiction in conservation of island ecosystems: plants, introduced herbivores and avian scavengers in the Canary Islands. Biodiversity and Conservation. 15:2231–2248. doi: 10.1007/s10531-004-7181-4
- Greenwood RM, Atkinson IAE. 1977. Evolution of divaricating plants in New Zealand in relation to moa browsing. Proceedings of the New Zealand Ecological Society. 24:21–33.
- Johnson DH. 1980. The comparison of usage and availability measurements for evaluating resource preference. Ecology. 61:65–71. doi: 10.2307/1937156
- Karanth KK, Nichols JD, Hines JE, Karanth KU, Christensen NL. 2009. Patterns and determinants of mammal species occurrence in India. Journal of Applied Ecology. 46:1189–1200.
- King CM. 2005. The handbook of New Zealand mammals. 2nd ed. Melbourne: Oxford University Press.
- Knowlton JE, Panapa N. 1982. Dama wallaby survey, Okataina Scenic Reserve. Rotorua: New Zealand Forest Service. (Unpublished report).
- Latham ADM, Warburton B, Byrom AE, Pech RP. 2017. The ecology and management of mammal invasions in forests. Biological Invasions. 19:3121–3139. doi: 10.1007/s10530-017-1421-5
- Leader-Williams N. 1988. Reindeer on South Georgia. Cambridge (UK): Cambridge University Press.
- Leathwick J, Wilson G, Rutledge D, Wardle P, Morgan F, Johnston K, McLeod M, Kirkpatrick R. 2003. Land environments of New Zealand. Auckland: David Bateman Ltd.
- Lindström T, Brown GP, Sisson SA, Phillips BL, Shine R. 2013. Rapid shifts in dispersal behavior on an expanding range edge. Proceedings of the National Academy of Sciences. 110:13452–13456. doi: 10.1073/pnas.1303157110
- Liu C, Berry PM, Dawson TP, Pearson RG. 2005. Selecting thresholds of occurrence in the prediction of species distributions. Ecography. 28:385–393. doi: 10.1111/j.0906-7590.2005.03957.x
- McLeod S. 1986. The feeding and behavioural interactions of Bennett’s wallaby (Macropus rufogriseus rufogriseus) with domestic sheep (Ovis aries) in South Canterbury, New Zealand [Unpublished MSc thesis]. Christchurch: University of Canterbury.
- Mowbray SC. 2002. Eradication of introduced Australian marsupials (brushtail possum and brushtailed rock wallaby) from Rangitoto and Motutapu Islands, New Zealand. In: Veitch CR, Clout MN, editors. Turning the tide: the eradication of invasive species. Gland and Cambridge (UK): International Union for Conservation of Nature and Natural Resources Species Survival Commission, Invasive Species Specialist Group, International Union for Conservation of Nature and Natural Resources; p. 226–232.
- Norbury G, Reddiex B. 2005. European rabbit. In: King CM, editor. The handbook of New Zealand mammals. 2nd ed. Melbourne: Oxford University Press; p. 131–150.
- NPCA. 2015. Pest wallabies: control and monitoring of pest dama and Bennett’s wallabies. Wellington: National Pest Control Agencies. http://www.npca.org.nz/images/stories/NPCA/PDF/a9_pest%20wallabies_2015-nov_lr.pdf
- Nugent G, Fraser KW. 2005. Red deer. In: King CM, editor. The handbook of New Zealand mammals. 2nd ed. Melbourne: Oxford University Press; p. 401–420.
- Parkes JP. 2005. Feral goat. In: King CM, editor. The handbook of New Zealand mammals. 2nd ed. Melbourne: Oxford University Press; p. 374–392.
- Phillips SJ, Anderson RP, Schapire RE. 2006. Maximum entropy modeling of species geographic distributions. Ecological Modelling. 190:231–259. doi: 10.1016/j.ecolmodel.2005.03.026
- Pimental D, Lach L, Zuniga R, Morrison D. 2000. Environmental and economic costs of nonindigenous species in the United States. BioScience. 50:53–65. doi: 10.1641/0006-3568(2000)050[0053:EAECON]2.3.CO;2
- Shapiro L, Ross J, Adams P, Keyzer R, Hix S, MacMorran D, Cunningham C, Eason C. 2011. Effectiveness of cyanide pellets for control of dama wallabies (Macropus eugenii). New Zealand Journal of Ecology. 35:287–290.
- van Wieren SE, Bakker JP. 2008. The impact of browsing and grazing herbivores on biodiversity. In: Gordon IJ, Prins HHT, editors. The ecology of browsing and grazing. Berlin: Springer; p. 263–292.
- Vázquez DP. 2002. Multiple effects of introduced mammalian herbivores in a temperate forest. Biological Invasions. 4:175–191. doi: 10.1023/A:1020522923905
- Wallace SW, Wallace G. 1995. The impact of dama wallaby (Macropus eugenii) on forest understoreys in Lake Okataina Scenic Reserve. Rotorua: Department of Conservation. (Unpublished Report).
- Warburton B. 1986. Wallabies in New Zealand: history, current status, research, and management needs. Forest Research Institute Bulletin. 114:1–29.
- Warburton B. 2005a. Dama wallaby. In: King CM, editor. The handbook of New Zealand mammals. 2nd ed. Melbourne: Oxford University Press; p. 32–39.
- Warburton B. 2005b. Bennett’s wallaby. In: King CM, editor. The handbook of New Zealand mammals. 2nd ed. Melbourne: Oxford University Press; p. 39–45.
- Warburton B, Burrows L, Webb T. 1995. Effects of Bennett’s wallaby (Macropus rufogriseus rufogriseus) on vegetation and soil values in South Canterbury. Lincoln: Landcare Research. (Report no. LC9596/53).
- Warburton B, Latham MC, Glentworth B. 2014. Bennett’s wallabies: do they provide any lessons for eradicating invasives? Kararehe Kino. 23:10–11.
- Williams K, Parer I, Coman B, Burley J, Braysher M. 1995. Managing vertebrate pests: rabbits. Canberra: Bureau of Resource Sciences/CSIRO Division of Wildlife and Ecology, Australian Government Publishing Service. p. 284.
- Williamson GM. 1986. The ecology of the dama wallaby (Macropus eugenii, Desmarest) in forests at Rotorua, with special reference to diet [Unpublished MSc thesis]. Palmerston North: Massey University.
- Wright S. 2017. The impact of dama wallaby (Macropus eugenii) and red deer (Cervus elaphus) on forest understorey in the Lake Okataina Scenic Reserve—2017 update. Wellington: Department of Conservation. (Unpublished Report: DOC-3223478).
- Yost AC, Peterson SL, Gregg M, Miller R. 2008. Predictive modelling and mapping of sage grouse (Centrocercus urophasianus) nesting habitat using maximum entropy and a long-term dataset from southern Oregon. Ecological Informatics. 3:375–386. doi: 10.1016/j.ecoinf.2008.08.004