
ABSTRACT
Biodiversity is unevenly distributed worldwide in terms of both species diversity and species endemism. Although centres of endemism are a conservation priority, both patterns and drivers of endemism are poorly understood in New Zealand. Here we explore whether invertebrate species distribution records in New Zealand represent the complete geographic range of species. We use distribution records of 2,322 invertebrate species to survey variation in range size and regional-endemism among 28 New Zealand regions, and explore the correlates of diversity and regional-endemism. Our data suggest patterns of regional-endemism in New Zealand invertebrates are not artefacts of sampling effort and the majority of species are not widespread. We found that endemism-score (which is a measure that corrects for species diversity) correlates positively with the relative size of the region three million years ago. Five variables (and their interactions) contributed to the relative level of invertebrate species endemism within a region (in a generalised linear model). Level of endemism tends to be lower in regions with greater geographic connectivity. This suggests that high levels of regional-endemism are not simply the product of the accumulation of species over time, but depends on the ability of a region to retain local species.
Introduction
Diversity is unevenly distributed around the globe (Wallace Citation1876) with more variation in life existing at the tropics than in temperate regions (latitudinal biodiversity gradient; Dowle et al. Citation2013). Nevertheless, temperate New Zealand has a high proportion of species that are found here and nowhere else, thus it has high species endemism and is considered a ‘biodiversity hotspot’ (Myers et al. Citation2000). Island Biogeography theory (MacArthur and Wilson Citation1967) might help explain the biodiversity in New Zealand, founded as it is on the principle that the number of species on an island is determined by an equilibrium between the rate of arrival of new species and the extinction of existing species. Distance from sources of colonists and island area are considered the main determinants. As an archipelago that is relatively large and distant from other landmasses (Neall and Trewick Citation2008), the Island Biogeography model predicts both low arrival rate and low extinction rate for New Zealand. As species can only be viewed as endemic if they occur nowhere else both extinction of source populations and in situ speciation have a role in development of New Zealand’s highly endemic biota.
The same factors may influence species diversity at finer scale and can be revealed by recording regional variation in diversity within a land mass such as New Zealand (e.g. Heenan et al. Citation2017). Here we consider in particular regional endemism with a species regarded as a regional-endemic if it is restricted to an a priori area within the landscape. Thus, the term ‘regional-endemism’ is scale dependent. Our present focus on New Zealand invertebrates utilises published data where the ‘regions’ are already defined (see methods). The number of species recorded within a region and the number of these species that are restricted to it can be compared to similar sized regions to better understand the distribution of biodiversity across the landscape. The more species that exist in a region, the greater the chance some will be endemic (Jetz et al. Citation2004), although diversity and endemism indices are not always congruent (Daru et al. Citation2014). Total diversity and endemicity of a geographic region are expected to be controlled by the interplay of (1) area, (2) physical connectivity, (3) ecological diversity, and (4) habitat/climatic stability.
Land area available can affect levels of terrestrial endemism due to its influence on population size, extinction rates and speciation rates (MacArthur and Wilson Citation1967; Foote et al. Citation2007; Crampton et al. Citation2010; Kisel and Barraclough Citation2010), the latter being higher for lineages associated with more persistent habitats (Ribera et al. Citation2001; Papadopoulou et al. Citation2009). Therefore, endemism is expected to be relatively high in regions that have had more land available for longer. Species longevity varies considerably, with marine molluscs shown to have average durations of about nine million years (Foote et al. Citation2007), while mammal species may have average durations of only one million years (Martin Citation1993). These timespans are compatible with genetic analyses suggesting geologically recent, rather than ancient processes have determined the distribution of invertebrate species in New Zealand (e.g. McGlone et al. Citation2001; Trewick and Wallis Citation2001; Trewick et al. Citation2011; Goldberg et al. Citation2014).
Physical connection of regions is expected to influence relative levels of regional-endemism as barriers to dispersal might restrict species to a single region. Although time frames associated with shifts in species ranges are not well understood, range expansion is probably more rapid than speciation, so it might be expected to have a substantial short-term influence on regional diversity (Anderson Citation1994). Species ranges may not be in equilibrium and rather than being fixed, range change may be part of the life-cycle of a species (Webb and Gaston Citation2003). Analyses using well-sampled fossils of extinct marine invertebrates indicate a trend of range expansion and population increase peaking at either early or mid-duration of the species lifetime before decline to extinction (Foote et al. Citation2007). Similarly, within the regional-endemic species of New Caledonian Agnotecous crickets, range size was correlated with species lineage age (Nattier et al. Citation2012). Therefore, it is possible that regional-endemism is transitional and a precursor of expansion to inhabit adjacent regions. In contrast, computer simulations suggest small-ranged species are not transient but have similar durations to species with larger ranges (Birand et al. Citation2012).
Climate and habitat type influence endemism and species diversity in many ways. Slope, for example, may impact speciation rates because topographic heterogeneity results in habitat variation (Veech and Crist Citation2007) and more complex communities (Wollenberg et al. Citation2008), that may yield differential selection and high rates of speciation relative to extinction (species pump model, Moritz et al. Citation2000; Rahbek and Graves Citation2001). A complex environment with many biotic interactions might result in more species in the same geographic space compared to a simple community with few competitive interactions (species packing; MacArthur Citation1969). In Africa, endemism is concentrated in mountainous regions with low seasonality (Fjeldsaå et al. Citation1997; Jetz et al. Citation2004).
Climatic/habitat stability is likely to suppress rates of extinction (Wallace Citation1876; Dowle et al. Citation2013). In some places the distribution of plants and animals appears to have been influenced by glaciation and aridification during Pleistocene glacial periods. For example, a gradient of European endemism suggests refugia in warmer climes were influential in preserving local diversity (Essl et al. Citation2013).
Regional-endemism in New Zealand
Endemism appears to be unevenly graded across the New Zealand landscape (Wardle Citation1963; Rogers and Walker Citation2005; Millar et al. Citation2017) with three approximately coincidental regions of relatively high endemisms among vascular plants and insects (; Wardle Citation1963; Trewick et al. Citation2011). It is also notable that some taxa have disjunct distributions in regions of high endemism and absence between (Trewick and Wallis Citation2001; Wallis and Trewick Citation2009; Wallis et al. Citation2016) which probably reflects recent extirpation. Protracted disjunction could lead to regional-endemism because of continued evolutionary divergence or extinction from all but one of the occupied areas.
Figure 1. Differences in levels of species endemism among five zones of North Island and South Island New Zealand. (A) Approximate numbers (left) of c.355 endemic vascular plants and their approximate proportions (right) in different sections of the landscape (northern and southern North Island, and northern, central and southern South Island demarked by pink dashed lines) as reported by Wardle (Citation1963). (B) Invertebrate endemism in relation to the same regional zones expressed as the proportion of species in a zone that are endemic to that zone (left; 1724 species in total), and proportion of all the species endemic to only one zone that are endemic to each (right; 596 species; Trewick et al. Citation2011). (C) The northern North Island zone (NNI) is rich in both endemic plants (green) and invertebrates (yellow), although the northern South Island (NSI) has the most endemic plant species (Wardle Citation1963).
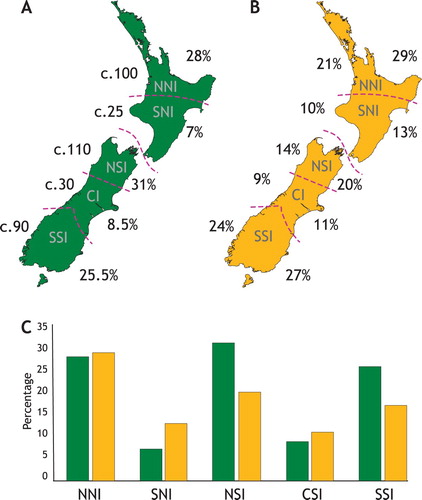
During New Zealand’s last glacial maximum (LGM; Williams et al. Citation2015), glaciers were restricted to mountainous parts of South Island and the most extensive forests were in northern North Island (McGlone et al. Citation2010). Many other regions that could have been LGM refugia for forests and their fauna are now under the ocean along with much palynological evidence. In particular the near coast areas most likely to have supported forest during the LGM are now submerged (Trewick and Bland Citation2012). Because species with high-density populations can persist in small areas, LGM refugia for invertebrates may have existed anywhere that glaciers did not. Open forest, scrub and grassland may all have supported insect diversity and may have been widespread (Shepherd et al. Citation2007; Morgan-Richards et al. Citation2017). A mosaic landscape with cryptic refugia may explain why many New Zealand invertebrates have phylogeographic structure suggesting persistence through Pleistocene glaciations (e.g. Trewick et al. Citation2000, Citation2011).
Explanations for regional-endemism in New Zealand have included all four of the processes evoked elsewhere: (1) land area – extinction in the southern North island due to Pliocene marine transgression (Heenan et al. Citation2017), (2) physical connections with other regions – range displacement (Heads Citation1997 but see Trewick and Wallis Citation2001), (3) ecological diversity – speciation in the young southern mountains (Heenan et al. Citation2017), (4) habitat stability or longevity – Pleistocene glacial refugia (Wardle Citation1963; McGlone et al. Citation2001), speciation driven by glaciation (Wallis et al. Citation2016), and lack of habitat before the Pleistocene (Rogers Citation1989; Trewick and Bland Citation2012). It has also been suggested that the spatial coverage of New Zealand’s natural history collection records might create artificial patterns of species diversity (Ward Citation2012). Biased sampling effort and taxonomically incomplete collections can create artefacts in perceived distributional patterns (Ahrends et al. Citation2011; Ward Citation2012).
Here we examine whether current invertebrate distribution records are representative of the full range of species or limited by sampling. We sought to distinguish sampling effort from true regional-endemism by comparing patterns of endemism among well-sampled taxa, where both presence and absence are recorded, with patterns in a larger taxon dataset. We investigate potential drivers of New Zealand’s invertebrate regional-endemism by seeking correlations with environmental variables to infer the combination of environmental variables most associated with regional-endemism patterns. If the dominant influence on relative levels of regional-endemism in New Zealand is:
the equilibrium between origin (arrival and speciation) and extinction we expect a positive correlation between land area and regional endemicity (measured by both the current and past size of the region).
the ability of species to expand or shift their ranges we expect to see a correlation between land connectivity and regional endemicity.
species-packing and ecological speciation we expect to see a positive correlation between regional diversity of topology and climate and regional endemicity.
Regional bias in extinction rates linked to environmental stability (e.g. climatic change and the extent of glaciers) is likely to be involved in determining relative levels of regional-endemism (4: habitat stability/longevity), but the size and heterogeneity of the 28 recognised regions considered in in our analyses preclude a test for this effect.
Material and methods
Invertebrate diversity
The Fauna of New Zealand series (FNZ; 1982–2012) provide the distribution and characteristics of well-studied invertebrate groups (). Location data are linked to each of 28 recognised geographic regions (Crosby regions or NZ entomological areas) averaging 9492 km² and defined primarily by natural landscape features including ridge lines and rivers (Crosby et al. Citation1976, Citation1998; A, ). The presence/absence of species within each region is documented in the FNZ on the basis of confirmed records verified by expert systematists, and this provides a rich and reliable dataset for investigating regional-endemism. High resolution geographic information system (GIS) data are available only for a subset of species so mapping to a particular spatial grid would result in most taxa being excluded from analysis. For the purposes of analysing patterns of endemism in North Island and South Island New Zealand we included only native invertebrates that are found on one or both of these islands and excluding all species restricted in distribution to smaller islands within New Zealand’s economic/political zone.
Figure 2. (A) Twenty-eight entomological regions of New Zealand used to investigate regional-endemism. Area codes and boundaries used to categorise specimen locality data are shown (after Crosby et al. Citation1976). For full names of regions see . (B) New Zealand land area 3 million years ago (Ma; Trewick & Bland Citation2012). Light grey represents areas of low-lying land and marginal-marine deposition. (C) Approximate land area 3 Ma for each of the 28 geographic regions used for recording specimen localities. Three regions had no change in size (OL, MK, CO). (D) New Zealand regional-endemism score calculated from 2322 species was significantly correlated with land area 3 Ma (R² = 0.34; P = 0.001). Endemism score was the mean endemism among all species occurring in the region, calculated as the inverse of the mean geographic distance between the regions in which it occurred.
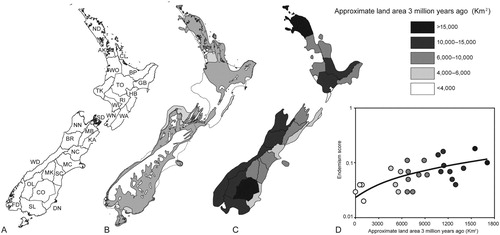
Table 1. Invertebrates used to study regional-endemism in New Zealand. FNZ = Fauna of New Zealand series published by Landcare Research (*or other reference).
We collated data on a total of 2,322 species encompassing representatives of 12 invertebrate orders and the superorder Acari (). These data derived from 63 FNZ volumes with information on New Zealand Formicidae (ants) included from Don (Citation2007). With these records we were able to generate measures of regional species diversity defined as the number of different species recorded in a region. Regional-endemics are species restricted to a region within a larger landmass, and here, due to the nature of the data, we defined regional-endemics by their occurrence in one of the 28 Crosby geographic regions. Thus endemism of a region is the number of species recorded in that region and nowhere else. Following the approach of Taberlet et al. (Citation2012), an endemism score for each species was expressed as the inverse of the mean geographic distance between the centroids of each region in which it occurred. Species present in one region received a score of one. The endemism score for each region was calculated as the mean endemism among all species occurring in the region. Endemism score therefore accounts for variation in overall species diversity among regions. We tested for spatial autocorrelation of endemism and diversity indices using the Moran’s Index statistic (Moran Citation1950).
We examined whether regional-endemic species were distributed evenly among regions using a chi-square test, with expected values calculated as the total number of endemic species in the analysis divided equally among the number of regions (n = 28; ). The observed values were the numbers of endemic species recorded for each region. We repeated this test to take into account the effect of differences in area of each region on the expected number of endemic taxa by calculating the proportion of New Zealand surface area represented by each region and multiplying by the total number of endemic species.
Table 2. Three datasets used in the analysis of regional-endemism in New Zealand comprised two well-sampled families (Simuliidae blackflies known as sandflies in NZ and Lycosidae wolf spiders) and a set of data for 2322 invertebrate taxa found on North and South Islands.
Sampling effort
To test whether high levels of putatively endemic species in some regions resulted from low overall and thus potentially stochastic sampling effort, we excluded all taxa recorded of only one site within a region unless the overall sampling of the relevant genus or family was sufficient to provide evidence of nearby absence. We defined sites as sampling locations ≥5 km apart. This reduced the number of regional-endemic taxa within the conservative dataset from 734 to 152. The relationship between initial estimates of regional-endemism within each region and the number of well-sampled regional-endemics was then investigated. To further explore whether regional variation in endemism was evident when site sampling was abundant, we used two densely-sampled datasets for Simuliidae black flies (Insecta: Diptera; Craig et al. Citation2012) and Lycosidae wolf spiders (Arachnida: Araneae; Vink Citation2002).
Comparison of endemism with geography/environment
To investigate potential causes of variation in regional diversity and endemism we looked for relationships with geophysical and environmental parameters that might affect speciation or extinction rates, or promote sampling bias.
The well-recognised global relationship between latitude and biodiversity (Dowle et al. Citation2013) suggests that latitude might be a proxy for diversity traits in New Zealand, given that the two main islands extend over more than twelve degrees of latitude. Region latitude was taken as the mean of the latitudinal limits of each geographic region. The current land area of each region was calculated in ArcMap from ArcGIS 10.1 (ESRI, CA) using geographic regions (LENZ layer ‘NZ Area Codes for recording specimen localities’). We also investigated the influence of inferred land area 3 million years ago (Ma). This time-frame coincides with the age of the most recent common ancestor for many New Zealand taxa, as determined by patterns of genetic diversity (e.g. McGlone et al. Citation2001; Trewick et al. Citation2011). Approximate land area 3 Ma (C) was estimated for each region excluding low-lying land and marginal-marine deposition (B) (Trewick and Bland Citation2012). As a proxy for the extent of connectivity/isolation of each region we used the number of neighbouring regions currently sharing a boundary. For each region, measures of slope and elevation were included as proxies for habitat heterogeneity. Mean annual temperature and mean annual solar radiation were included because these variables might conceivably influence underlying mutation rates and speciation rate (Dowle et al. Citation2013). Mean monthly water balance ratio (MMWBR; the average of the monthly ratios of rainfall to potential evaporation) was used as a measure of water availability since aridity may have effects on patterns of regional-endemism, as observed for Madagascan fauna (Wilmé et al. Citation2006). This information was derived from the Ministry for the Environment data service website. The mean and variance of each region for each variable was calculated in ArcMap from ArcGIS 10.1 (ESRI, CA) using geographic regions (LENZ layer ‘NZ Area Codes for recording specimen localities’). As a measure of habitat availability, we included prehuman forest cover, calculated from McGlone (Citation1989) and an estimate of current forest cover in each region (as a measure of the recent impact of human arrival). We used the relative human population size of each region and the presence of a relevant research institution in the region (a binary variable) as a proxy for sampling bias, because there might be a tendency for more thorough description of local versus more distant fauna. The relative population size of each region was calculated based on 2006 census data using the ‘populated places’ polygon (by Peter Scott, from Koordinates.com).
We looked for correlations of diversity and endemism (both number of endemic taxa and endemism score) with these environmental variables. We then developed a regression model to test which environmental variables and their interactions best explained the number of endemic taxa sampled from each region. Since ‘endemic taxa’ is count data, with some small values, we modelled it using a generalised linear model (GLM) with a quasi-Poisson distribution correcting for overdispersion using R v3.1.3 (R Development Core Team Citation2010). Many environmental variables were significantly correlated with one another (see Table S2). Where several environmental variables were found to be strongly correlated, some were excluded by systematically substituting correlated variables for one another in separate iterations of the model. Variables were removed by a stepwise search for the optimal model judged by the F tests and by examination of diagnostic plots.
Results
Regional-endemism in New Zealand was investigated using the presence or absence of 2,322 invertebrate species in 28 regions. Species diversity varied among New Zealand regions (, ) and was positively correlated with endemism (R² = 0.73; P < 0.001) (A). The Nelson region (NN) had the highest invertebrate species diversity (763) and South Canterbury (SC) the lowest (140) and none of these were regional-endemics (). Less than 11% of species were found in ten or more regions. Most species (84%) were found in seven or fewer regions and 734 out of 2,322 species (32%) were regional-endemics, restricted to a single region (). These regional-endemic species were unevenly distributed among regions (χ² = 809.28; d.f = 27; P < 0.0001), even after correction for differences in area (χ² = 772.74; d.f. = 27; P < 0.0001). Northland (ND) had the most endemic species within our sample (108) followed by Nelson (101) (; ). Together these two regions accounted for 28.5% of all of the regional-endemic taxa, but only 8.8% of the total land area of mainland New Zealand. In contrast, Hawke’s Bay (HB), Gisborne (GB), Wanganui (WI), Rangitikei (RI), Wairarapa (WA), Kaikoura (KA), north Canterbury (NC) and south Canterbury (SC) accounted for 23% of total land area but only 5% of all endemic taxa. No spatial autocorrelation was detected within the endemism and diversity indices (P > 0.05).
Figure 3. Endemism and diversity levels of invertebrate species are not homogeneous among regions of New Zealand. Four colours represent discretized (binned) numbers per region out of a sample of 2322 taxa. (A) Total invertebrate diversity. (B) Number of endemic invertebrates. (C) Endemism score using the average level of endemism for each taxon. Bar plots illustrate ranked regional total diversity (D) and ranked regional total number of endemic taxa (E).
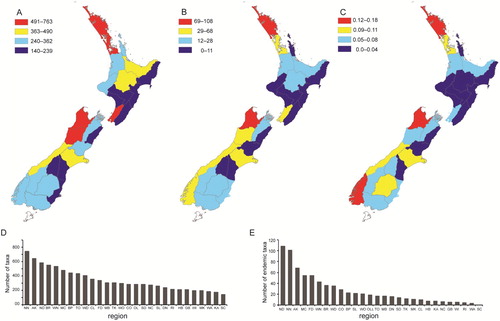
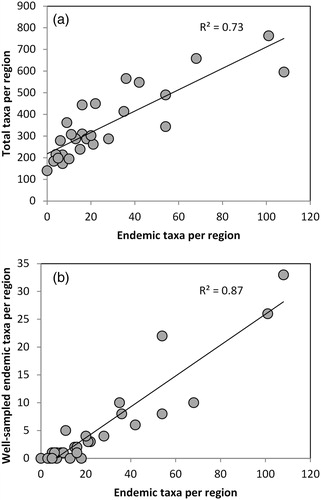
Figure 4. (A) Regional-endemism and diversity are correlated in a sample of 2322 New Zealand invertebrates, 734 of which are Regional-endemics. (B) Well-sampled endemic taxa (n = 152) was strongly correlated with endemic taxa. Data visualisation was aided with Daniel’s XL toolbox addin for Excel, version 6.52, by Daniel Kraus, Würzburg, Germany (available at: http://xltoolbox.sourceforge.net).
Sampling effort
To explore whether the data were dominated by sampling effort we excluded taxa recorded from only one site and that had poor overall sampling of the group. This reduced the number of regional-endemic taxa from 734 to 152 species. The strong relationship between the number of endemic taxa in each region and the number of well-sampled endemic taxa (R² = 0.87; P ≤ 0.001; B), suggests that overall sampling is representative of actual levels of endemism within regions.
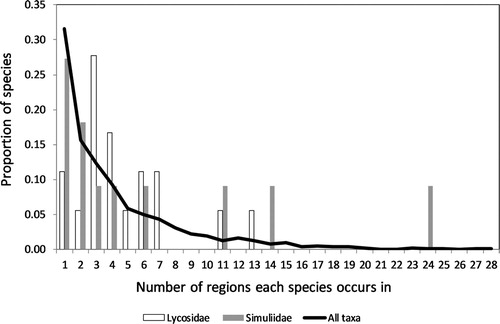
We explored further the influence of variation in sampling effort using patterns of endemism in two intensely sampled families; Simuliidae flies and Lycosidae spiders (). Within each region, every collection site provided independent presence/absence records for each of the 11 Simuliidae and 18 Lycosidae species endemic to North Island and/or South Island New Zealand. In both families, most species were recorded from few regions while few species were widespread, in keeping with the predominant pattern of range restriction seen in the larger invertebrate dataset (). Although intensely sampled, neither the Simuliidae nor Lycosidae comprise sufficient species diversity to test for significant heterogeneity among regions.
Figure 5. In a sample of 2322 New Zealand invertebrate species, most were reported from only few regions compared to a small number of widespread species. The well-sampled spider (Lycosidae, 18 species) and sand fly (Simuliidae, 11 species) datasets showed a similar pattern with most species found in few regions.
Endemism and environment
The relationship between endemism and the environment was tested using a set of environmental variables (Table S1). There were no simple correlations between endemism or diversity and the environmental variables, however, a significant positive correlation (after Bonferroni correction) was observed between endemism-score (which is a measure that corrects for species diversity) and land area 3 million years ago (R² = 0.34; P = 0.001; D). Variation in levels of regional-endemism among the regions was best explained by multiple variables in the general linear model (). Total species diversity (t = 6.20; P = 0.00001), land area 3 Ma (t = 7.45; P < 0.00001) and the presence of a research institution (t = 7.32; P < 0.00001) each improved the model, having a significant positive impact on regional-endemism. Climatic variables (represented in this model by the ratio of rainfall to evaporation and seasonal sunshine variation) also contributed to regional-endemicity, and each correlated with other environmental variables not in the model ( and S2). Interestingly, variance in solar radiation and water availability (MMWBR) interacted to have a significant negative effect (t = −3.49; P = 0.003). The effect of total species diversity and number of neighbouring regions interacted with one another to negatively affect regional-endemism (t = −3.11; P = 0.007). Two other variables included in the model, mean slope and current forest cover, did not have a significant effect (t < 1.25; P > 0.05).
Table 3. Generalised linear model to explain variation in the number of endemic invertebrate species within 28 regions of New Zealand.
Discussion
The patterns
The same pattern of regional variation was apparent in our dataset of endemic invertebrates and a subset of more intensely-sampled endemic species. Two intensely-sampled families of New Zealand invertebrates, Lycosidae spiders and Simuliidae black flies, provided information on absences and were not biased by sampling effort. Within these families, species distributions were heterogeneous with few widespread and many restricted species, as seen in the larger invertebrate dataset (). We are confident that the distributions of invertebrate species, as recorded in the Fauna of New Zealand series, do contribute meaningful data for analysing patterns of New Zealand regional-endemism.
As observed in plants (Wardle Citation1963; McGlone et al. Citation2001; Heenan et al. Citation2017), levels of invertebrate endemism are not homogeneous among New Zealand regions. Rather, some regions have high endemism while others had few or no endemic invertebrate taxa in our sample (). Our generalised linear model (GLM) indicated that sampling activity, represented by the presence of a research institute, did explain some variation in relative regional-endemism, but other variables were also significant and there was no evidence for a relationship between human population size and endemism. Research centres were more likely to have poorly-sampled endemic species, for example, only 15% of endemic taxa from Auckland and mid Canterbury (regions with research centres) were well-sampled compared with 41% in Fiordland and 31% in Northland (regions without relevant institutions). These poorly sampled taxa might be due to species being described in the nineteenth Century based on one or few specimens/sample sites. This result is unexpected and contrasts with analyses of Hymenoptera records from New Zealand which were skewed to high sampling in the Auckland region (Ward Citation2012).
Space – speciation or extinction?
We found that of all the environmental variables tested, only land area 3 Ma was significantly positively correlated with endemism score. Because endemism score accounts for variation in overall species diversity among regions, this correlation suggests a role for retaining species (low extinction rate) rather than simply species generation (arrival and speciation). Land area 3 Ma also had a significant positive impact on regional-endemism levels in our model (GLM), with no significant interactions detected. In contrast, current land area was not correlated with endemism and did not improve the GLM, suggesting that the amount of land available in the recent past has had a greater effect on endemism levels than current land area. The most notable effector of the relationship between land area 3 Ma and endemism was the lack of land in southern North Island which was still submerged until about 1.5 Ma (Trewick and Bland Citation2012), and where there are relatively few endemic species (Goldberg et al. Citation2014). This feature was previously identified as a driver of plant patterns (Rogers Citation1989; Heenan et al. Citation2017). Thus, a combination of past speciation and extinction rates controlled by area availability is likely to be a key interaction determining relative regional-endemism levels in New Zealand.
Range expansion
The more species that exist in a region, the greater the chance that some will be endemic (Jetz et al. Citation2004). We predicted that if the ability of species to expand or shift their ranges is of greatest importance in determining relative levels of regional-endemism we would see a correlation between land connectivity and regional endemicity. We found that invertebrate species diversity was positively correlated with endemism in New Zealand (A). However, species diversity interacted with number of connecting (neighbouring) regions to lower the total number of endemic species. Levels of diversity and endemism were affected differently by range expansion; expansion into new regions decreases endemism but can increase diversity within a region. In our GLM, number of neighbouring regions interacted negatively with species diversity influencing endemism within a region. This reflects the opportunity for terrestrial species to migrate into adjacent regions with land connection and so reduce regional-endemism.
The number of neighbouring regions is an estimate of current connectivity but it does not take into account past connectivity. Although the Nelson region (NN) currently has high numbers of endemic taxa and few neighbours, during the last glacial maximum (LGM) there was land connection between this South Island region and Wanganui/Taranaki in North Island (McGlone et al. Citation2010; Trewick et al. Citation2017). Large differences in diversity and endemism among historically neighbouring regions may be explained by demographic processes, such as competitive exclusion (e.g. Waters et al. Citation2013; Bulgarella et al. Citation2014). Range expansion also requires ecological compatibility, so although, for example, the West Coast has many neighbours, the steep environmental gradient across the Southern Alps is likely to limit the ranges of species. In other words, the region boundary is also an ecological barrier in some cases.
Species packing
Climate and habitat could influence endemism and species diversity in many ways. We predicted that if species-packing and ecological speciation are of importance in determining relative levels of regional-endemism we would detect a positive correlation between regional diversity of topology and climate and regional endemicity. Our GLM included significant climate variables, with strong seasonality of sunshine and high rainfall to evaporation ratio increasing endemicity. However, we found that water availability (MMWBR) interacted with variance in solar radiation to give a negative impact on endemism. Environmental variables tend to be correlated with one another and in our dataset we found that solar radiation variance was negatively correlated with prehuman forest cover while water availability was positively correlated with current forest cover and slope (Table S2). Slope, for example, may impact speciation rates because topographic variation results in a greater variety of habitats (Veech and Crist Citation2007) and more complex communities (Wollenberg et al. Citation2008), and may thus result in differential selective pressures and high rates of speciation relative to extinction (species pump model; Moritz et al. Citation2000; Rahbek and Graves Citation2001). Although endemism can be high in mountainous regions with low seasonality (Fjeldsaå et al. Citation1997; Jetz et al. Citation2004), in New Zealand, mountainous areas were impacted by glaciation during the last glacial maximum that probably resulted in local extinctions (Trewick et al. Citation2000). However, high levels of neo-endemism in South Island plants (Heenan et al. Citation2017) and animals (Wallis et al. Citation2016) presumably reflects recent alpine speciation. The effects of climatic factors are complex and the mechanism by which these variables have a significant effect on invertebrate endemism levels is not currently understood. Although patterns may be driven by climatic variation during the Pleistocene, processes such as ecological interactions are likely to play a role in the maintenance of patterns (e.g. Bulgarella et al. Citation2014; Sivyer et al. Citation2018). Although we have evidence that climate and habitat may influence relative levels of invertebrate species endemicity the correlation of variables and heterogeneity of regions makes isolation of the relevant drivers difficult.
Climatic and habitat stability
The distribution of plants and animals appears to have been influenced in some places by glaciation and aridification during Pleistocene glacial periods. For example, a gradient in levels of European endemism suggests refugia in warmer climes were influential in preserving local diversity (Essl et al. Citation2013). During New Zealand’s LGM (Williams et al. Citation2015), glaciers were restricted to mountainous parts of South Island while the most extensive forests were in northern North Island (McGlone et al. Citation2010). However, latitude did not improve our model of New Zealand regional endemism of invertebrates. Coastal areas that could have been LGM refugia for forests are now under the ocean (Trewick and Bland Citation2012). Because high-density populations can persist in small areas, a mosaic landscape with cryptic refugia may explain why many New Zealand taxa have phylogeographic structure suggesting persistence through Pleistocene glaciations (Trewick et al. Citation2011). Our modelling found no single environmental factor controls variation in regional-endemism. Due to the correlation of climatic and geographic variables the positive contribution of mean water balance and its interaction with variance in solar radiation could potentially be due to combinations of elevation and temperature ( and S2). As drivers of endemism can involve numerous variables the influential combination could differ within and among regions. For example, Northland is relatively flat and dry compared to other regions of high invertebrate endemism, so its endemism may be better explained by past land area or past forest cover. Other regions may be more strongly influenced by geographical connections and sampling effort.
Our study of New Zealand invertebrates used the New Zealand Fauna Series as a source of data. All taxa included are relatively well studied and both their systematics and distributions can be trusted. However, these data required an analysis of regional-endemism based on 28 a priori regions that divide New Zealand into similar sized areas that do not reflect biogeographical zones since they were intended primarily to facilitate the labelling, retrieval, and documentation of specimens in natural history collections (Crosby et al. Citation1976). Boundaries between regions are a mixture of roads, straight lines between points and natural features, such as mountain ridges. Thus, the New Zealand regions used here each comprise a range of habitats and micro-climates. For example, Mid Canterbury extends from the peaks of the Southern Alps across the Canterbury plains and includes Banks Peninsula. In particular, the use of the 28 a priori regions demanded by the data available, prevented us examining the effect of habitat and climate stability and extent of glaciers on levels of regional-endemism. It is also possible that the shape of the regions had important effects (some districts are long and narrow such as WD while others are compact TO). Future work that was able to divide New Zealand into grids of equal size and shape (e.g. Crisp et al. Citation2001; Taberlet et al. Citation2012; Heenan et al. Citation2017) while retaining reliable distribution data for a large number of invertebrate taxa would allow the patterns of endemicity identified here to be examined in more detail.
Conclusions
Small-ranged species are a conservation priority, therefore, understanding current patterns of regional-endemism in New Zealand is important for protection of biodiversity. We investigated regional-endemism using a rich invertebrate dataset and found that although variation in sampling effort does influence the data, most species are range restricted and endemism levels are not evenly distributed across the country. High invertebrate species diversity and high endemism can both be conserved if Northland and Nelson are provided with resources to protect their natural habitats. No single variable appears to drive variation in regional-endemism. Those variables that were important appear to be related to differences in geologically recent land availability, and connectivity between regions. High levels of endemism in some regions are not simply a product of the accumulation of species over time, rather regional-endemism depends on the ability of a region to retain local species. Regions with fewer neighbours have lower migration rates, whereas those with many neighbours are less able to retain endemic taxa. The absence of land in southern North Island until recent geological time shows that tectonic activity in New Zealand continues to have a significant influence on current endemism levels.
Acknowledgements
Matt Irwin, Lesley Essen and Jean Sanderson helped organise data. The research was aided by a Massey University Research Fund grant to M.M.R. and scholarships to B.T.S. from Massey University, the Brian Mason Scientific & Technical Trust, and the NZ Entomological Society. We appreciate the support of the Phoenix group (www.evolves.massey.ac.nz). The manuscript was improved by constructive criticism from Matt McGlone and two anonymous reviewers.
Disclosure statement
No potential conflict of interest was reported by the authors.
Data availability statement
Data associated with the paper from Fauna of New Zealand series https://www.landcareresearch.co.nz/publications/books/fauna-of-nz-series
ORCID
Mary Morgan-Richards http://orcid.org/0000-0002-3913-9814
Additional information
Funding
Related Research Data
References
- Ahrends A, Burgess ND, Gereau RE, Marchant R, Bulling MT, Lovett JC, Platts PJ, Wilkins Kindemba V, Owen N, Fanning E, Rahbek C. 2011. Funding begets biodiversity. Diversity and Distributions. 17(2):191–200. doi: 10.1111/j.1472-4642.2010.00737.x
- Anderson S. 1994. Area and endemism. Quarterly Review of Biology. 69:451–471. doi: 10.1086/418743
- Birand A, Vose A, Gavrilets S. 2012. Patterns of species ranges, speciation, and extinction. The American Naturalist. 179:1–21. doi: 10.1086/663202
- Bulgarella M, Trewick S, Minards NA, Jacobson MJ, Morgan-Richards M, Kissling WD. 2014. Shifting ranges of two tree weta species (Hemideina spp.): competitive exclusion and changing climate. Journal of Biogeography. 41(3):524–535. doi: 10.1111/jbi.12224
- Craig DA, Craig REG, Crosby TK. 2012. Simuliidae (Insecta: Diptera). Fauna of New Zealand, Vol. 68. Lincoln: Manaaki Whenua Press.
- Crampton JS, Cooper R, Beu AG, Foote M, Marshall BA. 2010. Biotic influences on species duration: interactions between traits in marine molluscs. Paleobiology. 36:204–223. doi: 10.1666/09010.1
- Crisp MD, Laffan SW, Linder HP, Monro A. 2001. Endemism in the Australian flora. Journal of Biogeography. 28:183–198. doi: 10.1046/j.1365-2699.2001.00524.x
- Crosby TK, Dugdale JS, Watt JC. 1976. Recording specimen localities in New Zealand: An arbitrary system of areas and codes defined. New Zealand Journal of Zoology. 3:69. doi: 10.1080/03014223.1976.9517903
- Crosby TK, Dugdale JS, Watt JC. 1998. Area codes for recording specimen localities in the New Zealand subregion. New Zealand Journal of Zoology. 25:175–183. doi: 10.1080/03014223.1998.9518148
- Daru BH, Bank M, Davies TJ, Thuiller W. 2014. Spatial incongruence among hotspots and complementary areas of tree diversity in southern Africa. Diversity and Distributions. 21:769–780. doi: 10.1111/ddi.12290
- Don W. 2007. Ants of New Zealand. Dunedin: Otago University Press.
- Dowle E, Morgan–Richards M, Trewick S. 2013. Molecular evolution and the latitudinal biodiversity gradient. Heredity. 110:501–510. doi: 10.1038/hdy.2013.4
- Essl F, Moser D, Dirnböck T, Dullinger S, Milasowszky N, Winter M, Rabitsch W. 2013. Native, alien, endemic, threatened, and extinct species diversity in European countries. Biological Conservation. 164:90–97. doi: 10.1016/j.biocon.2013.04.005
- Fjeldsaå J, Ehrlich D, Lambin E, Prins E. 1997. Are biodiversity ‘hotspots’ correlated with current ecoclimatic stability? A pilot study using the NOAA-AVHRR remote sensing data. Biodiversity & Conservation. 6:401–422. doi: 10.1023/A:1018364708207
- Foote M, Crampton JS, Beu AG, Marshall BA, Cooper RA, Maxwell PA, Matcham I. 2007. Rise and fall of species occupancy in Cenozoic fossil mollusks. Science. 318:1131–1134. doi: 10.1126/science.1146303
- Goldberg J, Knapp M, Emberson RM, Townsend JI, Trewick SA, Colgan DJ. 2014. Species radiation of Carabid beetles (Broscini: Mecodema) in New Zealand. PLoS ONE. 9(1):e86185. doi: 10.1371/journal.pone.0086185
- Heads M. 1997. Regional patterns of biodiversity in New Zealand: one degree grid analysis of plant and animal distributions. Journal of the Royal Society of New Zealand. 27:337–354. doi: 10.1080/03014223.1997.9517542
- Heenan PB, Millar TR, Smissen RD, McGlone MS, Wilton AD. 2017. Phylogenetic measures of neo- and palaeo-endemism in the indigenous vascular flora of the New Zealand archipelago. Australian Systematic Botany. 30:124–133. doi: 10.1071/SB17009
- Jetz W, Rahbek C, Colwell RK. 2004. The coincidence of rarity and richness and the potential signature of history in centres of endemism. Ecology Letters. 7:1180–1191. doi: 10.1111/j.1461-0248.2004.00678.x
- Kisel Y, Barraclough TG. 2010. Speciation has a spatial scale that depends on levels of gene flow. The American Naturalist. 175:316–334. doi: 10.1086/650369
- MacArthur RH. 1969. Species packing, and what interspecies competition minimizes. Proceedings of the National Academy of Sciences of the United States of America. 64:1369–1371. doi: 10.1073/pnas.64.4.1369
- MacArthur RH, Wilson EO. 1967. The theory of island biogeography. Princeton, NJ: Princeton University Press.
- Martin RD. 1993. Primate origins – Plugging the gaps. Nature. 363:223–234. doi: 10.1038/363223a0
- McGlone M. 1989. The Polynesian settlement of New Zealand in relation to environmental and biotic changes. New Zealand Journal of Ecology. 12:115–129.
- McGlone MS, Duncan R, Heenan P. 2001. Endemism, species selection and the origin and distribution of the vascular plant flora of New Zealand. Journal of Biogeography. 28:199–216. doi: 10.1046/j.1365-2699.2001.00525.x
- McGlone MS, Newnham RM, Moar NT. 2010. The vegetation cover of New Zealand during the last glacial maximum: do pollen records under-represent woody vegetation. Terra Australis. 32:49–68.
- Millar TR, Heenan PB, Wilton AD, Smissen RD, Breitwieser I. 2017. Spatial distribution of species, genus and phylogenetic endemism in the vascular flora of New Zealand, and implications for conservation. Australian Systematic Botany. 30:134–147. doi: 10.1071/SB16015
- Moran PAP. 1950. Notes on continuous stochastic phenomena. Biometrika. 37:17–23. doi: 10.1093/biomet/37.1-2.17
- Morgan-Richards M, Bulgarella M, Sivyer L, Dowle EJ, Hale M, McKean NE, Trewick SA. 2017. Explaining large mitochondrial sequence differences within a population sample. Royal Society Open Science. 4(11):170730. doi: 10.1098/rsos.170730
- Moritz C, Patton JL, Schneider CJ, Smith TB. 2000. Diversification of rainforest faunas: an integrated molecular approach. Annual Review of Ecology and Systematics. 31:533–563. doi: 10.1146/annurev.ecolsys.31.1.533
- Myers N, Mittermeier RA, Mittermeier CG, Da Fonseca GA, Kent J. 2000. Biodiversity hotspots for conservation priorities. Nature. 403:853–858. doi: 10.1038/35002501
- Nattier R, Grandcolas P, Elias M, Desutter-Grandcolas L, Jourdan H, Couloux A, Robillard T, O’Grady P. 2012. Secondary sympatry caused by range expansion informs on the dynamics of microendemism in a biodiversity hotspot. PLoS ONE. 7(11):e48047. doi: 10.1371/journal.pone.0048047
- Neall VE, Trewick SA. 2008. The age and origin of the pacific islands – a geological overview. Philosophical Transactions of the Royal Society, London. 363:3293–3308. doi: 10.1098/rstb.2008.0119
- Papadopoulou A, Anastasiou I, Keskin B, Vogler AP. 2009. Comparative phylogeography of tenebrionid beetles in the Aegean archipelago: the effect of dispersal ability and habitat preference. Molecular Ecology. 18:2503–2517. doi: 10.1111/j.1365-294X.2009.04207.x
- Rahbek C, Graves GR. 2001. Multiscale assessment of patterns of avian species richness. Proceedings of the Natioanl Academy of Sciences. 98(8):4534–4539. doi: 10.1073/pnas.071034898
- R Development Core Team. 2010. R: a language and environment for statistical computing. Vienna, Austria: R Foundation for Statistical Computing. URL www.R-project.org/.
- Ribera I, Barraclough T, Vogler A. 2001. The effect of habitat type on speciation rates and range movements in aquatic beetles: inferences from species-level phylogenies. Molecular Ecology. 10:721–735. doi: 10.1046/j.1365-294x.2001.01218.x
- Rogers GM. 1989. The nature of the lower North Island floristic gap. New Zealand Journal of Botany. 27:221–241. doi: 10.1080/0028825X.1989.10410376
- Rogers G, Walker S. 2005. Evolution of the New Zealand vascular flora: regional and provincial patterns of richness, radiation, and endemism. New Zealand Journal of Botany. 43:381–414. doi: 10.1080/0028825X.2005.9512963
- Shepherd LD, Perrie LR, Brownsey PJ. 2007. Fire and ice: volcanic and glacial impacts on the phylogeography of the New Zealand forest fern Asplenium hookerianum. Molecular Ecology. 16:4536–4549. doi: 10.1111/j.1365-294X.2007.03451.x
- Sivyer L, Morgan-Richards M, Koot E, Trewick SA, Keyghobadi N. 2018. Anthropogenic cause of range shifts and gene flow between two grasshopper species revealed by environmental modelling, geometric morphometrics and population genetics. Insect Conservation and Diversity. 11(5):415–434. doi: 10.1111/icad.12289
- Taberlet P, Zimmermann NE, Englisch T, Tribsch A, Holderegger R, Alvarez N, Niklfeld H, Coldea G, Mirek Z, Moilanen A, et al. 2012. Genetic diversity in widespread species is not congruent with species richness in alpine plant communities. Ecology Letters. 15(12):1439–1448. doi: 10.1111/ele.12004
- Trewick SA, Bland KJ. 2012. Fire and slice: palaeogeography for biogeography at New Zealand’s North Island/South Island juncture. Journal of the Royal Society of New Zealand. 42:153–183. doi: 10.1080/03036758.2010.549493
- Trewick SA, Pilkington S, Shepherd LD, Gibb GC, Morgan-Richards M. 2017. Closing the gap: avian lineage splits at a young, narrow seaway imply a protracted history of mixed population response. Molecular Ecology. 26(20):5752–5772. doi: 10.1111/mec.14323
- Trewick SA, Wallis GP. 2001. Bridging the ‘beech-gap’: New Zealand invertebrate phylogeography implicates Pleistocene glaciation and Pliocene isolation. Evolution. 55:2170–2180.
- Trewick SA, Wallis G, Morgan-Richards M. 2000. Phylogeographical pattern correlates with Pliocene mountain building in the alpine scree weta (Orthoptera, Anostostomatidae). Molecular Ecology. 9:657–666. doi: 10.1046/j.1365-294x.2000.00905.x
- Trewick SA, Wallis GP, Morgan-Richards M. 2011. The invertebrate life of New Zealand: a phylogeographic approach. Insects. 2:297–325. doi: 10.3390/insects2030297
- Veech JA, Crist TO. 2007. Habitat and climate heterogeneity maintain beta-diversity of birds among landscapes within ecoregions. Global Ecology and Biogeography. 16:650–656. doi: 10.1111/j.1466-8238.2007.00315.x
- Vink CJ. 2002. Lycosidae (Arachnida: Araneae). Fauna of New Zealand, Vol. 44. Lincoln: Manaaki Whenua Press.
- Wallace AR. 1876. The geographical distribution of animals. London: MacMillan.
- Wallis GP, Trewick SA. 2009. New Zealand phylogeography: evolution on a small continent. Molecular Ecology. 18:3548–3580. doi: 10.1111/j.1365-294X.2009.04294.x
- Wallis GP, Waters JM, Upton P, Craw D. 2016. Transverse alpine speciation driven by glaciation. Trends in Ecology and Evolution. 31:916–926. doi: 10.1016/j.tree.2016.08.009
- Ward DF. 2012. More than just records: analysing natural history collections for biodiversity planning. PLoS One. 7(11):e50346. doi: 10.1371/journal.pone.0050346
- Wardle P. 1963. Evolution and distribution of the New Zealand flora, as affected by Quartenary climates. New Zealand Journal of Botany. 1:3–17. doi: 10.1080/0028825X.1963.10429318
- Waters JM, Fraser CI, Hewitt GM. 2013. Founder takes all: density-dependent processes structure biodiversity. Trends in Ecology & Evolution. 28:78–85. doi: 10.1016/j.tree.2012.08.024
- Webb TJ, Gaston KJ. 2003. On the heritability of geographic range sizes. The American Naturalist. 161:553–566. doi: 10.1086/368296
- Williams PW, McGlone M, Neil H, Zhao JX. 2015. A review of New Zealand palaeoclimate from the last Interglacial to the global last glacial maximum. Quaternary Science Reviews. 110:92–106. doi: 10.1016/j.quascirev.2014.12.017
- Wilmé L, Goodman SM, Ganzhorn JU. 2006. Biogeographic evolution of Madagascar’s microendemic biota. Science. 312:1063–1065. doi: 10.1126/science.1122806
- Wollenberg KC, Vieites DR, Van Der Meijden A, Glaw F, Cannatella DC, Vences M. 2008. Patterns of endemism and species richness in Malagasy cophyline frogs support a key role of mountainous areas for speciation. Evolution. 62:1890–1907. doi: 10.1111/j.1558-5646.2008.00420.x