
ABSTRACT
Kiwis (Apterygidae) are an enigmatic family of flightless birds endemic to New Zealand. Apterygidae is made up of a single genus, Apteryx with five species, four of which are characterised as at risk of greater by the New Zealand Department of Conservation. These five species are further separated into two morphologically and genetically distinguishable clades, containing A.haastii, and A.owenii in one and A.rowi, A.mantelli, and A.australis in the other. We reconstructed 17 kiwi mitochondrial genomes from previously published genomic data, nine from A.rowi and eight from A.owenii. Mitochondrial diversity analyses uncovered low levels of genetic diversity consistent with their reduced ranges and conservation concern. We further used one of the assembled A.rowi mitochondrial genomes together with mitochondrial genomes from A.haastii, A.owenii, A.mantelli, and several other individuals from Palaeognathae to estimate the within and between clade divergence times of kiwis. Our study exemplifies how available published data can be used in novel ways to provide new and complementary evolutionary insights to previous studies.
Introduction
Kiwis (Apterygidae) are a unique family of birds endemic to New Zealand and are representatives of the most basally-diverging extant avian lineage (paleognaths). They are ratite birds with unusual biological attributes, e.g. low metabolic rates, lack of colour vision, large egg sizes, flightlessness, long lifespans, and nocturnality (Ramstad et al. Citation2016). Currently there are five recognised species in a single genus Apteryx. These species can be placed into two morphologically and genetically distinguishable clades with the great and little spotted kiwi (Apteryx haastii, A.owenii) forming one, and the Okarito, Southern brown, and North Island brown kiwi (A.rowi, A.mantelli, A.australis) forming a second (Shepherd et al. Citation2012; Weir et al. Citation2016). Four out of the five kiwi species have designated conservation statuses of ‘at risk’ or greater as determined by the New Zealand Department of Conservation (DOC) (Robertson et al. Citation2017) which can be attributed to the decreasing numbers of individuals after human colonisation 800–1,000 years ago (Hurles et al. Citation2003; Shepherd and Lambert Citation2008). Before human arrival, kiwi mainly occurred in rainforest habitat across the North and South Islands of New Zealand but were also found in other types of habitats to a lesser extent (Weir et al. Citation2016). However, since the arrival of humans, the distribution range of all five extant kiwi species has greatly reduced (Shepherd et al. Citation2012). The greatest reduction can be observed in the little spotted kiwi, A.owenii, as it was once widely distributed on the mainland of New Zealand’s North and South Islands (Buller and Keulemans Citation1888; Peat Citation1990; Worthy and Holdaway Citation2002) but today can only be found in populations surviving on offshore islands, and in wildlife sanctuaries. Despite this, A.owenii is the only kiwi species listed as ‘recovering’ by DOC due to a predicted increase in population size >10% over the next 10 years (Robertson et al. Citation2017). Previous studies using short fragments of ancient DNA uncovered the genetic consequences of these range contractions in kiwi and suggested significant decreases in genetic diversity as a result, especially in A.rowi, and A.australis (Shepherd and Lambert Citation2008).
Here, we construct the complete mitochondrial genome from a single A.rowi individual through iterative mapping and use this together with three other Apteryx mitochondrial genomes to produce a dated phylogenetic tree of Apteryx. Moreover, we assembled an additional 16 kiwi mitochondrial genomes (eight from A.rowi, and eight from A.owenii) to assess the comparative mitochondrial genetic diversity of these two threatened kiwi species.
Materials and methods
Apteryx rowi mitogenome construction
We constructed the complete mitochondrial genome of A.rowi through iterative mapping using MITObim v1.8 (Hahn et al. Citation2013), a wrapper for the mapping software MIRA (Chevreux et al. Citation1999). First we subsampled 20 million reads from the raw reads previously used to assemble the nuclear genome (BioProject accession: PRJNA433110, SRA accession: SRR6918118) (Sackton et al. Citation2019), removed Illumina adapters sequences and reads shorter than 30 bp using skewer v0.2.2 (Jiang et al. Citation2014), and removed PCR duplicates using prinseq (Schmieder and Edwards Citation2011). We ran six independent runs of MITObim using three different mapping references, A.haastii (Genbank accession: AF338708.2), A.mantelli (Genbank accession: KU695537.1), and A.owenii (Genbank accession: NC_013806.1) and two different mismatch values (–missmatch 0 and 1), to ensure the authenticity of our resultant mitochondrial genome and avoid ascertainment biases based on the reference genome selected. We converted the MITObim output maf files into sam files using miraconvert and imported the resulting sam alignment files into Geneious v 11.1 (Kearse et al. Citation2012) to be visualised and built into consensus sequences. We constructed six independent consensus sequences by specifying a minimum read depth of 10x, a 75% base call threshold, and called a gap where there was no coverage. We aligned the resulting six consensus sequences using a command-line version of Mafft v7.392 (Katoh and Standley Citation2013) and built a final consensus sequence from this alignment by specifying a 50% strict consensus base call and ignoring gaps. The final consensus was then annotated using the MITOS v6b33f95 online server (Bernt et al. Citation2013) to check for the completeness and correctness of the assembly.
Phylogenetic analysis
To estimate the divergence times of the kiwi lineages, we constructed a dated Bayesian phylogenetic tree. Firstly, we downloaded representatives of each major Palaeognathae clade from Genbank (Supplementary table S1) and aligned these with our A.rowi mitochondrial genome using Mafft and default parameters. We then manually extracted only the protein coding genes (excluding NAD3 due to a known singleton insertion resulting in a coding frameshift (Mindell et al. Citation1998)) and rRNA from this alignment based on the annotations available on Genbank. To investigate the correctness of the extracted protein coding genes, we converted each gene into their respective amino acid sequences using MEGA X (Kumar et al. Citation2018). Furthermore, due to the highly divergent lineages present, potentially leading to high levels of nucleotide substitution saturation, we only included the first and second codon positions of the protein coding genes in the analysis. We ran the resultant alignment through Partitionfinder v2 (Lanfear et al. Citation2017) specifying each gene and rRNA independently, and the first and second codon positions individually to identify the optimal partitioning scheme and substitution models for each partition. We then used BEAST v 1.8.2 (Drummond and Rambaut Citation2007) to build a fossil calibrated phylogeny using a relaxed lognormal clock rate to accommodate variation in substitution rates along individual branches of the tree, a birth–death speciation model, specifying the partitions and substitution models defined in Partitionfinder, and two exponentially distributed fossil calibration points. One fossil calibration point was based on the fossil Diogenornis sp. representing non-ostrich palaeognaths (Notopalaeognathae) (Alvarenga Citation1983) with an offset value of 56Ma and a mean of 5.44. The second was based on the fossil Emuarius gidju representing the mutual ancestor of emus and cassowaries (Boles Citation1992) with an offset value of 25Ma and a mean of 3.33. We ran the BEAST analysis for 500 million iterations, sampling and recording the MCMC chain after every 50,000 generations. Convergence was evaluated using Tracer v1.6 (Rambaut et al. Citation2013) and an ESS value greater than 200. After 500 million states, partitions 1, 3 and 4 did not reach convergence, indicating that they may have been over-parameterised. We subsequently downgraded the substitution models to the simpler HKY + G model after which the analysis reached convergence. We used treeannotator v 1.8.2 (Drummond and Rambaut Citation2007) to build a maximum clade credibility tree from the output and specified the node heights as the median heights with a burn in of 10% (50 million states).
Population level mitochondrial diversity
To examine population level mitochondrial diversity, we downloaded the raw reads from previously published transcriptome data for eight Apteryx rowi and eight Apteryx owenii individuals (Ramstad et al. Citation2016) (Supplementary table S2). The A.owenii individuals were sampled from Kapiti Island, Long Island, and Zealandia Sanctuary and the A.rowi individuals were sampled from Okarito Sanctuary. For this data, we removed poly-A stretches, Illumina adapter sequences, and reads shorter than 30 bp using skewer. We mapped trimmed reads to the respective conspecific mitochondrial genome using BWA v0.7.15 with the mem algorithm (Li and Durbin Citation2009) then parsed and removed duplicate reads from the output using SAMtools v1.6 (Li et al. Citation2009). Mitochondrial-wide read depth was calculated using SAMtools depth, calling read depth on all sites, even those with missing data (-a parameter). We constructed consensus sequences using ANGSD v0.921 (Korneliussen et al. Citation2014) specifying a consensus base call (-doFasta 2), minimum mapping and base qualities of 25 (-minmapq 25, -minq 25), and a minimum read death of 5 (-minInddepth 5). We aligned the consensus sequences for each species independently using Mafft, which were then imported into MEGA X to calculate genetic diversity in the form of average pairwise number of differences between sequences (k). We produced haplotype networks on the population level alignments using PopART (Leigh and Bryant Citation2015) specifying a median joining network.
Results
Apteryx rowi mitochondrial genome construction
Using an iterative mapping approach, we successfully assembled a 16,918 bp A.rowi mitochondrial genome from short read Illumina data. Automatic annotation using MITOS (Bernt et al. Citation2013) confirmed the presence of all 13 protein coding gene regions, 20 tRNA, and 2 rRNA. A manual inspection and alignment to complete mitochondrial genomes of other kiwi species confirmed the presence of the control region. We also found evidence for a singleton insertion in the NAD3, previously found in a number of avian mitochondrial genomes (Mindell et al. Citation1998). This singleton insertion can also be found in the mitochondrial genomes of A.haastii (AF338708.2) and A.owenii (NC_013806.1).
Dated phylogeny
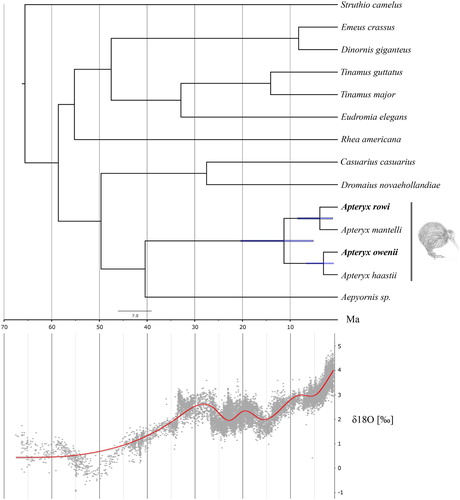
Using our newly assembled A.rowi mitochondrial genome, and individual representatives from all other previously published kiwi and Palaeognathae mitochondrial genomes, we recovered the expected topology (Shepherd et al. Citation2012; Weir et al. Citation2016) within Apterygidae with A.rowi and A.mantelli as sister species, and A.owenii and A.haastii as sister species (). Furthermore, we found the divergence between the two major kiwi clades to be ∼11.3 Ma (Credibility interval (CI) 5.1–20.4 Ma), the divergence between A.rowi and A.mantelli to be ∼3.8 Ma (CI 1.0 - 8.4 Ma), and the divergence between A.owenii and A.haastii to be ∼3.0Ma (CI 0.8–6.6Ma).
Figure 1. Dated phylogenetic tree of paleognaths and δ18O levels through time taken from Zachos et al (Zachos et al. Citation2001). Blue bars on nodes represent the 95% credibility interval of node ages. The red line represents the smoothed (generalised additive mode) data and the grey cloud represents the raw data points.
Genetic diversity
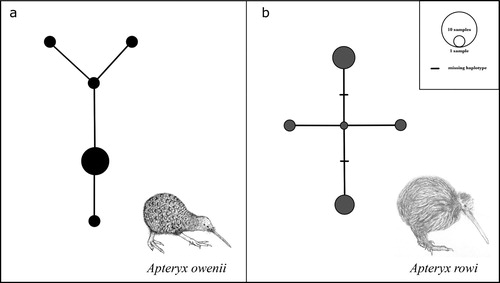
To investigate the genetic diversity of the two kiwi species, A.owenii, and A.rowi, we downloaded raw Illumina data previously used for transcriptome analyses (Ramstad et al. Citation2016) and assembled the mitochondrial genomes for each individual. This resulted in eight high coverage (159–170x)(Supplementary figures S1 and S2) mitochondrial genomes per species. We aligned these with previously published complete mitochondrial genomes and our A.rowi mitochondrial genome to give us ten sequences for A.owenii, and nine for A.rowi. We computed the genetic diversity based on the average pairwise number of differences between the individuals (k) using MEGA X and found k=1.07 in A.owenii and k=2.56 in A.rowi. Haplotype networks revealed five unique haplotypes in A.owenii and four in A.rowi ().
Figure 2. Haplotype networks for A.owenii (a), and A.rowi (b). Circles represent unique haplotypes, size of the circle represents number of individuals with said haplotype.
Discussion
We constructed the complete mitochondrial genome of A.rowi from previously published genomic data (Sackton et al. Citation2019), to provide additional evidence as to the phylogenetic relationships within kiwis. We found the two major clades expected within kiwi (Shepherd et al. Citation2012; Weir et al. Citation2016), one containing the great and little spotted kiwi (Apteryx haastii, A. owenii) and the other containing the Okarito and North Island brown kiwi (A.rowi, A.mantelli). Furthermore, our dated phylogeny produced a stem Apteryx divergence date consistent with previous studies despite the use of different genetic markers and individuals, giving us confidence in our results. However, this was not unexpected as previous studies have produced a wide range of divergence dates for the stem Apteryx. These have ranged from ∼5.9Ma (Weir et al. Citation2016), ∼6.3Ma (Haddrath and Baker Citation2012), and ∼8.5Ma (Jetz et al. Citation2012; Mitchell et al. Citation2014), to ∼13.4Ma (Grealy et al. Citation2017) and ∼14.5Ma (Phillips et al. Citation2010). We found a split of ∼11.3Ma (CI 5.1–20.4 Ma), which sits well within the variance of the previous studies. The high amount of variability between studies could stem from Palaeognathae containing a number of deeply diverging evolutionary lineages. This can lead to problems with accurate phylogenetics caused by incorrectly identifying fossil calibration points, long branch attraction (Bergsten Citation2005), different mutation rates based on life characteristics e.g. length and body size (Nabholz et al. Citation2008; Lanfear et al. Citation2010), and substitution saturation. We attempted to solve these issues by including as many taxa as possible, partitioning our data, only including protein coding regions, and removing third codon positions. The divergence of stem kiwi may coincide with the opening of niches after a large extinction event during the Middle Miocene climatic transition (Shevenell et al. Citation2004; Lewis et al. Citation2008). The early Miocene in New Zealand is characterised by a time of prosperity and species richness due to its subtropical climate. However, from ∼14Ma New Zealand experienced a dramatic and abrupt cooling period that led to a significant number of vertebrate extinctions (Tennyson Citation2010) which may have resulted in new niches being available ∼11Ma. Moreover, the within clade divergences, ∼3Ma, may have also been influenced by climatic cooling and the opening of niches. The Late Pliocene–Pleistocene, was similarly characterised by a number of extinctions caused by climatic cooling (Cooper and Millener Citation1993; Tennyson Citation2010).
In addition to the dated phylogeny, we also increased the number of currently available complete mitochondrial genomes for two kiwi species, A.rowi which is listed as nationally vulnerable by DOC, and A.owenii which is listed as recovering (Robertson et al. Citation2017). To date, there are only seven complete mitochondrial genomes available for any kiwi species, and the analyses of these mitochondrial genomes have been restricted to understanding the evolutionary relationships of paleognaths (Cooper et al. Citation2001; Haddrath and Baker Citation2001; Mitchell et al. Citation2014), and not of the kiwi itself. We add to this by assembling the complete mitochondrial genomes for 16 individuals (eight A.rowi, and eight A.owenii) from transcriptome data (Ramstad et al. Citation2016). This resulted in an increase in the number of available kiwi complete mitochondrial genomes by 3.4-fold. This not only provides a valuable resource for the greater scientific community but also enables us to assess the within species genetic diversity of these two threatened kiwi species in the current study.
We found low levels of mitochondrial diversity in both species analysed here. These levels of low genetic diversity are not surprising, especially due to the extremely limited ranges of both species. Apteryx owenii, is now extinct on the mainland of New Zealand’s North and South Islands and only survives due to human intervention on offshore islands and wildlife sanctuaries (Colbourne Citation2005). Apteryx rowi is restricted to the Okarito forest on the West Coast of New Zealand's South Island and would also therefore be expected to have limited diversity. These results conform to conservation listings of these species by DOC (Robertson et al. Citation2017). Furthermore, results are consistent with previous studies based on short fragments of the mitochondrial genome (Shepherd and Lambert Citation2008; Shepherd et al. Citation2012) in both species, as well as nuclear data from A.owenii (Ramstad et al. Citation2010).
Conclusions
In the present study, we were able to provide insights into the evolutionary relationships and genetic diversity of New Zealand’s iconic kiwi utilising only publicly available data. We were able to construct several complete mitochondrial genomes from two kiwi species, A.rowi and A.owenii, which in turn dramatically increased the number of kiwi mitochondrial genomes publically available. Our study exemplifies the amount of data that is publically available but underutilised and how it can be used in novel ways to provide new and complementary insights to other previously published work.
Supplementary Material
Download PDF (126.9 KB)Acknowledgements
We would like to acknowledge the Kaitiaki o Kapiti Trust, Te Rūnanaga Ngāi Tahu, Port Nicholson Block Settlement Trust, Te Ātiawa Manawhenua Ki Te Tau Ihu Trust, Te Rūnanga o Makaawhio, and Waiorua Bay Trust, who provided guidance to the authors of the studies that published the original genomic data, on which our study is based. We would also like to thank Lara Shepherd and one anonymous reviewer for their insightful comments which allowed us to improve the quality of the manuscript.
Data availability statement
All newly assembled mitochondrial genomes can be found under the Genbank acession codes MT437231-MT437247.
Related Research Data
References
- Alvarenga HMF. 1983. Uma ave ratitae do Paleoceno Brasileiro: bada calcarla de Itaboraí, Estado do Rio de Janeiro, Brasil. Boletim do Museu Nacional de Rio de Janeiro Geologia. 41:1–11.
- Bergsten J. 2005. A review of long-branch attraction. Cladistics. 21(2):163–193.
- Bernt M, Donath A, Jühling F, Externbrink F, Florentz C, Fritzsch G, Pütz J, Middendorf M, Stadler PF. 2013. MITOS: improved de novo metazoan mitochondrial genome annotation. Mol Phylogenet Evol. 69(2):313–319.
- Boles WE. 1992. Revision of Dromaius gidju Patterson and Rich 1987 from Riversleigh, northwestern Queensland, Australia, with a reassessment of its generic position. Natural History Museum of LA County Science Series. 36:195–208.
- Buller SWL, Keulemans JG. 1888. A history of the birds of New Zealand. Selbstverl.
- Chevreux B, Wetter T, Suhai S. Others 1999. Genome sequence assembly using trace signals and additional sequence information. German Conference on Bioinformatics. 99:45–56.
- Colbourne R. 2005. Kiwi (Apteryx spp.) on offshore New Zealand islands. NZ Dep Conserv Res Dev Ser. 208. http://citeseerx.ist.psu.edu/viewdoc/download?doi=10.1.1.214.4423&rep=rep1&type=pdf.
- Cooper A, Lalueza-Fox C, Anderson S, Rambaut A, Austin J, Ward R. 2001. Complete mitochondrial genome sequences of two extinct moas clarify ratite evolution. Nature. 409(6821):704–707.
- Cooper RA, Millener PR. 1993. The New Zealand biota: Historical background and new research. Trends Ecol Evol. 8(12):429–433.
- Drummond AJ, Rambaut A. 2007. BEAST: Bayesian evolutionary analysis by sampling trees. BMC Evol Biol. 7(1):214–214.
- Grealy A, Phillips M, Miller G, Gilbert MTP, Rouillard J-M, Lambert D, Bunce M, Haile J. 2017. Eggshell palaeogenomics: Palaeognath evolutionary history revealed through ancient nuclear and mitochondrial DNA from Madagascan elephant bird (Aepyornis sp.) eggshell. Mol Phylogenet Evol. 109:151–163.
- Haddrath O, Baker AJ. 2001. Complete mitochondrial DNA genome sequences of extinct birds: ratite phylogenetics and the vicariance biogeography hypothesis. Proc Biol Sci. 268(1470):939–945.
- Haddrath O, Baker AJ. 2012. Multiple nuclear genes and retroposons support vicariance and dispersal of the palaeognaths, and an early Cretaceous origin of modern birds. Proc Biol Sci. 279(1747):4617–4625.
- Hahn C, Bachmann L, Chevreux B. 2013. Reconstructing mitochondrial genomes directly from genomic next-generation sequencing reads—a baiting and iterative mapping approach. Nucleic Acids Res. 41(13):e129–e129.
- Hurles ME, Matisoo-Smith E, Gray RD, Penny D. 2003. Untangling Oceanic settlement: the edge of the knowable. Trends Ecol Evol. 18(10):531–540.
- Jetz W, Thomas GH, Joy JB, Hartmann K, Mooers AO. 2012. The global diversity of birds in space and time. Nature. 491(7424):444–448.
- Jiang H, Lei R, Ding S-W, Zhu S. 2014. Skewer: a fast and accurate adapter trimmer for next-generation sequencing paired-end reads. BMC Bioinformatics. 15(1):182–182.
- Katoh K, Standley DM. 2013. MAFFT multiple sequence alignment software version 7: improvements in performance and usability. Mol Biol Evol. 30(4):772–780.
- Kearse M, Moir R, Wilson A, Stones-Havas S, Cheung M, Sturrock S, Buxton S, Cooper A, Markowitz S, Duran C, et al. 2012. Geneious Basic: an integrated and extendable desktop software platform for the organization and analysis of sequence data. Bioinformatics. 28(12):1647–1649.
- Korneliussen TS, Albrechtsen A, Nielsen R. 2014. ANGSD: analysis of next generation sequencing data. BMC Bioinformatics. 15(1):356–356.
- Kumar S, Stecher G, Li M, Knyaz C, Tamura K. 2018. MEGA x: Molecular evolutionary genetics analysis across computing platforms. Mol Biol Evol. 35(6):1547–1549.
- Lanfear R, Frandsen PB, Wright AM, Senfeld T, Calcott B. 2017. Partitionfinder 2: New methods for selecting partitioned models of evolution for molecular and morphological phylogenetic analyses. Mol Biol Evol. 34(3):772–773.
- Lanfear R, Welch JJ, Bromham L. 2010. Watching the clock: studying variation in rates of molecular evolution between species. Trends Ecol Evol. 25(9):495–503.
- Leigh JW, Bryant D. 2015. popart: full-feature software for haplotype network construction. Methods Ecol Evol. 6(9):1110–1116.
- Lewis AR, Marchant DR, Ashworth AC, Hedenäs L, Hemming SR, Johnson JV, Leng MJ, Machlus ML, Newton AE, Raine JI, et al. 2008. Mid-Miocene cooling and the extinction of tundra in continental Antarctica. Proc Natl Acad Sci U S A. 105(31):10676–10680.
- Li H, Durbin R. 2009. Fast and accurate short read alignment with Burrows–wheeler transform. Bioinformatics. 25(14):1754–1760.
- Li H, Handsaker B, Wysoker A, Fennell T, Ruan J, Homer N, Marth G, Abecasis G, Durbin R. 2009. 1000 genome Project data Processing Subgroup. The Sequence Alignment/Map Format and SAMtools. Bioinformatics. 25(16):2078–2079.
- Mindell DP, Sorenson MD, Dimcheff DE. 1998. An extra nucleotide is not translated in mitochondrial ND3 of some birds and turtles. Mol Biol Evol. 15(11):1568–1571.
- Mitchell KJ, Llamas B, Soubrier J, Rawlence NJ, Worthy TH, Wood J, Lee MSY, Cooper A. 2014. Ancient DNA reveals elephant birds and kiwi are sister taxa and clarifies ratite bird evolution. Science. 344(6186):898–900.
- Nabholz B, Glémin S, Galtier N. 2008. Strong Variations of mitochondrial mutation rate across Mammals—the Longevity Hypothesis. Mol Biol Evol. 25(1):120–130.
- Peat N. 1990. The incredible kiwi: A wild south book. Random Century.
- Phillips MJ, Gibb GC, Crimp EA, Penny D. 2010. Tinamous and moa flock together: mitochondrial genome sequence analysis reveals independent losses of flight among ratites. Syst Biol. 59(1):90–107.
- Rambaut A, Suchard MA, Xie D, Drummond AJ. 2013. Tracer 1.6. Edinburgh: University of Edinburgh.
- Ramstad KM, Miller HC, Kolle G. 2016. Sixteen kiwi (Apteryx spp) transcriptomes provide a wealth of genetic markers and insight into sex chromosome evolution in birds. BMC Genomics. 17(1):410–410.
- Ramstad KM, Pfunder M, Robertson HA, Colbourne RM, Allendorf FW, Daugherty CH. 2010. Fourteen microsatellite loci cross-amplify in all five kiwi species (Apteryx spp.) and reveal extremely low genetic variation in little spotted kiwi (A. owenii). Conserv Genet Resour. 2(1):333–336.
- Robertson HA, Baird K, Dowding JE, Elliott GP, Hitchmough RA, Miskelly CM, McArthur N, O’Donnell CFJ, Sagar PM, Scofield RP, et al. 2017. Conservation status of New Zealand birds, 2016. https://www.doc.govt.nz/documents/science-and-technical/nztcs19entire.pdf.
- Sackton TB, Grayson P, Cloutier A, Hu Z, Liu JS, Wheeler NE, Gardner PP, Clarke JA, Baker AJ, Clamp M, et al. 2019. Convergent regulatory evolution and loss of flight in paleognathous birds. Science. 364(6435):74–78.
- Schmieder R, Edwards R. 2011. Quality control and preprocessing of metagenomic datasets. Bioinformatics. 27(6):863–864.
- Shepherd LD, Lambert DM. 2008. Ancient DNA and conservation: lessons from the endangered kiwi of New Zealand. Mol Ecol. 17(9):2174–2184.
- Shepherd LD, Worthy TH, Tennyson AJD, Scofield RP, Ramstad KM, Lambert DM. 2012. Ancient DNA analyses reveal contrasting phylogeographic patterns amongst kiwi (Apteryx spp.) and a recently extinct lineage of spotted kiwi. PLoS One. 7(8):e42384–e42384.
- Shevenell AE, Kennett JP, Lea DW. 2004. Middle Miocene Southern Ocean cooling and Antarctic cryosphere expansion. Science. 305(5691):1766–1770.
- Tennyson AJD. 2010. The origin and history of New Zealand’s terrestrial vertebrates. N Z J Ecol. 34(1):6–6.
- Weir JT, Haddrath O, Robertson HA, Colbourne RM, Baker AJ. 2016. Explosive ice age diversification of kiwi. Proc Natl Acad Sci U S A. 113(38):E5580–7.
- Worthy TH, Holdaway RN. 2002. The lost world of the Moa: Prehistoric life of New Zealand. Bloomington, IN: Indiana University Press.
- Zachos J, Pagani M, Sloan L, Thomas E, Billups K. 2001. Trends, rhythms, and aberrations in global climate 65 Ma to present. Science. 292(5517):686–693.