
ABSTRACT
The critically endangered kākāpō is a flightless, nocturnal parrot endemic to Aotearoa New Zealand. During the 2019 breeding season multiple kākāpō on Whenua Hou, an island with one of the largest kākāpō populations, contracted the respiratory fungal disease aspergillosis. Infection is caused by members of the genus Aspergillus which can seriously impact avian health and is often fatal to wild and domestic birds. We sought to understand how Aspergillus influenced the gut mycobiota of kākāpō chicks and surrounding nest litter communities over a 10-week period. This study was conducted in parallel with another longitudinal project utilising the same samples where we investigated the influence of management practice on development of gut bacterial communities in kākāpō chicks. Ultimately, aspergillosis infection had no significant impact on the fungal communities of kākāpō chicks or nest litter, and nor did regular management practices (i.e. artificially removing faecal material from nests). Age and time, however, were significantly associated with variation in the mycobiotas of chick and nest samples. Overall, this study represents our first glimpse of the kākāpō gut mycobiota and provides essential information and future research directions for the conservation of this rare species.
Introduction
Aspergillosis, a respiratory fungal infection, is a major source of morbidity and mortality in wild and domestic birds (Tell Citation2005; Beernaert et al. Citation2010; Leishangthem et al. Citation2015; Melo et al. Citation2020; Arné et al. Citation2021; Lofgren et al. Citation2022). The disease is caused by members of the fungal genus Aspergillus, particularly A. fumigatus, to which birds are especially susceptible (Tell Citation2005; Melo et al. Citation2020; Arné et al. Citation2021). Aspergillus species are ubiquitous in soil and decomposing plants, and strains responsible for infection are considered to be opportunistic etiological agents of aspergillosis (Vedova et al. Citation2019; Melo et al. Citation2020). Young and immunocompromised birds are particularly susceptible to infection which, coupled with increasing rates of resistance to common antifungal treatments such as azole, is of global concern for wildlife management (Beernaert et al. Citation2010; Leishangthem et al. Citation2015; Melo et al. Citation2020).
The kākāpō is a critically endangered flightless parrot endemic to Aotearoa New Zealand which only breeds every 2–4 years (Powlesland et al. Citation2006). During the 2019 breeding season a record number of chicks successfully hatched, though an outbreak of aspergillosis unfortunately swept through one of the main island populations (Whenua Hou) where many of the nests were located (Winter et al. Citation2022). Of the 21 chicks and mothers affected by aspergillosis during this outbreak, nine birds ultimately died from the disease despite exhaustive medical care. Faecal samples from chicks had been collected throughout the breeding season for a separate study on the development of the kākāpō gut bacterial biota (West et al. Citation2022), and to test whether regular removal of faecal matter from the nest impacted the faecal bacterial community profile (corresponding nest litter samples were also collected). These samples provided a serendipitous opportunity to explore the fungal community profiles of both faecal and litter samples from infected and unaffected kākāpō offspring and their corresponding nests. Though aspergillosis is primarily a respiratory infection, we sought to understand whether infection and overall ill health may be linked to an altered gut mycobiota. Aspergillosis is also often observed as a secondary infection and any change in the gut mycobiota may lead to a better holistic understanding of the 2019 disease outbreak. Investigating the fungal gut biota would also enhance our knowledge of kākāpō biology and the role of fungi in kākāpō health, while knowledge of the litter mycobiome may yield important information regarding transmission routes for pathogenic fungi in the nest environment (especially given the ubiquity of Aspergillus in soil and leaf litter). Previous research by our team suggests kākāpō gut microbiota is typically characterised by a relatively depauperate bacterial community that is often dominated by Escherichia-Shigella (Waite et al. Citation2012, Citation2013, Citation2014, Citation2018; Perry et al. Citation2017; West et al. Citation2022). The relative abundance of Escherichia-Shigella varies substantially among kākāpō individuals and is associated with supplemental feeding in chicks, though not adults (Waite et al. Citation2014; Perry et al. Citation2017; West et al. Citation2022). To date, virtually nothing is known about the fungal component of the kākāpō microbiota, despite the likely importance of fungi to host health (Strati et al. Citation2016; Wu et al. Citation2021). The mycobiota is known to vary over time and with various environmental factors, particularly diet and location, in humans and other animal species including avians (Strati et al. Citation2016; Sun et al. Citation2018; Mahtab et al. Citation2021; Xiang et al. Citation2021; Liu et al. Citation2022a). A decrease in fungal diversity with age is observed in humans and Tibetan macaques (Strati et al. Citation2016; Sun et al. Citation2018), potentially due to antagonistic behaviour between bacterial and fungal communities (Dollive et al. Citation2013). A recent study also found that both oral and faecal mycobiomes of Thai cynomolgus macaques differed drastically between wild and captive populations (Sawaswong et al. Citation2020), reflecting variation in habitat and diets between the two conditions.
In both humans and animal models, disease is regularly associated with dysbiosis, i.e. a breakdown or imbalance (often associated with loss of key microbiota members) within a microbial community (Iliev and Leonardi Citation2017; Mishra et al. Citation2021). There is currently much speculation regarding the effect of changing microbial communities in captive threatened species or those under substantial anthropogenic management (Wienemann et al. Citation2011; West et al. Citation2019; Moustafa et al. Citation2021). Recent examples of dysbiosis in threatened species include diarrhoea-associated fungal dysbiosis in the critically endangered Baer’s pochard (Xi et al. Citation2021), as well as skin microbiota dysbiosis with Batrachochytrium dendrobatidis infection in amphibians (Woodhams et al. Citation2012; Jani and Briggs Citation2014; Bates et al. Citation2019; Weeks et al. Citation2020; Jani et al. Citation2021). The ever-increasing knowledge garnered from studies in humans and animal model species could also be applied in this context (e.g. Kong et al. Citation2012; Pilla and Suchodolski Citation2020; Padakandla et al. Citation2022; Liu et al. Citation2022b). Infections in young human children, particularly those treated with antibiotics, can alter the composition of the gut microbiota and lead to development of allergies and food intolerances later in life (Love et al. Citation2016; Herman Citation2020). A common dysbiosis in the human gastrointestinal tract involves an overgrowth and dominance of Candida fungi, often associated with diseases of complex aetiology such as Crohn’s disease (Lewis et al. Citation2015; Liguori et al. Citation2015; Iliev and Leonardi Citation2017; Sokol et al. Citation2017). Given the long-term effects that microbial dysbiosis can have, at least in mammals, we aimed to discover whether variation in the gut mycobiota of kākāpō chicks hatched during the outbreak could be attributed to aspergillosis infection.
Here we describe a longitudinal analysis of the kākāpō mycobiota in faecal and nest litter samples using ITS2 amplicon sequencing to improve our understanding of the disease outbreak in this critically endangered species. This research complements other studies on the kākāpō aspergillosis epidemic, conducted under the auspices of the Kākāpō Aspergillosis Research Consortium, which encompass a wide range of methodologies. These projects explore, among other things, the spore densities of Aspergillus, toxin production, Aspergillus genomics and the metagenomic diversity of disease-associated samples. The findings of our study add valuable knowledge to the fast-growing field of conservation microbiology research that aims to enhance management practices for threatened species.
Methods
Sample collection
Faecal and litter material were collected from 29 kākāpō chicks inhabiting 15 nests (often more than one chick per nest; Supplementary Table 1) from Whenua Hou/Codfish Island (46°47′S, 167°38′E) and Pukenui/Anchor Island (45°45′S, 166°31′E) by NZ Department of Conservation (NZDOC; Te Papa Atawhai). This represents a subset of the samples analysed for the bacteria biota in West et al. (Citation2022). Samples were placed directly into 5 mL sterile polypropylene tubes containing 2.5 mL of RNAlater, then stored overnight at 4 °C and subsequently at −20°C until shipping on ice to the Waipapa Taumata Rau University of Auckland. We used faecal and litter material obtained from five kākāpō chicks and two nests where no aspergillosis was detected as controls in this study; in addition, samples from seven kākāpō chicks and two nests which encountered the disease but were not ill or considered a site of infection are referred to as ‘Linked’ (Supplementary Table 1). The remaining 17 kākāpō chicks and 11 nests included in this study were diagnosed and associated with aspergillosis (Supplementary Table 1). Healthy chicks from Marama’s nest (and the nest itself) were located on Pukenui island where the disease was not detected (though the infectious Aspergillus strain was present) and were included in this analysis given previous evidence that island location had no significant effect on bacterial community composition in either young or adult kākāpō (Perry et al. Citation2017; West et al. Citation2022). All other samples were collected from Whenua Hou as this was the only site of infection. Where a faecal sample could not be attributed to a single chick in a nest of multiple kākāpō chicks, all chicks were listed for that sample, hereafter referred to as a ‘pooled sample’. Metadata collected for these samples included hatch date, date of sample collection, location, disease status, and whether faeces were removed from nests (historically faeces were removed from nests for hygiene purposes, however a trial was conducted during the 2019 breeding season to test the impact of this management practice; West et al. Citation2022). We also collected information regarding nest type; female kākāpō nest on the ground in hollow trees or small caves made by rocks and roots. Nest types observed in this study include tree hollows, holes within a log, cavity behind a large rock, reconstructed A-frame nests, and one nest found between two gahnia bushes (‘Open’). The A-frame nest type represents nests that were reconstructed by NZDOC staff into an A-Frame as the original (natural) nest provided unideal shelter for chicks and/or limited monitoring access for staff. All but one chick sampled in this study were hatched in a hand-rearing facility where they were provided the commercial feeding formula ‘Kaytee exact Hand Feeding’ (Kaytee, Wisconsin). Chicks initially hatched in hand-rearing were then assigned and transferred out to nests (not necessarily that of their biological mother) with 1–3 kākāpō chicks occupying a given nest. In response to sub-optimal weight gain or failing health, chicks were often moved among nests until a suitable adoptive mother was identified, which we report here as ‘chick movement’ (Supplementary Table 1).
DNA extraction, PCR and ITS2 sequencing
DNA was extracted from samples using an in-house bead beating, chloroform protocol as outlined in West et al. (Citation2022). The ITS2 genomic region was amplified using a KAPA3G Plant PCR kit (Sigma-Aldrich, New Zealand) with ITS3Bmix1–5 forward primers (Nextera adaptor: TCG TCG GCA GCG TCA GAT GTG TAT AAG AGA CAG, ITS3B_1: CAT CGA TGA AGA ACG CAG, ITS3B_2: CAA CGA TGA AGA ACG CAG, ITS3B_3: CAC CGA TGA AGA ACG CAG, ITS3B_4: CAT CGA TGA AGA ACG TAG, ITS3B_5: CAT CGA TGA AGA ACG TGG) and the ITS4ngs reverse primer (GTC TCG TGG GCT CGG AGA TGT GTA TAA GAG ACA GTC CTC CGC TTA TTG ATA TGC; Nextera adaptor underlined) (Tedersoo et al. Citation2014, Citation2015; Hoggard et al. Citation2018). PCR amplification conditions were initial denaturation at 95 °C for 3 min, followed by 35 cycles of denaturation at 95 °C for 20 s, annealing at 57 °C for 15 s, and extension at 72 °C for 30 s followed by final elongation at 72 °C for 1 min. Amplicon size and absence of a band for negative controls (DNA extraction and PCR blanks) were verified on a 1% agarose gel with SYBR Safe DNA Gel Stain (Invitrogen, New Zealand). Samples that could not be amplified after serial dilutions were further cleaned using the Zymo OneStep PCR Inhibitor Removal kit (Ngaio Diagnostics Ltd., New Zealand). PCR products were purified using Zymo ZR-96 DNA Clean-Up Kits (Ngaio Diagnostics Ltd., New Zealand) and DNA concentration was quantified with the Qubit High Sensitivity dsDNA kit (Invitrogen, New Zealand). Samples were normalised to 5 ng/µL for library preparation and sequencing by Auckland Genomics Ltd. on an Illumina MiSeq with 2 × 300 bp chemistry. Library preparations were conducted according to Illumina protocols. Barcodes were ligated by PCR with SuperFi Master Mix Taq (Thermofisher). Index primers were custom synthesised by Integrated DNA Technologies (New Zealand) based on Nextera designs.
Sequence data analysis
All raw paired-read ITS2 sequence data were processed in R (version 4.0.1; R Core Team Citation2019) using the DADA2 software package (version 1.16; Callahan et al. Citation2016). Primer regions were removed from forward and reverse reads using cutadapt (Martin Citation2011) as per the DADA2 ITS Pipeline Workflow (1.8; Callahan et al. Citation2016). Sequence reads were discarded where N > 0, Q < 2 or the number of expected errors exceeded 2 for forward and reverse reads. Short sequences <50 bp were also removed. The DADA2 error learning algorithm was then applied to the forward and reverse reads, which were subsequently dereplicated into unique sequences. The DADA2 core sample algorithm was applied to the dereplicated sequences which were merged thereafter to obtain the full denoised sequence. Sequence chimeras were excluded, and taxonomy then assigned using the UNITE Fungi reference database version 04.02.2020 (Abarenkov et al. Citation2020).
The resulting ASV table and taxonomic assignments were merged with corresponding metadata to create separate phyloseq objects for litter and faecal samples using the R (version 4.1.3; R Core Team Citation2022) package phyloseq (version 1.38.0; McMurdie and Holmes Citation2013). The ASV table was subsequently filtered to remove low-abundance ASVs (total relative abundance <0.001%) and ASVs not assigned to phylum level. Samples were normalised by scaling with ranked subsampling (SRS; Beule and Karlovsky Citation2020). Faecal samples were subsampled to a minimum count of 500 reads and litter samples to 1600 reads. Correspondingly, 14 samples from the faecal dataset (three pooled, see Methods) and four samples from the litter dataset (18 in total) were discarded as total read count did not meet these thresholds. ASVs are numbered separately for faecal and litter data in decreasing order of their relative sequence abundance in that data set, and thus will differ between the two.
Observed richness and Inverse Simpson alpha-diversity indices were calculated by applying phyloseq’s estimate_richness function to the normalised data. Overall associations between alpha-diversity indices and metadata covariates were analysed using Kruskal–Wallis tests (based on data normality with Shapiro–Wilk testing; vegan package 2.5–7; Oksanen et al. Citation2020). Significant covariates were subsequently included as random factors, as well as controlling for repeated sampling within chicks and nests, for standard and generalised linear mixed modelling (lmm and glmm, respectively; lme4 package version 1.1–28; Bates et al. Citation2015), using likelihood ratio testing to assess the significance of mixed models. Post-hoc pairwise comparisons were performed using Dunn’s tests (dunn.test package version 1.3.5; Dinno Citation2017) with Benjamini-Hochberg p-value correction (Benjamini and Hochberg Citation1995) for significant models. We further tested the effect of age and location on the log ratio-transformed relative sequence abundance of dominant fungal genera in faecal samples using linear mixed models, controlling for variation among chicks, chick age and location with the lme4 package.
To explore variation in fungal communities among samples grouped by significant covariates, the data were transformed to Bray–Curtis dissimilarity matrices then ordinated with principal coordinate analysis (PCoA) using the vegan package. We tested for significant associations between dissimilarity matrices and corresponding covariates using the PERMANOVA adonis2 function of the vegan package, where we controlled for variation with repeated sampling per chick or nest. Significant PERMANOVA models were further subjected to pairwise comparison testing using a modified version of the pairwise.adonis2 function in the pairwiseAdonis package (version 0.4; Martinez Arbizu Citation2020) where we similarly controlled for variation with repeated sampling. We used the vegan functions betadisper and permutest to test for homogeneous group dispersion.
Finally, we created a separate taxonomic level which concatenated genus- and species-level assignments together and agglomerated the phyloseq object to this taxonomy group. The plyr package (version 1.8.7; Wickham Citation2011) was then employed to group less abundant ASVs into the category ‘Others’ based on a per-species mean relative abundance of <0.3%, and the data were plotted against chick age or ‘days since first chick’ for faecal and litter samples respectively. The phyloseq plot_heatmap function was then used to investigate how the relative sequence abundance of the 20 most abundant ASVs differed by time and location.
All data were visualised using the R packages ggplot2 (version 3.3.5; Wickham Citation2016), ggpubr (version 0.4.0; Kassambara Citation2020), cowplot (version 1.1.1; Wilke Citation2020), and Manu (‘kākāpō’ colour palette specifically designed on the colours of the kākāpō; version 0.0.1; Ram et al. Citation2018; Thomson Citation2020).
Results
Fungal diversity of faecal and litter samples
The total number of raw forward and reverse reads obtained from MiSeq sequencing was 14,542,340. Following quality filtering, denoising, and chimera exclusion, 2,044,346 merged sequence reads were obtained for taxonomic assignment. Only 7% of reads could not be assigned to a known fungal phylum. Average sequencing depth across all samples was 11,294.73 ± 11,353.32 (S.D.) reads. Overall, 1,303 and 1,008 unique fungal taxa were identified across the subsampled 108 faecal samples and 51 litter samples, respectively. The number of amplicon sequence variants (ASVs) per sample ranged from 2 to 175 across all samples, with an average of 30 ASVs for faecal samples and 68 ASVs for litter samples.
Ascomycota and Basidiomycota were the most abundant fungal phyla in both faecal and litter samples (). Within these phyla, the majority of sequences in both sample types were assigned to the classes Saccharomycetes and Tremellomycetes (). In matching descending order, the most prevalent ASVs in faecal samples were also the three most abundant. By contrast, the first, second and sixth ASVs were the most prevalent in litter samples, with L-ASV2 present in 100% of samples versus the 96.1% prevalence observed for L-ASV1 (). L-ASV3 is a member of the order Saccharomycetales that was present in only 51% of litter samples despite being the third most abundant ASV. An NCBI BLAST search of L-ASV3 confirmed its Saccharomycetales assignment but could only match the unique sequence to 84.39% sequence identity with a strain of Clavispora reshetovae. This ASV was also present in faecal samples as the fourth most abundant taxon (F-ASV4). L-ASV2_Apiotrichum unclassified and F-ASV3_Apiotrichum unclassified in litter and faecal samples, respectively, exhibit 100% sequence identity across the sequenced ITS2 fragment, as do L-ASV1_Debaryomyces hansenii and F_ASV2_Debaryomyces hansenii (litter and faecal, respectively). Reads that could not be taxonomically assigned at genus level represented 20.3% of faecal sample sequences and 18.8% of litter sample sequences.
Table 1. Relative ITS2 sequence abundance of the most abundant and prevalent fungi in faecal and litter samples.
Variation within the fungal biota: influence of faecal removal, aspergillosis and nest location
Removing faecal material from nests did not significantly alter the fungal community in either faecal or litter samples, and nor did chick movement (movement of chicks among nests by NZDOC staff; Supplementary Figure 1; ; Supplementary Table 2), though samples from chicks that were moved had significantly lower dispersion (Supplementary Table 3). Aspergillosis infection also had no significant effect on fungal diversity or richness of either kākāpō chick faeces or nest litter (A and C; ; Supplementary Table 2).
Figure 1. Alpha-diversity indices for kākāpō chick faecal samples grouped by A, aspergillosis and B, location, and for litter samples by C, aspergillosis and D, location. Boxes represent the median (within-box horizontal line), 25th (lower hinge) and 75th (upper hinge) percentiles. Whiskers extend to the smallest and largest values within 1.5 times interquartile range above the 25th and 75th percentiles, respectively. Outliers are excluded in the box-plots for Inverse Simpson diversity in panels C and D.
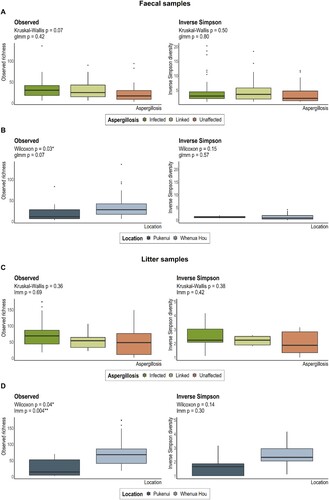
Table 2. Statistical outputs for alpha- and beta-diversity measures tested against covariates using Kruskal-Wallis (^ = Wilcoxon) tests and PERMANOVA analyses.
We did, however, identify a significant association between fungal richness and location for litter samples (B and D; ; Supplementary Table 4), though this observation may reflect Pukenui’s substantially smaller sample size (Supplementary Table 1). Under glmm, location was no longer a significant effect for faecal sample mycobiota richness that was initially observed with Wilcoxon testing (Supplementary Table 2). However, faecal samples from Pukenui largely promoted fungal community separation along the second PCoA ordination axis (A). These Pukenui-origin samples exhibited a greater abundance of F-ASV4 (an unclassified member of the Saccharomycetales order; D) and hosted several other ASVs not present in chick faeces from Whenua Hou (Supplementary Figure 2A). Similarly, the third most abundant ASV in litter samples (the same unclassified member of the Saccharomycetales order identified as F-ASV4 in faecal samples) was more abundant in Marama’s nest on Pukenui compared to nests on Whenua Hou (A and D; Supplementary Figure 2B). The absence of many ASVs from both faecal and litter samples collected from Pukenui may simply reflect the small sample size compared to Whenua Hou samples, as opposed to a biological effect.
Figure 2. Bray-Curtis dissimilarity distances based on ITS2 sequences for faecal samples visualised via principal coordinate analysis (PCoA) ordination. Each dot of the PCoA represents the mycobiota of a single kākāpō chick faecal sample. Samples are shaped by aspergillosis diagnosis and coloured by A, location, B, the relative abundance of F-ASV1 Kazachstania telluris, and C, chick age at sample. Panel D depicts the most influential ASV vectors plotted using the vegan::envfit function.
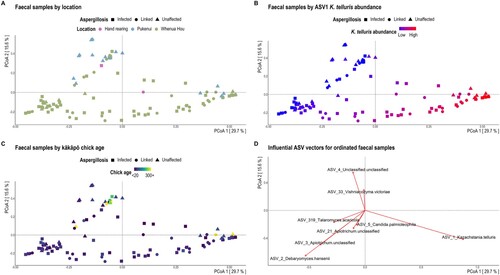
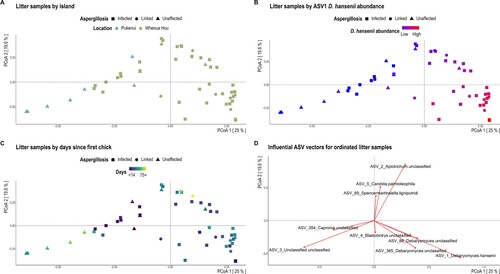
Figure 3. Bray-Curtis dissimilarity distances based on ITS2 sequences for litter samples visualised via principal coordinate analysis (PCoA) ordination. Each dot of the PCoA represents the mycobiota of a single litter sample. Samples are shaped by aspergillosis diagnosis and coloured by A, location, B, the relative abundance of L-ASV1 Debaryomyces hansenii, and C, the number of days since the sampled nest first housed a chick. Panel D depicts the most influential ASV vectors plotted using the vegan::envfit function.
Though faecal sample richness differed marginally by nest of residence with Kruskal–Wallis analysis, under glmm this observation was no longer significant (; Supplementary Figure 3; Supplementary Table 2). The alpha-diversity of litter samples was highly variable among nests (Supplementary Figure 4) but did not differ significantly according to Kruskal–Wallis or glmm analyses, likely as a result of highly uneven sample sizes (Supplementary Table 1). Overall, nest type was not significantly associated with mycobiota variation among chicks or nests (; Supplementary Table 2). However, faecal samples exhibited significant heterogeneous dispersion whereby chicks in the Open nest had the lowest dispersion (again likely due to low sample numbers; Supplementary Table 3).
Variation of the mycobiota over time
There was strong evidence for a shift in the faecal mycobiota with kākāpō chick age for both alpha- and beta-diversity (; ; Supplementary Table 2). Indeed, age was the only covariate to be significantly associated with fungal beta-diversity in kākāpō chicks (). Faecal fungal richness generally decreased with age until chicks were 200 + d old (B). Inverse Simpson diversity was markedly increased in sub-adult samples (C), where the mycobiota was often dominated by less abundant species (<0.3% abundance across the dataset; A). Overall diversity of the sub-adult faecal mycobiota was substantially greater than that of all other age categories (A; Supplementary Table 3) and included samples from all three kākāpō based on Pukenui and 10 from Whenua Hou. Of the 20 most abundant ASVs found across faecal samples, sub-adult samples notably lacked F-ASV4 (an unclassified Saccharomycetales), F-ASV10_Blastobotrys unclassified, F-ASV15 (an unclassified Ascomycota), F-ASV18_Geomyces auratus and F-ASV20_Penicillium spinulosum that were found at relatively high sequence abundance in all other age groups (Supplementary Figure 5A). Sub-adults also hosted two abundant ASVs that were absent from all other faecal samples: F-ASV14_Thelebolus globosus and F-ASV17_Mycena flos-nivium.
Figure 4. A, ITS2 sequence-based taxonomic distribution of fungi within age groups and individual kākāpō chick faecal samples at species level. Bars on the aggregated graph (left) are in the same order as the sample-level profile age groups from left to right. Individual samples are ordered within age groups chronologically and alphabetically. Taxa with mean relative ITS2 sequence abundance <0.3% are grouped as ‘Other species’. B, Observed richness and C, Inverse Simpson alpha-diversity indices for kākāpō chick faecal samples grouped by chick age. The bar plots in panels B and C demonstrate the variation of alpha diversity within each age group, while overall diversity per age group is reflected in the box plots on the left. The y-axes for corresponding bar- and box-plots are identical. Significant Dunn’s test pairwise comparisons with Benjamini-Hochberg adjustment between age groups in the box-plots are denoted by asterisks (P < 0.05 = *, P < 0.01 = **, P < 0.001 = ***). Box-plot details are as described for ; data beyond the end of the whiskers are outlying points and plotted individually.
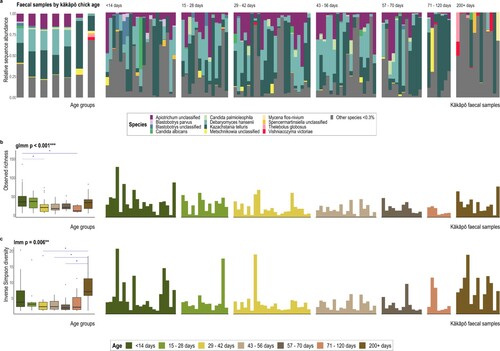
Kazachstania telluris was particularly abundant in all age groups where it sometimes dominated the community (A) and drove much of the fungal community separation along the first PCoA ordination axis in B. Where K. telluris did not dominate a given faecal sample we typically found an increased relative abundance of both Debaryomyces hansenii and Apiotrichum species in younger chicks that was not evident in sub-adults (D and A). Correspondingly, the relative abundance of both Debaryomyces (χ2 = 36.35, P < 0.001) and Apiotrichum (χ2 = 27.18, P = 0.003) significantly decreased with chick age under linear mixed modelling (Supplementary Table 5). The relative abundances of all three genera were significantly decreased in sub-adult samples (Supplementary Table 5).
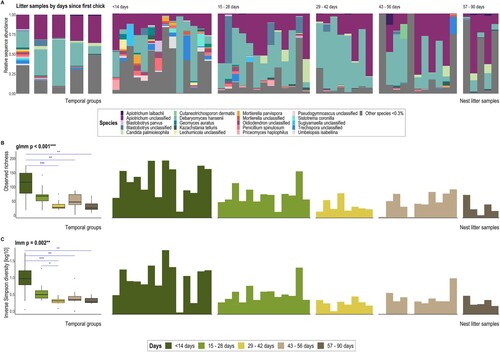
The fungal biota of litter samples similarly changed over time, with a significant reduction in both species richness and Inverse Simpson diversity since the introduction of a kākāpō chick (A–C; ; Supplementary Table 3). Again, time was the only covariate significantly associated with fungal beta-diversity in litter samples (). Samples collected from nests within the first month following chick introduction had significantly greater richness and diversity than subsequent age groups (A; Supplementary Table 3). The relative abundance of most Apiotrichum spp. was generally conserved across age groups (Supplementary Figure 5B), while the relative abundance of D. hansenii initially increased between 15–42 d but was least abundant in the 57–90 d group (though this last observation may reflect the smaller sample size of this group) (A). While fungal communities did not cluster well by temporal collection with PCoA ordination (C), litter samples from Marama’s nest on Pukenui are separated from most other fungal communities along the first axis (A). Separation of fungal communities along the first PCoA axis was largely driven by the relative abundance of L-ASV1_Debaryomyces hansenii (B). By contrast, the relative abundance of L-ASV2_Apiotrichum unclassified and L-ASV5_Candida palmioleophila facilitated community separation along the second ordination axis (D).
Figure 5. A, ITS2 sequence-based taxonomic distribution of fungi by days since the nest sampled first housed a chick and individual nest litter samples at species level. Bars on the aggregated graph (left) are in the same order as the sample-level profile groups from left to right. Individual samples are ordered within groups chronologically and alphabetically. Taxa with mean relative ITS2 sequence abundance <0.3% are grouped as ‘Other species’. B, Observed richness and C, Inverse Simpson (plotted on a log10 scale) alpha-diversity indices for litter samples grouped by days since first chick occupancy for a given nest. The bar plots in panels B and C demonstrate the variation of alpha diversity within each age group, while overall diversity per age group is reflected in the box plots on the left. The y-axes for corresponding bar- and box-plots are identical. Significant Dunn’s test (with Benjamini-Hochberg adjustment) pairwise comparisons between groups in the box-plots are denoted by asterisks P < 0.05 = *, P < 0.01 = **, P < 0.001 = ***. Box-plot details are as described for ; data beyond the end of the whiskers are outlying points and plotted individually.
Discussion
The 2019 aspergillosis outbreak dealt a blow to the kākāpō population in the midst of an otherwise record high breeding season. Birds are particularly susceptible to infection by the opportunistic pathogen Aspergillus, especially young and immunocompromised individuals, which can cause high mortality rates. Ongoing research aims to determine why the disease outbreak only occurred on Whenua Hou, and not Pukenui, during the 2019 breeding season as well as other factors that may have contributed to aspergillosis pathogenesis. Fortunately, the collection of faecal and litter samples throughout the 2019 breeding season for our study on the influence of conservation practices on the bacterial biota (West et al. Citation2022) has enabled us to explore the gut mycobiota of infected and unaffected chicks and their nest mycobiota. We found no evidence that aspergillosis infection significantly influenced, or was influenced by, the mycobiota composition of faecal or nest samples. Aspergillus spp. were also barely present in our data set (195 total reads found across a limited number of infected chicks and unaffected nest samples before SRS normalisation) despite being identified in affected nests by other groups of the Kākāpō Aspergillosis Research Consortium using cultivation-dependent and microscopy techniques (unpublished data). Though we successfully tested our DNA extraction method on Aspergillus sp. isolates, and previous work suggests the selected primers are suitable for the amplification of Aspergillus DNA (Hoggard et al. Citation2018), we can only assume that directly extracting, amplifying and sequencing fungal DNA from our faecal and litter samples led to a bias against obtaining Aspergillus sp. sequences. Another Consortium group had similar issues obtaining Aspergillus DNA from nest litter samples using different DNA extraction methods to ours, indicating that the problem does not solely originate from methodologies utilised in this study but may be more inherent to the processing of complex environmental samples. Though the apparent lack of Aspergillus within our dataset was somewhat surprising, we nonetheless found little evidence that the relative abundance of other fungal species was significantly altered by infection for either faecal or litter samples.
Removing faecal material from nests did not influence the gut mycobiota of chicks or the corresponding nest litter mycobiota. However, the faecal mycobiota did vary considerably with age and time for both chicks and nests, respectively. These results mirror our findings for bacteria (West et al. Citation2022) and suggest that temporal variability has the most pronounced effect on both the bacterial and fungal biotas of the juvenile kākāpō gut and corresponding nest environment.
Members of the Agaricomycetes macrofungi and yeast-forming Saccharomycetes and Tremellomycetes lineages dominate the mycobiota of kākāpō chick faecal samples. These fungi have been previously identified in the gut biota of other avian species (Spergser et al. Citation2018; Mahtab et al. Citation2021; San Juan et al. Citation2021; Xiang et al. Citation2021) and were also found in ancient kākāpō coprolites (ranging from 172–2,514 years old; Boast et al. Citation2018). Kākāpō are known to consume macrofungi on the islands they inhabit, which may explain the high relative abundance of Agaricomycetes in the gut community. Moreover, members of the Saccharomycetes class, such as Saccharomyces boulardii, are considered probiotic fungal species in humans and model animal species, promoting host immunity, pathogen defence, the growth of short-chain fatty acid-producing bacteria and the production of digestive enzymes (McFarland Citation2010; Moré and Swidsinski Citation2015). Tremellomycetes fungi range from edible Tremella fruiting bodies to pathogenic species such as Cryptococcus neoformans (Weiss et al. Citation2014). The most abundant species of Tremellomycetes in this study was an unclassified Apiotrichum sp. Apiotrichum, a ubiquitous environmental yeast, was highly abundant and prevalent in both faecal and litter samples. Four novel strains of Apiotrichum were recently described from bat guano in Japan (Takashima et al. Citation2020). Kazachstania telluris, of the Saccharomycetes class, dominated the faecal mycobiota in the current study and was also detected in 62.7% of litter samples. Kazachstania is a ubiquitous yeast that has been isolated from a variety of environments including water, soil, nasal passages in birds and the mammalian gastrointestinal tract (Kurtzman et al. Citation2005). Some species are known for their fermentative qualities (Jood et al. Citation2017; Morio et al. Citation2020), though members of the K. telluris complex are often considered pathogenic (Kurtzman et al. Citation2005). More recently, Kazachstania spp. were identified at high relative abundance and prevalence in the pig (Sus scrofa domesticus) and cynomolgus macaque (Macaca fascicularis) gut mycobiota (Ramayo-Caldas et al. Citation2020; James et al. Citation2022). Debaryomyces hansenii was the third most notable ASV present in both faecal and litter samples and also derives from the Saccharomycetes lineage. D. hansenii is a common mycotoxin-producing yeast often found on mold-ripened cheeses and sausages (Gori et al. Citation2012; Ramos-Moreno et al. Citation2021), but may also be implicated in bowel diseases such as Crohn’s disease (Desnos-Ollivier et al. Citation2008; Jain et al. Citation2021). In contradiction to its pathogenic potential, D. hansenii has also displayed several probiotic properties across a range of animal species, including immune system stimulation, digestive function and improved disease resistance (Angulo et al. Citation2020), suggesting this yeast may act as an opportunistic pathogen. Notably, D. hansenii is among the most abundant gut fungi in human infants up to three months old though it drastically decreases in abundance once the diet switches from milk to solid foods, whereupon S. cerevisiae becomes increasingly dominant (Wu et al. Citation2021). Further experiments would be necessary to determine the probiotic or pathogenic nature of these most abundant fungi found in the kākāpō gastrointestinal tract, though members of the Saccharomycetes lineage may be good probiotic candidates. Many ASVs in our current study could not be assigned to genus, and sometimes even to family. This observation was not unexpected given the relative lack of fungal studies compared to those exploring bacterial communities, especially in avian species.
Age substantially influences mycobiota composition in the human gastrointestinal tract (Strati et al. Citation2016), where fungal community diversity decreases with age. We observed a similar trend in sub-adult kākāpō, where fungal richness generally decreased but community evenness was significantly greater in comparison to younger chicks. The same observation was made in West et al. (Citation2022), where younger kākāpō chicks hosted a greater variety of bacteria not observed in the sub-adult gut, and this has also been reported for other avian species (van Dongen et al. Citation2013; Barbosa et al. Citation2016; Dewar et al. Citation2017; Grond et al. Citation2017; Kohl et al. Citation2018; Teyssier et al. Citation2018). Age-associated changes in mycobiota composition likely reflect an initial rapid colonisation of the gastrointestinal tract, particularly by environmental microorganisms, followed by a shift towards an oxygen-deprived environment in the intestine that favours anaerobic fungi (van Dongen et al. Citation2013; Teyssier et al. Citation2018; Ran et al. Citation2021). The decrease in faecal fungal richness, and concurrent increase in Inverse Simpson diversity, may also reflect changes in diet which can significantly influence the gut microbiota (Hoffmann et al. Citation2013; David et al. Citation2014). Young kākāpō are fed a mixture of rimu fruit and supplementary feed (Harrison’s High Potency Coarse pellets) by kākāpō mothers on both Pukenui and Whenua Hou before they are old enough to fledge (c.10 weeks) and subsequently consume a variety of seasonal plant material (Cottam et al. Citation2006; Waite et al. Citation2014). This change in diet over time may well underpin some of the changes observed in the gut mycobiota of kākāpō chicks as new fungal species are consumed and introduced to the gastrointestinal environment. Further studies would, however, be needed to confirm this speculative hypothesis.
The fungal richness and diversity of nest litter also decreased over time, likely in response to sustained chick residency. The presence of kākāpō chicks in the nest significantly altered the surrounding mycobiota, whereby the relative abundances of Apiotrichum sp. and Debaryomyces hansenii generally increased with longer nest occupancy. Litter samples collected after the first month following introduction of a chick were significantly less diverse, suggesting the presence of chicks encouraged the dominance of specific fungi at the expense of less abundant species. We observed similar results for the bacterial component of nests, indicating that microbial communities become significantly less diverse across multiple taxonomic kingdoms once kākāpō chicks occupy the nest (West et al. Citation2022).
Though we only included samples from one nest on Pukenui island, the fungal communities differed sufficiently to suggest that geography may influence the kākāpō gut mycobiota and nest litter environment. Both sample types hosted a significantly greater proportion of an unclassified ASV of the order Saccharomycetales compared to samples collected on Whenua Hou. By contrast, we repeatedly find that geography does not contribute to variation of the bacterial biota among kākāpō individuals (Waite et al. Citation2012, Citation2014; Perry et al. Citation2017; West et al. Citation2022). We opted to retain samples from Pukenui to maintain a healthy control cohort given the main aim of this study concerned the influence of aspergillosis infection, rather than location per se. Future studies of the kākāpō mycobiota should include sampling from all five islands currently inhabited by kākāpō to better understand the variation in fungal communities observed in this study. It is also of interest to consider the extent to which members of the mycobiota are dispersed between chicks (e.g. via faeces) and between nests (e.g. via interactions with litter and/or food). As well as likely acquiring new fungal types from their environment, the chicks themselves may leave their own microbial ‘signature’ on the local environment via shedding cells in faecal matter.
Concluding remarks
For the first time we report the fungal diversity of kākāpō chick faeces and corresponding nest litter samples. The primary aim of our study was to investigate whether the kākāpō chick gut mycobiota was significantly influenced by aspergillosis infection during the 2019 breeding season. There was no evidence that aspergillosis significantly altered the mycobiota of faecal or litter samples, though fungal community richness was slightly elevated in infected chicks and nests. While fungal community membership was not significantly altered by infection, we cannot assume that community function remained similarly unchanged. We recommend future studies incorporate metatranscriptomic and metabolomic methodology to complement the discoveries reported here. We did, however, find considerable evidence that age and chick occupancy significantly influence the mycobiota of chicks and nests over time, respectively. These observations mirror those found for the bacterial biota of kākāpō chicks and nests, with both fungal and bacterial diversity decreasing over time.
Supplemental material 2
Download MS Excel (24.1 KB)Supplemental material 1
Download MS Word (1.1 MB)Acknowledgements
We would like to thank all Department of Conservation (Te Papa Atawhai) staff and volunteers associated with the collection of hundreds of faecal and litter samples for this study. AGW was supported by the New Zealand Department of Conservation (Te Papa Atawhai), Graduate Women New Zealand, the Todd Foundation and the Kate Edger Educational Charitable Trust. The authors also wish to acknowledge the use of New Zealand eScience Infrastructure (NeSI) high performance computing facilities, consulting support and training services as part of this research. New Zealand’s national facilities are provided by NeSI and funded jointly by NeSI’s collaborator institutions and through the Ministry of Business, Innovation and Employment’s Research Infrastructure programme (https://www.nesi.org.nz). MWT and AD conceived the experiment and designed the study with AGW. AD and KRT coordinated and collected samples, and AGW conducted all laboratory work and sequence data analyses and wrote the manuscript. All authors reviewed the manuscript.
Kākāpō Aspergillosis Research Consortium members:
Andrew Digby1, Doug Armstrong2, Darius Armstrong-James3, Mike Bromley4, Elizabeth Buckley5, James Chatterton6, Murray P. Cox2, Robert A. Cramer7, Jodie Crane1, Peter K. Dearden8, Daryl Eason1, Matthew C. Fisher3, Sara Gago4, Brett Gartrell9, Neil J. Gemmell10, Travis R. Glare11, Joseph Guhlin10, Jason Howard12, Donnabella Lacap-Bugler5, Marissa Le Lec10, Xiao Xiao Lin2, Lotus Lofgren13, John Mackay14, Jacques Meis15, Kaesi A. Morelli7, John Perrott5, Megan Petterson16, Miguel Quinones-Mateu17, Johanna Rhodes3, Joanna Roberts18, Jason Stajich13, Michael W. Taylor19, Scott J. Tebbutt20, Amber Truter-Meyer5, Lydia Uddstrom1, Lara Urban10, Norman van Rhijn4, Deidre Vercoe1, Elisa Vesely7, Bevan S. Weir16, Annie G. West19, David J. Winter21, Juliana Yeung22
1Kākāpō Recovery Team, Department of Conservation, New Zealand
2School of Natural Sciences, Massey University, New Zealand
3Faculty of Medicine, Imperial College London, United Kingdom
4School of Biological Sciences, The University of Manchester, United Kingdom
5School of Science, Auckland University of Technology, New Zealand
6Auckland Zoo, New Zealand
7Geisel School of Medicine, Dartmouth College, New Hampshire, United States of America
8Department of Biochemistry, The University of Otago, New Zealand
9Wildbase Research Centre, Massey University, New Zealand
10Department of Anatomy, The University of Otago, New Zealand
11Bio-Protection Research Centre, Lincoln University, New Zealand
12Novogene, North Carolina, United States of America
13Microbiology and Plant Pathology, University of California, Riverside, United States of America
14dnature diagnostics and research, New Zealand
15Canisius Wilhelmina Hospital, Department of Medical Microbiology and Infectious Diseases Nijmegen, the Netherlands
16Manaaki Whenua Landcare Research, New Zealand
17Department of Microbiology and Immunology, The University of Otago, New Zealand
18Flowjoanna, Palmerston North, New Zealand
19School of Biological Sciences, The University of Auckland, New Zealand
20Department of Medicine, The University of British Columbia, Canada
21School of Fundamental Sciences, Massey University, New Zealand
22AgResearch, New Zealand
Disclosure statement
No potential conflict of interest was reported by the author(s).
Data availability statement
The raw sequence data are available in the NCBI SRA repository, under Bioproject accession number PRJNA818327. Metadata have been included as Additional file 2. Statistical analyses are available in an R markdown file published on GitHub: https://github.com/anniewest/The-mycobiota-of-faeces-from-the-critically-endangered-kakapo-and-associated-nest-litter.
Additional information
Funding
References
- Abarenkov K, Zirk A, Piirmann T, Pöhönen R, Ivanov F, Nilsson RH, Kõljalg U.. 2020. UNITE general FASTA release for fungi. Version 04.02.2020. UNITE Community. doi:10.15156/BIO/786369
- Angulo M, Reyes-Becerril M, Medina-Córdova N, Tovar-Ramírez D, Angulo C. 2020. Probiotic and nutritional effects of Debaryomyces hansenii on animals. Appl Microbiol Biotechnol. 104(18):7689–7699. doi:10.1007/s00253-020-10780-z.
- Arné P, Risco-Castillo V, Jouvion G, Barzic CL, Guillot J. 2021. Aspergillosis in wild birds. Journal of Fungi. 7:241. doi:10.3390/jof7030241.
- Barbosa A, Balagué V, Valera F, Martı́nez A, Benzal J, Motas M, Diaz JI, Mira A, Pedrós-Alió C. 2016. Age-related differences in the gastrointestinal microbiota of chinstrap penguins (Pygoscelis antarctica). PLoS One. 11:e0153215. doi:10.1371/journal.pone.0153215.
- Bates D, Mächler M, Bolker B, Walker S. 2015. Fitting linear mixed-effects models using lme4. Journal of Statistical Software. 67:1–48. doi:10.18637/jss.v067.i01.
- Bates KA, Shelton JMG, Mercier VL, Hopkins KP, Harrison XA, Petrovan SO, Fisher MC. 2019. Captivity and infection by the fungal pathogen Batrachochytrium salamandrivorans Perturb the amphibian skin microbiome. Front Microbiol. 10:1834. doi:10.3389/fmicb.2019.01834.
- Beernaert LA, Pasmans F, Waeyenberghe LV, Haesebrouck F, Martel A. 2010. Aspergillus infections in birds: a review. Avian Pathology. 39:325–331. doi:10.1080/03079457.2010.506210.
- Benjamini Y, Hochberg Y. 1995. Controlling the false discovery rate: a practical and powerful approach to multiple testing. Journal of the Royal Statistical Society: Series B (Methodological). 57:289–300. doi:10.1111/j.2517-6161.1995.tb02031.x.
- Beule L, Karlovsky P. 2020. Improved normalization of species count data in ecology by scaling with ranked subsampling (SRS): application to microbial communities. PeerJ. 8:e9593. doi:10.7717/peerj.9593.
- Boast AP, Weyrich LS, Wood JR, Metcalf JL, Knight R, Cooper A. 2018. Coprolites reveal ecological interactions lost with the extinction of New Zealand birds. Proceedings of the National Academy of Sciences. 115:1546–1551. doi:10.1073/pnas.1712337115.
- Callahan BJ, McMurdie PJ, Rosen MJ, Han AW, Johnson AJA, Holmes SP. 2016. DADA2: High-resolution sample inference from Illumina amplicon data. Nature Methods. 13:581–583. doi:10.1038/nmeth.3869.
- Cottam Y, Merton DV, Hendriks W. 2006. Nutrient composition of the diet of parent-raised kakapo nestlings. Notornis. 1:90–99.
- David LA, Maurice CF, Carmody RN. 2014. Diet rapidly and reproducibly alters the human gut microbiome. Nature. 505:59–563. doi:10.1038/nature12820.
- Desnos-Ollivier M, Ragon M, Robert V, Raoux D, Gantier JC, Dromer F. 2008. Debaryomyces hansenii (Candida famata), a rare human fungal pathogen often misidentified as Pichia guilliermondii (Candida guilliermondii). J Clin Microbiol. 46(10):3237–3242. doi:10.1128/JCM.01451-08.
- Dewar ML, Arnould JPY, Allnutt TR, Crowley T, Krause L, Reynolds J, Dann P, Smith SC. 2017. Microbiota of little penguins and short-tailed shearwaters during development. PLoS One. 12:e0183117. doi:10.1371/journal.pone.0183117.
- Dinno A. 2017. dunn.test: Dunn’s test of multiple comparisons using rank sums.
- Dollive S, Chen YY, Grunberg S, Bittinger K, Hoffmann C, Vandivier L, Cuff C, Lewis JD, Wu GD, Bushman FD. 2013. Fungi of the murine gut: episodic variation and proliferation during antibiotic treatment. PLoS One. 8(8):e71806. doi:10.1371/journal.pone.0071806.
- Gori K, Sørensen LM, Petersen MA, Jespersen L, Arneborg N. 2012. Debaryomyces hansenii strains differ in their production of flavor compounds in a cheese-surface model. Microbiologyopen. 1(2):161–168. doi:10.1002/mbo3.11.
- Grond K, Lanctot RB, Jumpponen A, Sandercock BK. 2017. Recruitment and establishment of the gut microbiome in Arctic shorebirds. FEMS Microbiology Ecology. 93. doi:10.1093/femsec/fix142
- Herman RA. 2020. Increasing allergy: are antibiotics the elephant in the room? Allergy, Asthma and Clinical Immunology. 16:35. doi:10.1186/s13223-020-00432-2.
- Hoffmann C, Dollive S, Grunberg S, Chen J, Li H, Wu GD, Lewis JD, Bushman FD. 2013. Archaea and fungi of the human gut microbiome: correlations with diet and bacterial residents. PLoS One. 8:e66019. doi:10.1371/journal.pone.0066019.
- Hoggard M, Vesty A, Wong G, Montgomery JM, Fourie C, Douglas RG, Biswas K, Taylor MW. 2018. Characterizing the human mycobiota: a comparison of small subunit rRNA, ITS1, ITS2, and large subunit rRNA genomic targets. Frontiers in Microbiology. 9:2208. doi:10.3389/fmicb.2018.02208.
- Iliev ID, Leonardi I. 2017. Fungal dysbiosis: immunity and interactions at mucosal barriers. Nature Reviews Immunology. 17:635–646. doi:10.1038/nri.2017.55.
- Jain U, Ver Heul AM, Xiong S, Gregory MH, Demers EG, Kern JT, Lai CW, Muegge BD, Barisas DAG, Leal-Ekman JS, et al. 2021. Debaryomyces is enriched in Crohn’s disease intestinal tissue and impairs healing in mice. Science. 371(6534):1154–1159. doi:10.1126/science.abd0919.
- James SA, Parker A, Purse C, Telatin A, Baker D, Holmes S, Durham J, Funnell SGP, Carding SR. 2022. The cynomolgus macaque intestinal mycobiome is dominated by the Kazachstania genus and K. pintolopesii species. J Fungi (Basel). 8(10):1054. doi:doi:10.3390/jof8101054.
- Jani AJ, Briggs CJ. 2014. The pathogen Batrachochytrium dendrobatidis disturbs the frog skin microbiome during a natural epidemic and experimental infection. Proc Natl Acad Sci U S A. 111(47):E5049–E5058. doi:10.1073/pnas.1412752111.
- Jani AJ, Bushell J, Arisdakessian CG, Belcaid M, Boiano DM, Brown C, Knapp RA. 2021. The amphibian microbiome exhibits poor resilience following pathogen-induced disturbance. ISME J. 15(6):1628–1640. doi:10.1038/s41396-020-00875-w.
- Jood I, Hoff JW, Setati ME. 2017. Evaluating fermentation characteristics of Kazachstania spp. and their potential influence on wine quality. World Journal of Microbiology and Biotechnology. 33:129. doi:10.1007/s11274-017-2299-1.
- Kassambara A. 2020. ggpubr: ‘ggplot2’ based publication ready plots.
- Kohl KD, Brun A, Caviedes-Vidal E, Karasov WH. 2018. Age-related changes in the gut microbiota of wild House Sparrow nestlings. Ibis. 161:184–191. doi:10.1111/ibi.12618.
- Kong HH, Oh J, Deming C, Conlan S, Grice EA, Beatson MA, Nomicos E, Polley EC, Komarow HD, NISC Comparative Sequence Program, et al. 2012. Temporal shifts in the skin microbiome associated with disease flares and treatment in children with atopic dermatitis. Genome Res. 22(5):850–859. doi:10.1101/gr.131029.111.
- Kurtzman CP, Robnett CJ, Ward JM, Brayton C, Gorelick P, Walsh TJ. 2005. Multigene phylogenetic analysis of pathogenic Candida species in the Kazachstania (Arxiozyma) telluris complex and description of their ascosporic states as Kazachstania bovina sp. nov., K. pintolopesii sp. nov., K. heterogenica sp. nov., and K. slooffiae sp. nov. Journal of Clinical Microbiology. 43:101–111. doi:10.1128/JCM.43.1.101-111.2005.
- Leishangthem GD, Singh ND, Brar RS, Banga HS. 2015. Aspergillosis in avian species: a review. Journal of Poultry Science and Technology. 3:1–14.
- Lewis JD, Chen EZ, Baldassano RN. 2015. Inflammation, antibiotics, and diet as environmental stressors of the gut microbiome in pediatric Crohn’s disease. Cell Host and Microbe. 18:489–500. doi:10.1016/j.chom.2015.09.008.
- Liguori G, Lamas B, Richard ML. 2015. Fungal dysbiosis in mucosa-associated microbiota of Crohn’s disease patients. Journal of Crohn’s and Colitis. 10:296–305. doi:10.1093/ecco-jcc/jjv209.
- Liu G, Xu N, Feng J, Gong Z. 2022a. Variations in gut fungal communities between Anser erythropus Wintering at Shengjin and Caizi Lakes,China. PREPRINT (Version 1) available at Research Square. doi:10.21203/rs.3.rs-1467265/v1.
- Liu NN, Zhao X, Tan JC, Liu S, Li BW, Xu WX, Peng L, Gu P, Li W, Shapiro R, et al. 2022b. Mycobiome dysbiosis in women with intrauterine adhesions. Microbiol Spectr. 10(4):e0132422. doi:10.1128/spectrum.01324-22.
- Lofgren LA, Lorch JM, Cramer RA, Blehert DS, Berlowski-Zier BM, Winzeler ME, Gutierrez-Perez C, Kordana NE, Stajich JE. 2022. Avian-associated Aspergillus fumigatus displays broad phylogenetic distribution, no evidence for host specificity, and multiple genotypes within epizootic events. G3 Genes|Genomes|Genetics. 12. doi:10.1093/g3journal/jkac075
- Love BL, Mann JR, Hardin JW, Lu ZK, Cox C, Amrol DJ. 2016. Antibiotic prescription and food allergy in young children. Allergy, Asthma and Clinical Immunology. 12:1–8. doi:10.1186/s13223-016-0148-7.
- Mahtab N, Zhou L, Zhang F, Wang W. 2021. Seasonal variations in the gut fungal communities of hooded crane (Grus monacha) at wintering and stopover sites in China. Animals. 11:941. doi:10.3390/ani11040941.
- Martin M. 2011. Cutadapt removes adapter sequences from high-throughput sequencing reads. EMBnetjournal. 17:10–12. doi:10.14806/ej.17.1.200.
- Martinez Arbizu P. 2020. pairwiseAdonis: pairwise multilevel comparison using adonis.
- McFarland LV. 2010. Systematic review and meta-analysis of Saccharomyces boulardii in adult patients. World J Gastroenterol. 16(18):2202–2222. doi:10.3748/wjg.v16.i18.2202.
- McMurdie PJ, Holmes S. 2013. . phyloseq: an R package for reproducible interactive analysis and graphics of microbiome census data. PLoS One. 8:e61217. doi:10.1371/journal.pone.0061217.
- Melo AM, Stevens DA, Tell LA, Veríssimo C, Sabino R, Xavier MO. 2020. Aspergillosis, avian species and the one health perspective: the possible importance of birds in azole resistance. Microorganisms. 8:2037. doi:10.3390/microorganisms8122037.
- Mishra K, Bukavina L, Ghannoum M. 2021. Symbiosis and dysbiosis of the human mycobiome. Front Microbiol. 12:636131. doi:10.3389/fmicb.2021.636131.
- Moré MI, Swidsinski A. 2015. Saccharomyces boulardii CNCM I-745 supports regeneration of the intestinal microbiota after diarrheic dysbiosis – a review. Clin Exp Gastroenterol. 8:237–255. doi:10.2147/CEG.S85574.
- Morio F, O’Brien CE, Butler G. 2020. Draft genome sequence of the yeast Kazachstania telluris CBS 16338 isolated from forest soil in Ireland. Mycopathologia. 185:587–590. doi:10.1007/s11046-020-00449-6.
- Moustafa MAM, Chel HM, Thu MJ, Bawm S, Htun LL, Win MM, Oo ZM, Ohsawa N, Lahdenperä M, Mohamed WMA, et al. 2021. Anthropogenic interferences lead to gut microbiome dysbiosis in Asian elephants and may alter adaptation processes to surrounding environments. Sci Rep. 11(1):741. doi:10.1038/s41598-020-80537-1.
- Oksanen J, Blanchet FG, Friendly M. 2020. vegan: Community ecology package.
- Padakandla SR, Das T, Sai Prashanthi G, Angadi KK, Reddy SS, Reddy GB, Shivaji S. 2022. Gut mycobiome dysbiosis in rats showing retinal changes indicative of diabetic retinopathy. PLoS One. 17(4):e0267080. doi:10.1371/journal.pone.0267080.
- Perry EK, Digby A, Taylor MW. 2017. The low-diversity fecal microbiota of the critically endangered kākāpō is robust to anthropogenic dietary and geographic influences. Frontiers in Microbiology. 8:2033. doi:10.3389/fmicb.2017.02033.
- Pilla R, Suchodolski JS. 2020. The role of the canine gut microbiome and metabolome in health and gastrointestinal disease. Front Vet Sci. 6:498. doi:10.3389/fvets.2019.00498.
- Powlesland R, Merton DV, Cockrem JF. 2006. A parrot apart: the natural history of the kakapo (Strigops habroptilus), and the context of its conservation management. Notornis. 53:3–26.
- Ram K, Wickham H, Richards C, Baggett A. 2018. A Wes Anderson palette generator.
- Ramayo-Caldas Y, Prenafeta-Boldú F, Zingaretti LM, Gonzalez-Rodriguez O, Dalmau A, Quintanilla R, Ballester M. 2020. Gut eukaryotic communities in pigs: diversity, composition and host genetics contribution. Animal Microbiome. 2:18. doi:10.1186/s42523-020-00038-4.
- Ramos-Moreno L, Ruiz-Pérez F, Rodríguez-Castro E, Ramos J. 2021. Debaryomyces hansenii is a real tool to improve a diversity of characteristics in sausages and dry-meat products. Microorganisms. 9(7):1512. doi:10.3390/microorganisms9071512.
- Ran J, Wan Q-H, Fang S-G. 2021. Gut microbiota of endangered crested ibis: establishment, diversity, and association with reproductive output. PLoS One. 16:e0250075. doi:10.1371/journal.pone.0250075.
- R Core Team. 2019. R: A language and environment for statistical computing.
- R Core Team. 2022. R: a language and environment for statistical computing.
- San Juan PA, Castro I, Dhami MK. 2021. Captivity reduces diversity and shifts composition of the brown kiwi microbiome. Animal Microbiome. 3:48. doi:10.1186/s42523-021-00109-0.
- Sawaswong V, Chanchaem P, Khamwut A, Praianantathavorn K, Kemthong T, Malaivijitnond S, Payungporn S. 2020. Oral-fecal mycobiome in wild and captive cynomolgus macaques (Macaca fascicularis). Fungal Genet Biol. 144:103468. doi:10.1016/j.fgb.2020.103468.
- Sokol H, Leducq V, Aschard H. 2017. Fungal microbiota dysbiosis in IBD. Gut. 66:1039–1048. doi:10.1136/gutjnl-2015-310746.
- Spergser J, Loncaric I, Tichy A, Fritz J, Scope A. 2018. The cultivable autochthonous microbiota of the critically endangered Northern bald ibis (Geronticus eremita). PLoS One. 13:e0195255. doi:doi:10.1371/journal.pone.0195255.
- Strati F, Paola MD, Stefanini I. 2016. Age and gender affect the composition of fungal population of the human gastrointestinal tract. Frontiers in Microbiology. 7. doi:10.3389/fmicb.2016.01227
- Sun B, Gu Z, Wang X, Huffman M, Garber P, Sheeran L, Zhang D, Zhu Y, Xia D-P, Li J-H. 2018. Season, age, and sex affect the fecal mycobiota of free-ranging Tibetan macaques (Macaca thibetana). Am J Primatol. 80:e22880. doi:10.1002/ajp.22880.
- Takashima M, Kurakado S, Cho O, Kikuchi K, Sugiyama J, Sugita T. 2020. Description of four Apiotrichum and two Cutaneotrichosporon species isolated from guano samples from bat-inhabited caves in Japan. International Journal of Systematic and Evolutionary Microbiology. 70:4458–4469. doi:10.1099/ijsem.0.004277.
- Tedersoo L, Anslan S, Bahram M. 2015. Shotgun metagenomes and multiple primer pair-barcode combinations of amplicons reveal biases in metabarcoding analyses of fungi. MycoKeys. 10:1–43. doi:10.3897/mycokeys.10.4852.
- Tedersoo L, Bahram M, Põlme S. 2014. Global diversity and geography of soil fungi. Science. 346:1256688. doi:10.1126/science.1256688.
- Tell LA. 2005. Aspergillosis in mammals and birds: impact on veterinary medicine. Medical Mycology. 43:S71–S73. doi:10.1080/13693780400020089.
- Teyssier A, Lens L, Matthysen E, White J. 2018. Dynamics of gut microbiota diversity during the early development of an avian host: evidence from a cross-foster experiment. Frontiers in Microbiology. 9:1524. doi:10.3389/fmicb.2018.01524.
- Thomson G. 2020. Manu: NZ bird colour palettes.
- van Dongen WFD, White J, Brandl HB, Moodley Y, Merkling T, Leclaire S, Blanchard P, Danchin É, Hatch SA, Wagner RH. 2013. Age-related differences in the cloacal microbiota of a wild bird species. BMC Ecology. 13:11. doi:10.1186/1472-6785-13-11.
- Vedova RD, Hevia A, Vivot W, Fernández J, Córdoba SB, Reynaldi FJ. 2019. Aspergillosis in domestic and wild birds from Argentina. Brazilian Journal of Veterinary Research and Animal Science. 56:e152460. doi:10.11606/issn.1678-4456.bjvras.2019.152460.
- Waite DW, Deines P, Taylor MW. 2012. Gut microbiome of the critically endangered New Zealand parrot, the kakapo (Strigops habroptilus). PLoS One. 7:e35803. doi:10.1371/journal.pone.0035803.
- Waite DW, Deines P, Taylor MW. 2013. Quantifying the impact of storage procedures for faecal bacteriotherapy in the critically endangered New Zealand parrot, the kakapo (Strigops habroptilus). Zoo Biology. 32:620–625. doi:10.1002/zoo.21098.
- Waite DW, Dsouza M, Sekiguchi Y, Hugenholtz P, Taylor MW. 2018. Network-guided genomic and metagenomic analysis of the faecal microbiota of the critically endangered kakapo. Scientific Reports. 8:8128. doi:10.1038/s41598-018-26484-4.
- Waite DW, Eason DK, Taylor MW. 2014. Influence of hand rearing and bird age on the fecal microbiota of the critically endangered kakapo. Applied and Environmental Microbiology. 80:4650–4658. doi:10.1128/AEM.00975-14.
- Weeks DM, Parris MJ, Brown SP. 2020. Recovery and resiliency of skin microbial communities on the southern leopard frog (Lithobates sphenocephalus) following two biotic disturbances. Animal Microbiome. 2(1):35. doi:10.1186/s42523-020-00053-5
- Weiss M, Bauer R, Sampaio JP, Oberwinkler F. 2014. 12 tremellomycetes and related groups. In: McLaughlin D., Spatafora J, editor. Systematics and evolution. The mycota, vol 7A. Berlin: Springer. doi:10.1007/978-3-642-55318-9_12
- West AG, Digby A, Lear G, Kākāpō Recovery Team, Kākāpō Aspergillosis Research Consortium, Taylor MW. 2022. Influence of management practice on the microbiota of a critically endangered species: a longitudinal study of kākāpō chick faeces and associated nest litter. Animal Microbiome. 4:55. doi:10.1186/s42523-022-00204-w.
- West AG, Waite DW, Deines P, Bourne DG, Digby A, McKenzie VJ, Taylor MW. 2019. The microbiome in threatened species conservation. Biological Conservation. 229:85–98. doi:doi:10.1016/j.biocon.2018.11.016.
- Wickham H. 2011. The split-apply-combine strategy for data analysis. Journal of Statistical Software. 40:1–29.
- Wickham H. 2016. Ggplot2: elegant graphics for data analysis. New York: Springer-Verlag.
- Wienemann T, Schmitt-Wagner D, Meuser K, Segelbacher G, Schink B, Brune A, Berthold P. 2011. The bacterial microbiota in the ceca of Capercaillie (Tetrao urogallus) differs between wild and captive birds. Syst Appl Microbiol. 34(7):542–551. doi:10.1016/j.syapm.2011.06.003.
- Wilke CO. 2020. cowplot: Streamlined plot theme and plot annotations for ‘ggplot2’.
- Winter DJ, Weir BS, Glare T, Rhodes J, Perrott J, Fisher MC, Stajich JE, Kākāpō Aspergillosis Research Consotrium, Digby A, Dearden PK. 2022. A single fungal strain was the unexpected cause of a mass aspergillosis outbreak in the world’s largest and only flightless parrot. iScience. 25(12):105470. doi:10.1016/j.isci.2022.105470.
- Woodhams DC, Geiger CC, Reinert LK, Rollins-Smith LA, Lam B, Harris RN, Briggs CJ, Vredenburg VT, Voyles J. 2012. Treatment of amphibians infected with chytrid fungus: learning from failed trials with itraconazole, antimicrobial peptides, bacteria, and heat therapy. Dis Aquat Organ. 98(1):11–25. doi:10.3354/dao02429.
- Wu X, Xia Y, He F, Zhu C, Ren W. 2021. Intestinal mycobiota in health and diseases: from a disrupted equilibrium to clinical opportunities. Microbiome. 9:60. doi:10.1186/s40168-021-01024-x.
- Xi L, Qin X, Song Y, Han J, Li Z, Zhang J. 2021. Gut microbial alterations in diarrheal Baer’s Pochards (Aythya baeri). Front Vet Sci. 8:756486. doi:10.3389/fvets.2021.756486.
- Xiang X, Jin L, Yang Z, Zhang N, Zhang F. 2021. Dramatic shifts in intestinal fungal community between wintering hooded crane and domestic goose. Avian Research. 12. doi:10.1186/s40657-020-00238-1