
ABSTRACT
Artificial light at night (ALAN) is considered a growing threat to bat species due to its potential impacts on circadian cycles, increased predation risk, and avoidance behaviour. Urban expansion and associated increases in ALAN may impact the behaviour of New Zealand’s critically threatened long-tailed bat (Chalinolobus tuberculatus). To determine whether long-tailed bat behaviour was affected by ALAN, a small-scale study was conducted on the fringe of Hamilton City, New Zealand, using LED floodlights. Changes in the number of nightly detections in response to periodic illumination were measured using acoustic monitoring and compared to a nearby unlit control site. Bat detection rates were significantly lower on lit nights compared to unlit nights at the treatment site, while there was no significant difference at the control site for the same period. In addition, the median time of the first recorded bat detection was c. 2 h later during lit nights compared to unlit nights at the treatment site. These results indicate that ALAN may have a negative effect on the behaviour of long-tailed bats, potentially delaying the use of areas and excluding them from foraging habitat. Further research into the effects and potential mitigation of ALAN for long-tailed bats is required.
Introduction
Artificial light at night (ALAN) has been declared a growing threat to global biodiversity (Hoffmann Citation2010; Davies et al. Citation2012; Voigt and Kingston Citation2015). This is because there has been increasing recognition of the negative impacts from artificial light at night on nocturnal species, both in terms of behavioural changes and increased mortality rates (Owens et al. Citation2020; Marangoni et al. Citation2022; Vardi-Naim et al. Citation2022). In coastal regions, high levels of ALAN have been associated with seabird disorientation and associated mortality (Marangoni et al. Citation2022). Similarly, nocturnal insects are often attracted to streetlights and up to 30%–40% may die as a result of collision, overheating, dehydration or predation (Owens and Lewis Citation2018). International research has found that even small levels of ALAN above lunar sky brightness may disrupt bat foraging and mating behaviour (Perkin et al. Citation2011; Voigt et al. Citation2018), and cause bats to avoid areas of their home ranges for at least part of the night (Haddock et al. Citation2019b). For example, Australian Vespadelus vulturnus are detected later when light is added to habitat areas they use regularly (Haddock et al. Citation2019b). In the United Kingdom, researchers have found that light pollution caused Myotis lucifugus and Eptesicus fuscus to avoid areas that are otherwise suitable for foraging and roosting (Stone et al. Citation2015). Avoidance of previously suitable areas due to ALAN is likely to have negative effects on bat populations with implications for their ability to find food and mates, and effectively cause habitat fragmentation and loss of connectivity between separate bat populations (Stone et al. Citation2009). The presence of ALAN has also been reported to influence roost departure timing, selection of foraging areas and the movement patterns of bats due to a perceived increase in predation risk (Jenkins et al. Citation1998; Welbergen Citation2006; Russo et al. Citation2007).
While many bat species are sensitive to ALAN (Voigt et al. Citation2018), some fast-flying bat species (e.g. Lasiurus spp., Eptesicus spp. and Nyctalus spp.) appear to be less affected by ALAN compared with their slow-flying counterparts (e.g. Rhinolophus spp., Plecotus spp. and Myotis spp.) (Stone et al. Citation2015; Haddock et al. Citation2019a). These studies postulated that slow-flying (<34 km h−1) (LaVal et al. Citation1977; Kunz and Martin Citation1982) species were more likely to be light intolerant as they were vulnerable to nocturnal avian predators. In contrast, fast-flying (>40 km h−1) insectivorous species (Bullen et al. Citation2016), may be able to take advantage of increased prey abundance from phototaxic insects, without an associated increase in predation risk (Polak et al. Citation2011). Based on this, it could be expected that New Zealand’s long-tailed bats (Chalinolobus tuberculatus), which have been recorded as flying as fast as 60 km h−1 (O’Donnell Citation2001), would take advantage of increased invertebrate abundance around lights and be recorded more often in the presence of light. Despite anecdotal reports of long-tailed bats feeding around lights, the impact of ALAN on their behaviour has been largely assumed, with only limited, unpublished data of effects inferred from the density of streetlights (Le Roux Citation2012; Davidson-Watts Citation2019). Transect surveys of Hamilton City by Dekrout et al. (Citation2014) found that in the five river/riparian quadrats with bat detections, bat presence was negatively correlated with streetlight density. However, the use of hand-held acoustic detectors meant surveys only took place in the early evening as these devices required manual logging of detections by volunteers, while more recent (2019–2022) city-wide surveys using logging acoustic monitors have detected long-tailed bat in residential and commercial parts of Hamilton, although most activity is still restricted to the unlit, green-spaces in the south of the city (Dumbleton and Montemezzani Citation2020; Aughton Citation2021; Caskey and Tempero Citation2022).
To determine whether changes in long-tailed bat detection rates occur in response to intermittent ALAN, a small-scale experiment was conducted, taking advantage of previously installed Light Emitting Diode (LED) floodlights. Changes in the number of nightly detections and nightly first detection times at a control site and a treatment site were determined to ascertain how long-tailed bats responded to ALAN. Findings from this study were intended to provide direction for further investigation of factors such as the relative effects of specific light wavelengths, the likelihood of habituation, and potential mitigation measures.
Methods
Study species
The New Zealand long-tailed bat is classified as critically threatened (O’Donnell et al. Citation2023) under the New Zealand Threat Classification System and is listed as critically endangered by the IUCN (O’Donnell Citation2021). They were once widespread throughout New Zealand (Cheeseman Citation1872; Buller Citation1892; Daniel and Williams Citation1984; O’Donnell Citation2000; Alexander Citation2001), but their numbers have declined significantly since the 1930s (Stead Citation1936). This decline has been associated with large-scale deforestation, predation by introduced mammalian pests and human disturbance (O’Donnell Citation2000). In the most recent assessment of their threat status, there was significant concern about continued habitat loss (O’Donnell et al. Citation2023). Habitat loss can be either direct with the loss of, for example, vegetation or, in less obvious ways, with the introduction of light to areas bats use, provided that light influences use of that area.
Study site
The study site was located on a private property in Tamahere, a peri-urban area on the south-eastern boundary of Hamilton City, in the central North Island of New Zealand. Research involved free-living long-tailed bats was conducted with the approval of the University of Waikato Animal Ethics Committee (approval number 1101). The site contained approximately 70 mature kahikatea (Dacrycarpus dacrydioides) trees (height: 24–36 m, diameter at breast height: 52–102 cm) covering an area of approximately 0.5 ha. Three identical LED floodlights (LEDFIT, 90 W, CRI 80, CCT 4000 K) were installed by the property owners to shine directly into the trees for aesthetics, and were only used approximately twice per year. The lights were installed at ground level, approximately 50 m apart, pointing upwards at a 60° angle (). The illumination from a single floodlight was 1360.0 lx at 1 m from the lights, decreasing to 7.1 lx at 10 m and 1.0 lx at 25 m.
Figure 1. Site layout of lighting study conducted at Tamahere, North Island, New Zealand. Arrows denote the direction of illumination.
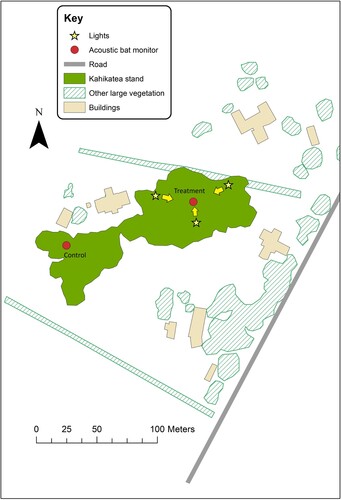
A similarly vegetated control site, without floodlights, was located on the same property approximately 150 m from the treatment site. Monitoring prior to the experiment commencing confirmed that long-tailed bats were detected regularly at both the treatment and control site at similar rates. One automated bioacoustic monitoring unit (henceforth referred to as ‘detector’) (Model AR4; Department of Conservation Electronics Workshop, Wellington, New Zealand) was deployed at each site to record bat echolocation calls every night over a 10-week period from October to December 2020. The AR4 detector model is estimated to detect long-tailed bat within a 30–50 m radius (Smith et al. Citation2020), meaning there was no overlap in detections between the control and treatment sites. The same detectors were used for the entire length of the experiment to reduce the likelihood of detection differences between individual detectors. Detectors were attached to tree branches at approximately 3 m height at both sites.
Experimental design
Following several months of monitoring to establish the consistent presence of long-tailed bats, the experimental period commenced at the end of October 2020 and concluded in December 2020, encompassing Austral spring (September–November) when long-tailed bat detection rates are high to maximise the likelihood of detecting an effect (Borkin Citation2010; Le Roux Citation2010). The LED floodlights were switched on for four consecutive nights (lit), followed by four nights with the lights off (unlit), with this sequence repeated eight times over 10 weeks. This provided a total of 32 lit nights and 35 unlit nights, as one unlit session was cut short by one night due to logistical issues. The experiment ended with four unlit nights. Each detector was set to record from 1 h before sunset to 1 h after sunrise. The floodlights were turned on at 5 pm, well before sunset, to ensure the lights did not cause a sudden increase in lux while daylight was declining, and then turned off at midnight so that the experimental period encompassed the known peak in detections of long-tailed bat in this area (Le Roux Citation2010).
Data analysis
A long-tailed bat detection was defined as a series of one or more ultrasonic calls recorded on one spectrogram, which typically represented 1–6 s of recording time. The other extant New Zealand bat – the lesser short-tailed bat, Mystacina tuberculata – is not present in the Hamilton area (Parsons and Toth Citation2021), and calls appear different to long-tailed bats (Lloyd Citation2017), therefore all bat calls recorded were easily classified as long-tailed bats. Recordings were manually classified as long-tailed bat detections using the BatSearch v. 3.2 software (Department of Conservation) and following Lloyd (Citation2017). The number of detections for each night was summed for the total number of detections each night. Due to the skew of values towards zero, linear regression using a Poisson distribution was performed using Graphpad Prism (v.9.4) to determine whether there was a significant difference (P < .05) in the number of bat detections per night between lit and unlit nights at the treatment and control sites. Due to the extended period of our study (October–December), linear regression analysis was also used to determine if there were any significant trends in the total number of nightly detections over time to understand whether bats became habituated to lighting during the four-night lit cycles.
As another measure of avoidance behaviour, the difference in time of the nightly first recorded bat pass during the lit and unlit conditions was analysed. The elapsed time in minutes relative to sunset for each first pass detection at the control and treatment sites was calculated. Differences in nightly first detection time between the lit and unlit periods at the treatment and control sites were determined using a general linear regression with a Gaussian distribution.
Results
From October–December 2020 a total of 3850 bat detections were recorded over 68 experimental nights. No significant trends in the number of bat detections occurred over time at either the control site (P > .05, df = 66, r2 = 0.04) or the treatment site (P > .05, df = 66, r2 = 0.002). Similarly, there was no significant trend in bat detections with exposure to consecutive lit nights (P > .05, df = 8). Regardless of lighting, more detections were recorded at the treatment site (median 46.5, IQR 34.0–67.0 detections night−1) compared to the control site (median 31.0, IQR 17.3–51.5 detections night−1). This difference was also present in the month prior to starting operation of the lights (September, i.e. treatment site median 44 detections night−1, IQR 16–65, control site median 27 detections night−1, IQR 3–56). When the treatment site was lit, there were significantly fewer detections per night at the treatment site compared to the unlit periods (GLM: z = 11.6, P < −.0001) (; ). However, there was no significant difference (GLM: z = 0.6, P > .05) in the number of detections per night at the control site, regardless of the changes in lighting at the treatment site (; ).
Figure 2. Total number of long-tailed bat detections at the treatment and control sites during lit and unlit nights. Horizontal bar indicates median; error bars indicate interquartile range. Note: Lit and Unlit reflect the changes in lighting at the treatment site; the control site was always unlit.
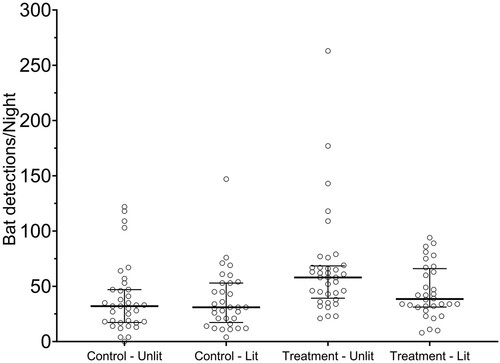
Table 1. Generalised linear modelling was used to determine whether there was a significant difference in the number of bat detections per night during unlit nights compared to lit nights at the control and treatment sites.
There was no difference (P > .05) in nightly first detection times between the treatment and control site in the months prior to the experiment. During the experiment, the median nightly first detection time for the combined data was +58.5 min relative to sunset (earliest: −56 min prior to sunset, latest: +5 h 17 min post sunset). At the treatment site, nightly first detection times relative to sunset were significantly (GLM: t = 4.8, P < .0001) later during lit nights compared to unlit nights (lit: median 136.5 min relative to sunset, IQR 38.5–260.5; unlit: median +22 min relative to sunset, IQR 6–75.3) (). When treatment and control site detection times were compared, the treatment site was significantly (GLM: t = 2.2, P < .05) later compared to the control site (median +97 min, IQR 43.3–146) during the lit nights. The difference in the median time to first detection was greatest when comparing the lit treatment site with the control site during non-lit periods (median +33 min, IQR 0.3–158.3) (GLM: t = 3.2, P < .01) (; ). However, the changes in lighting at the treatment site produced no significant difference (GLM: t = 1.5, P > .05) in first detection times at the control site.
Figure 3. Time relative to sunset of first nightly bat detection at control and treatment sites during lit and unlit periods. Zero on the y-axis reflects sunset, positive values are post sunset detections and negative values are pre-sunset detections Note: Lit and Unlit reflect the changes in lighting at the treatment site, flood-lights were not present at the control site. The horizontal line indicates median, error bars indicate interquartile range.
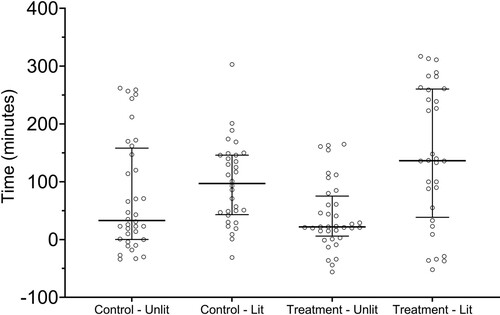
Table 2. General linear modelling was used to compare nightly first detection times when the treatment site was lit to unlit periods, and the control site during periods when the treatment site was lit and unlit.
Discussion
Previous research of the Hamilton long-tailed bat population found a negative correlation between detection rates and streetlight density within river riparian zones (Dekrout et al. Citation2014); however, very little is known about the effect of ALAN on long-tailed bat behaviour. This is despite well documented negative impacts of ALAN on bat species in other countries (Mathews et al. Citation2015; Spoelstra et al. Citation2017; Haddock et al. Citation2019b).
Our results indicate that long-tailed bat behaviour appears to be affected by ALAN, with fewer detections during periods of illumination. This result is contrary to the theory proposed by Haddock et al. (Citation2019a) and Stone et al. (Citation2015) that fast-flying bats such as long-tailed bats would be detected more often when sites were lit, taking advantage of increased phototaxic insect abundance. While insect abundance was not quantified in the present study, it is possible that insect abundance was not sufficiently enhanced to compensate for the perceived increase in predation risk (Rydell Citation1992; Blake et al. Citation1994; Rydell and Racey Citation1995). Measuring potential changes in insect abundance around light should be considered for future studies that investigate potential direct and indirect effects of light on bats. It should be noted that the current study was not designed to replicate the effects of street lighting. However, ALAN is composed of a variety of lighting sources, and these results highlight the importance of considering types of lights other than streetlights when examining the overall impact of ALAN on bats. Further investigations into ways to minimise effects from a variety of lighting sources should be a research priority.
During the experimental period, there was no significant trend in the number of bat detections per night at either the control site or the treatment site. Similarly, there was no significant trend associated with the number of bat detections in relation to the sequential number of lit nights, indicating that bats did not habituate to the lights during the experimental period. However, the local bat population is likely to be somewhat familiar with ALAN given the proximity of the study site to peri-urban low-density housing, and is within the typical long-tailed bat home range to more intensively lit residential areas of Hamilton City (Davidson-Watts Citation2019). Whether these findings hold for more naive long-tailed bat populations will be the subject of a further investigation.
In addition to reduced detections, nightly first detection times were later when the treatment site was lit. This may indicate disruption in foraging patterns and habitat use due to the presence of ALAN. If bats avoid lit sites, this could increase flight distances to suitable foraging areas, with associated energetic cost increases and loss of time that could otherwise be spent foraging (Jones et al. Citation2019). Disruption of normal foraging patterns increase the risk that bats will miss peaks in invertebrate prey abundance at preferred foraging sites, thereby reducing the quality of foraging time (Fure Citation2012). It is possible that the delays observed in long-tailed bats’ use of the site on lit nights may have been due to neophobia of ALAN and they may have chosen to forage at different locations. However, consideration should also be given to the possibility that long-tailed bats’ response to ALAN may be site-specific (Mathews et al. Citation2015) or depend on the type of illumination (Blake et al. Citation1994). The lights used in this study had a colour temperature of 4000 K. This matches the colour temperature used most often in lighting along roads (Muir and Collins Citation2014), but exceeds the recommended colour temperature to use when you wish to reduce negative impacts on bats (2700 K or warmer, Voigt and Kingston Citation2015; Voigt et al. Citation2018). Further research is currently being undertaken to compare the relative effects on long-tailed bats of warmer colour temperatures with those most commonly used in New Zealand.
This study provides an important indication of the potential negative impacts of ALAN on long-tailed bats, and points to the importance of protecting edges of urban and peri-urban vegetated spaces from light pollution. Remnant populations of critically endangered long-tailed bats are increasingly being reported in peri-urban/urban areas in New Zealand, and given the expansion of New Zealand’s urban centres may increasingly be exposed to ALAN. When ALAN is necessary, mitigation measures to address these effects on bats should be implemented. Minimising the amount of light present at a site is a key step to mitigate the effects of light on these bats (Voigt et al. Citation2018). As lighting technology advances, there will be more opportunities to reduce the negative impact of artificial light on wildlife (Limpens et al. Citation2012; Spoelstra et al. Citation2017). Close collaboration between ecologists and lighting engineers is essential to realise these opportunities.
Disclosure statement
No potential conflict of interest was reported by the author(s).
References
- Alexander J. 2001. Ecology of long-tailed bats Chalinolobus tuberculatus (Forster, 1844) in the Waitakere Ranges: implications for monitoring [MSC thesis]. Lincoln University. Christchurch.
- Aughton H. 2021. Hamilton city wide bat survey. Project echo. Hamilton, New Zealand.
- Blake D, Hutson AM, Racey PA, Rydell J, Speakman JR. 1994. Use of lamplit roads by foraging bats in southern England. J Zool. 234(3):453–462. doi:10.1111/j.1469-7998.1994.tb04859.x.
- Borkin K. 2010. Ecology of New Zealand’s Long-tailed bat (Chalinolobus tuberculatus) in exotic plantation forest [PhD thesis]. University of Auckland. Auckland.
- Bullen R, McKenzie N, Cruz-Neto A. 2016. Characteristic flight speeds in bats. CEAS Aeronaut J. 7:621–643. doi:10.1007/s13272-016-0212-5.
- Buller WL. 1892. Notes on the bats of New Zealand. Trans N Z Inst. 25:50–52.
- Caskey L, Tempero G. 2022. Hamilton City long-tailed bat survey: annual monitoring report, 2022. ERI Report No. 165. Report prepared for Project Echo. Environmental Research Institute. Division of Health, Engineering, Computing and Science, University of Waikato. Hamilton.
- Cheeseman TT. 1872. On the botany of the Titirangi district of the Province of Auckland. Trans N Z Inst. 4:270–284.
- Daniel MJ, Williams GR. 1984. A survey of the distribution, seasonal activity and roost sites of New Zealand bats. N Z J Ecol. 9–25.
- Davidson-Watts I. 2019. Long-tailed bat trapping and radio tracking. Hamilton: Report prepared for AECOM by Davidson-Watts Ecology (Pacific) Ltd. Gore.
- Davies TW, Bennie J, Gaston KJ. 2012. Street lighting changes the composition of invertebrate communities. Biol Lett. 8(5):764–767. doi:10.1098/rsbl.2012.0216.
- Dekrout AS, Clarkson BD, Parsons S. 2014. Temporal and spatial distribution and habitat associations of an urban population of New Zealand long-tailed bats (Chalinolobus tuberculatus). N Z J Zool. 41(4):285–295. doi:10.1080/03014223.2014.953551.
- Dumbleton H, Montemezzani W. 2020. Hamilton city long-tailed bat survey. Hamilton: Prepared for Project Echo by 4sight consulting. 4sight Consulting Ltd. Hamilton.
- Fure A. 2012. Bats and lighting — six years on. Lond Nat. 91:69–88.
- Haddock JK, Threlfall CG, Law B, Hochuli DF. 2019a. Responses of insectivorous bats and nocturnal insects to local changes in street light technology. Austral Ecol. 44(6):1052–1064. doi:10.1111/aec.12772.
- Haddock JK, Threlfall CG, Law B, Hochuli DF. 2019b. Light pollution at the urban forest edge negatively impacts insectivorous bats. Biol Conserv. 236:17–28. doi:10.1016/j.biocon.2019.05.016.
- Hoffmann I. 2010. Climate change and the characterization, breeding and conservation of animal genetic resources. Anim Genet. 41(1):32–46. doi:10.1111/j.1365-2052.2010.02043.x.
- Jenkins EV, Laine T, Morgan SE, Cole KR, Speakman JR. 1998. Roost selection in the pipistrelle bat, Pipistrellus pipistrellus (Chiroptera: Vespertilionidae), in northeast Scotland. Anim Behav. 56(4):909–917. doi:10.1006/anbe.1998.0858.
- Jones C, Borkin KM, Smith D. 2019. Roads and wildlife: the need for evidence-based decisions. New Zealand bats as a case study. N Z J Ecol. 43(2):3376.
- Kunz TH, Martin RA. 1982. Plecotus townsendii. Mamm Species. 175:1–6.
- LaVal RK, Clawson RL, LaVal ML, Caire W. 1977. Foraging behavior and nocturnal activity patterns of Missouri Bats, with emphasis on the endangered species Myotis grisescens and Myotis sodalis. J Mammal. 58(4):592–599. doi:10.2307/1380007.
- Le Roux DS. 2010. Monitoring long-tailed bat (Chalinolobus tuberculatus) activity and investigating the effect of aircraft noise on bat behaviour in a modified ecosystem [MSc thesis]. University of Waikato. Hamilton.
- Le Roux DS, Le Roux NN. 2012. Hamilton City Bat Survey 2011-2012. Report prepared for Project Echo. Hamilton
- Limpens H, Velamen M, Dekker J, Jansen E, Huitema H. 2012. Bat friendly colour spectrum for artificial light? IENE 2012 International Conference.,21–24 of October 2012. Berlin and Potsdam, Germany.
- Lloyd B. 2017. Bat call identification manual for DOC’s spectral bat detectors. Wellington: Department of Conservation.
- Marangoni LF, Davies T, Smyth T, Rodríguez A, Hamann M, Duarte C, Pendoley K, Berge J, Maggi E, Levy O. 2022. Impacts of artificial light at night in marine ecosystems – a review. Glob Chang Biol. 28(18):5346–5367. doi:10.1111/gcb.16264.
- Mathews F, Day J, Baker J, Roche N, Aughney T, Jones N, Langton S. 2015. Barriers and benefits: implications of artificial night-lighting for the distribution of common bats in Britain and Ireland. Philos Trans R Soc B Biol Sci. 370(1667):13p. doi:10.1098/rstb.2014.0124.
- Muir S, Collins A. 2014. M30 specification and guidelines for road lighting design (no. 1). New Zealand Transport Agency. Wellington. New Zealand.
- O’Donnell C. 2000. Conservation status and causes of decline of the threatened New Zealand long-tailed bat Chalinolobus tuberculatus (Chiroptera: Vespertilionidae). Mammal Rev. 30(2):89–106. doi:10.1046/j.1365-2907.2000.00059.x.
- O’Donnell C. 2001. Home range and use of space by Chalinolobus tuberculatus, a temperate rainforest bat from New Zealand. J Zool. 253(2):253–264. doi:10.1017/S095283690100022X.
- O’Donnell C. 2021. Chalinolobus tuberculatus. The IUCN red list of threatened species 2021. [accessed 28 February 2023]. https://www.iucnredlist.org/en.
- O’Donnell CFJ, Borkin KM, Christie J, Davidson-Watts I, Dennis G, Pryde M, Michel P. 2023. Conservation status of bats in Aotearoa New Zealand, 2022. Department of Conservation. Wellington.
- Owens AC, Lewis SM. 2018. The impact of artificial light at night on nocturnal insects: a review and synthesis. Ecol Evol. 8(22):11337–11358. doi:10.1002/ece3.4557.
- Owens ACS, Cochard P, Durrant J, Farnworth B, Perkin EK, Seymoure B. 2020. Light pollution is a driver of insect declines. Biol Conserv. 241:108259.
- Parsons S, Toth C. 2021. Mystacina tuberculata. In: Handb N Z Mamm, editor. 3rd ed. Melbourne: CSIRO Publishing; p. 95–130.
- Perkin EK, Hölker F, Richardson JS, Sadler JP, Wolter C, Tockner K. 2011. The influence of artificial light on stream and riparian ecosystems: questions, challenges, and perspectives. Ecosphere. 2(11):1–16. doi:10.1890/ES11-00241.1.
- Polak T, Korine C, Yair S, Holderied MW. 2011. Differential effects of artificial lighting on flight and foraging behaviour of two sympatric bat species in a desert. J Zool. 285(1):21–27. doi:10.1111/j.1469-7998.2011.00808.x.
- Russo D, Cistrone L, Jones G. 2007. Emergence time in forest bats: the influence of canopy closure. Acta Oecol. 31(1):119–126. doi:10.1016/j.actao.2006.11.001.
- Rydell J. 1992. Exploitation of insects around streetlamps by bats in Sweden. Funct Ecol. 6:744–750. doi:10.2307/2389972.
- Rydell J, Racey PA. 1995. Street lamps and the feeding ecology of insectivorous bats. In Symposia of the Zoological Society of London (No. 67). London. p. 291–308.
- Smith DHV, Borkin KM, Shaw WB. 2020. A comparison of two bat detectors: which is most likely to detect New Zealand’s Chalinolobus tuberculatus? N Z J Zool. 47(3):233–240. doi:10.1080/03014223.2020.1754864.
- Spoelstra K, van Grunsven RHA, Ramakers JJC, Ferguson KB, Raap T, Donners M, Veenendaal EM, Visser ME. 2017. Response of bats to light with different spectra: light-shy and agile bat presence is affected by white and green, but not red light. Proc R Soc B Biol Sci. 284(1855):1–8.
- Stead EF. 1936. Notes on the short-tailed bat (Mystacops tuberculatus). Trans R Soc N Z. 66:188–191.
- Stone EL, Harris S, Jones G. 2015. Impacts of artificial lighting on bats: a review of challenges and solutions. Mamm Biol. 80(3). doi:10.1016/j.mambio.2015.02.004.
- Stone EL, Jones G, Harris S. 2009. Street lighting disturbs commuting bats. Curr Biol. 19(13):1123–1127. doi:10.1016/j.cub.2009.05.058.
- Vardi-Naim H, Benjamin A, Sagiv T, Kronfeld-Schor N. 2022. Fitness consequences of chronic exposure to different light pollution wavelengths in nocturnal and diurnal rodents. Sci Rep. 12(1):16486. doi:10.1038/s41598-022-19805-1.
- Voigt CC, Azam D, Deker J, Ferguson J, Fritze M, Gazaryan S, Hölker F, Jones G, Leader N, Lewanzik D, et al. 2018. Guidelines for consideration of bats in lighting projects. EUROBATS Publication Series No. 8. UNEP/EUROBATS Secretariat. Bonn, Germany. p. 62.
- Voigt CC, Kingston T. 2015. Bats in the anthropocene: conservation of bats in a changing world. Berlin: Springer Nature.
- Welbergen JA. 2006. Timing of the evening emergence from day roosts of the grey-headed flying fox, Pteropus poliocephalus: the effects of predation risk, foraging needs, and social context. Behav Ecol Sociobiol. 60(3):311–322. doi:10.1007/s00265-006-0167-3