
ABSTRACT
Spiders contribute to pest suppression in agroecosystems by direct and non-direct consumption. They provide an ecosystem service which provides economic gains to horticultural growing systems, such as apples, wine grapes, and kiwifruit. Very few studies on spider biodiversity in cropping systems have been completed in New Zealand, and no studies have been published for New Zealand orchard systems. In this study, spiders and harvestmen were sampled from vineyards, apple orchards, and kiwifruit orchards in three New Zealand locations, Waipara, Motueka, and Kerikeri. Spiders were sampled using pitfall traps, sweep netting, active day sampling, and active night sampling. A total of 1359 spiders and 87 Opiliones were caught in this study, from 17 families and 31 species. Sixteen of the 31 (51.6%) species found were introduced, 9 (29%) endemic to New Zealand, two species (6.4%) native to New Zealand, and four (12.9%) unknown. There were five dominant spider families caught (Araneidae, Lycosidae, Theridiidae, Linyphiidae, and Desidae), and of the adults, there were five dominant species: Anoteropsis hilaris, Tenuiphantes tenuis, Cryptachaea veruculata, Cryptachaea blattea, and Steatoda capensis. This study provides the first important step in describing the spider families and species found in three economically important New Zealand horticultural systems.
Introduction
Spiders are the dominant, most abundant, and most diverse natural enemies in agroecosystems (Sunderland Citation1999; Michalko et al. Citation2019). There are other arthropod generalist predators that contribute to pest suppression (e.g. Dermaptera and predatory Coleoptera); however, spiders use a wider range of hunting strategies, they are distributed across more trophic levels, and they occupy a wider variety of spatial niches than other generalist predators (Michalko et al. Citation2019). Spiders can kill all life stages of a pest, making them of economic value, particularly to those looking to reduce pesticides in a growing system. Alternative options for pest control are in ever-increasing demand due to regulatory bodies removing pesticides from available use, consumer-driven demands, and increasing awareness of the off-target impacts (Bird et al. Citation1996; Bolz et al. Citation2022; Dubuis et al. Citation2023).
Very few studies on spider biodiversity in cropping systems have been completed in New Zealand (McLachlan and Wratten Citation2003; Vink et al. Citation2004; Curtis Citation2019), and no studies have been published on spider biodiversity in New Zealand orchard systems. Internationally, more examples can be found of studies on spider biodiversity in horticultural ecosystems (Coddington et al. Citation1996; Sunderland Citation1999; Haddad et al. Citation2005; Hambäck et al. Citation2021a; Geldenhuys et al. Citation2022; Liu et al. Citation2022; Michálek et al. Citation2022; Mishra et al. Citation2022). Increasingly, spiders are being seen as important generalist predators to assist the efforts of residue-free, carbon-neutral pest management systems (Zhang Citation1992; Sunderland Citation1999; Bowden et al. Citation2002; Michalko et al. Citation2019; Argañaraz et al. Citation2020; Michalko et al. Citation2021; Birkhofer et al. Citation2022; Liu et al. Citation2022; Michálek et al. Citation2022).
As well as direct consumption of pests, spiders are known to reduce pest populations via non-consumptive effects (Sunderland Citation1999; Hogg et al. Citation2014; Michalko et al. Citation2019). Spiders will often over-kill, partially feed on a pest, wound a pest, or cause movement to avoid predation, which still results in preventing the pest from damaging the crop. Spider webs kill small pests such as thrips, aphids, and midges that are sometimes ignored by the spider that produced the web, thus removing more pests from the crop system. Owing to the generalist predatory nature of spiders, some intraguild predation does occur (Hambäck et al. Citation2021b); however, this is considered to be minimal, and the overall benefit to the ecosystems outweighs any costs of spiders to other beneficial invertebrates (Sunderland Citation1999). Intraguild predation can also be reduced by providing complex habitats for spiders to live in (Gontijo Citation2019).
Harvestmen (Order: Opiliones) are an polyphagous arachnid, but primarily predators of invertebrates (Selden Citation2017). Harvestmen are sometimes observed alongside spiders in studies investigating generalist predators in agricultural systems (Vink et al. Citation2004) therefore, harvestmen were collected along with spiders in this current study.
Three economically important horticultural systems in New Zealand are viticulture, apples, and kiwifruit. These primary industries generated NZ$1858M, NZ$847M, and NZ$2709M, respectively, in New Zealand export revenue in 2021 (https://www.freshfacts.co.nz/ Accessed 21 December 2022). Pest insects affect the quality of produce and affect access into international markets, resulting in economic losses to these primary industries (Steven et al. Citation1997; Suckling et al. Citation1999; Wilson VB Citation2020; Sullivan et al. Citation2022).
This study aimed to quantify the composition and diversity of spiders and harvestmen present in horticultural ecosystems in New Zealand, as a first step towards enabling increased spider and harvestmen biodiversity for pest management and suppression.
Methods
Spider sampling was conducted at three locations throughout New Zealand: Waipara, Motueka and Kerikeri, from January to May 2022 (late summer–early autumn). Vineyards were sampled in Waipara, apple orchards in Motueka, and kiwifruit orchards in Kerikeri. Three different growing systems were sampled in three different locations owing to the availability of crops in those areas, and New Zealand Government COVID-19 travel restrictions at the time of this study.
Field sampling locations
Waipara vineyards
Three vineyards were sampled in Waipara, Canterbury, New Zealand (43.07°S, 172.75°E) from 10 to 19 January 2022. The vineyards were managed by three separate vineyard managers. One vineyard was organically managed, and the other two conventionally managed. Vineyards had row spacings of 3 m, and inter-row vegetation included grass, clover, plantain and similar-sized plants and was approximately 10–20 cm in height at the time of sampling.
Motueka apple orchards
Three apple orchards were sampled in Motueka, Tasman, New Zealand (41.11°S, 173.01°E) from 21 February to 2 March 2022. The apple orchards were all conventionally managed by the same orchard manager, under similar management regimes. Two of the apple orchards had 5 m row spacings, and one orchard had 3.5 m row spacings. Inter-row vegetation included grass, clover, plantain and other similar-sized plants and was approximately 20–30 cm in height at the time of sampling.
Kerikeri kiwifruit orchard
One large (41 ha) kiwifruit orchard was sampled in Kerikeri, Northland, New Zealand (35.23°S, 173.95°E) from 2 to 9 May 2022. The orchard was conventionally managed by a single orchard manager, using the same management regime. The kiwifruit orchard contained different land uses within the orchard, including a 4.4 ha remnant native bush area, a 4.58 ha and a 2.78 ha area of newly planted native trees, and large areas of only kiwifruit plantings. The remnant native bush area contained mature trees of many species, including tōtara (Podocarpus tōtara), kahikatea (Dacrycarpus dacryoides), māhoe (Melicytus ramiflorus), nikau (Rhopalostylis sapida), and ferns. Twenty-three different native plants were planted in the new planting areas, including mānuka (Leptospermum scoparium), kānuka (Kunzea robusta), harakeke (Phormium tenax), kauri (Agathis australis), tī kouka (Cordyline australis), and rimu (Dacrydium cupressinum). The planted trees were approximately 1–1.5 m tall at the time of spider collection. The kiwifruit orchard was first established 2–3 years prior to sampling in 2019–2020. The three different areas of the kiwifruit orchard were sampled for spiders. Ground cover in the kiwifruit orchards was sparse and was approximately 0–5 cm in height.
Sampling methods
At each orchard, two transects at least 50 m apart were established from the edge of the orchard 50 m into the centre of the orchard. Sampling took place at points along the transect as indicated below.
Pitfall traps
In Waipara and Motueka, pitfall traps (80 mm diameter × 90 mm deep) were dug into the ground along cordon rows in line with trees. Pitfalls were sunk flush with the ground and the traps were covered with a metal roof (150 × 200 mm) approx. 20 mm above the ground to prevent debris and precipitation falling into the trap. Owing to changes in personnel and COVID-19 travel restrictions, the pitfall traps used in Kerikeri were not identical to those used in Motueka and Waipara. In Kerikeri, jars (61 × 61 × 81 mm, 200 mL) were dug into the ground and a plastic funnel (75 mm mouth, 21 mm funnel hole) was placed into the jar. The funnel was made flush with the ground and was covered with either a square piece of metal or wood (approx. 200 × 200 mm) approx. 20 mm above the ground to prevent lizards, debris, and precipitation falling into the trap. Approximately 20 mm of propane-1,2-diol (monopropylene glycol, MPG) was poured into each pitfall trap to euthanise and preserve any organism that entered the pitfall. At all locations, a single pitfall traps was placed at five points along the transects: 0, 5, 10, 20 and 50 m and were left in the ground for seven days. Pitfall traps were then collected and brought back to a laboratory for sorting and specimen identification. All pitfall samples were kept separate and were not pooled.
Sweep netting
Each transect was sampled with a sweep net (diameter = 40 cm) during day time at four different points: 0–5 m, 15–20 m, 30–35 m and 45–50 m. The sweep net was swung low to the ground in five continuous pendulum swings 1 m apart at each of the four sampling points. The sweep net was then closed by being folded over, before the contents being emptied into a resealable plastic bag, sealed and placed into a chilly bin with ice packs to reduce movement of the captured invertebrates and prevent predation/cannibalism. The Waipara and Motueka sweep net samples were placed in a −18°C freezer within 6 h of collection. In Kerikeri, 80% ethanol was squirted into the sweep net sample bags immediately after collection so that samples could be removed from the orchard without the risk of removing Pseudomonas syringae pv. actinidiae (Psa) (Vanneste Citation2012) disease with any vegetation that had inadvertently made its way into the samples. All samples were kept separate and were not pooled.
Active timed collection
Spiders were sampled from each of the five transect sampling points (0, 5, 10, 20 and 50 m) under each of four categories: ‘Aerial’, ‘Ground’, ‘Day’ and ‘Night’. Aerial sampling was defined as from knee height to arms’ reach. Ground sampling was defined as below knee height. Both ‘Aerial’ and ‘Ground’ sampling were conducted both during the day (between the hours of 0900 and 1500) and at night (between the hours of 1900 and 0200, beginning no earlier than 30 min after sunset). Under each category at each sampling point, a 2 m long × 1 m wide area was searched for 4 min (timed using a stopwatch) and all spiders found were collected using a 60 mL aspirator, or hand collected straight into a 60 mL collection pottle if the spider specimen was too big for the aspirator. After the 4-min time-period was finished, 70% ethanol was squirted into the collection pottle to immediately euthanise the spiders collected. All samples were labelled and brought back to a laboratory for identification. All samples were kept separate and were not pooled.
Spider identification
All spiders collected of all life stages were identified morphologically to family using Paquin et al. (Citation2010). Adult spiders were identified to species morphologically using Paquin et al. (Citation2010), Forster and Forster (Citation1999), and Fitzgerald and Sirvid (Citation2004). A dissecting microscope (Nikon SMZ1500) was used for morphological identifications. Species were assigned to introduced, endemic, native or unknown status according to Paquin et al. (Citation2010) and Sirvid et al. (Citation2010).
Statistical analyses
Data were summarised across dates, transects and sample distances for each family (adults and immatures), species (adults only) and sex (adults only) at each site for each sampling method. Data for the aerial and ground active samples were combined, but the day and night counts for this sample method were summarised separately. Thus, there were four sampling methods: active day, active night, pitfall and sweep netting. Species accumulation curves were calculated using the raw counts. Samples here were for each location by sampling method combination, with three sites per location by two transects by sampling dates (variable number) by distance (variable number) by aerial/ground (where appropriate), giving 60, 60, 30 and 24 samples per location for Active Day, Active Night, Pitfall and Sweep net sampling methods. The ‘collectors curve’ type is presented (Magurran Citation2004). Summarised sample counts for various variables (Total spiders, Total Adults, Total immatures, Total for a family, Adults species identification, Composition of samples) were analysed. It was expected that the total caught at each location and the total for each sampling method will vary. However, there is no previous work showing how they vary in the context of differing crops and sampling methods: these analyses allow this. Nevertheless, of the prior expectations, the primary focus for these analyses was the interaction between location and sampling method, which assesses whether the pattern of differences between sampling methods changes substantially between the locations. The counts were analysed with a Poisson generalised linear model (McCullagh and Nelder Citation1989) with a log link function, with dispersion estimated. A small number of variables were analysed as percentages of a total (e.g. adults as a percentage of all spiders; percentage that were male). These were analysed using a binomial GLM with a logit link. Because of the different sampling times per location and different approaches used for each sample type, the family (or species) by sex composition of the catch is of high interest. The percentage in the samples of each family (or species) and sex are effectively a ‘response’ percentage out of the total caught. The data is then essentially a two-way table with sample as rows, and a column for each response combination. These data are thus multinomial. Therefore, the standard log-linear model for multinomial data (McCullagh and Nelder Citation1989) was used to assess how composition varied. (The multinomial method is a generalisation of the well-known Χ2 test for a two-way table of counts). This analysis is presented for the adults data only, since the identification to species and sex level were only possible for this data. The univariate models are sub-models of the multinomial model, and they allow an easier assessment of the differences for particular families (or species) or life-stages. All analyses included the explanatory variables location and sample method as main effects plus the interaction between them. These effects were assessed with F-tests or, where there was under-dispersion, X2 tests, done within the analyses of deviance carried out as a part of the analysis. Data are presented as means and associated 95% confidence limits. These were obtained on the link (log or logit) scale, and converted to the count or percentage scale. All analyses were carried out with Genstat (GenStatCommittee Citation2022).
Results
A total of 1359 spiders and 87 Opiliones were caught in this study (, Supplementary Table 1). Only one species of Opiliones was observed (Phalangium opilio). The spiders belonged to 17 different families and 31 species (16 introduced, 9 endemic, two native, and four unknown; ). Four families, Pisauridae, Clubionidae, Tetragnathidae and Oxyopidae, were represented only by immature specimens, and so species from these families could not be identified. Only one species of Oxyopidae is known to occur in New Zealand (Vink and Sirvid Citation1998), so it can be assumed the juveniles caught were this species, Oxyopes gracilipes (White, 1849). There were five dominant spider families caught (Araneidae, Lycosidae, Theridiidae, Linyphiidae, and Desidae). The first four of these families were found in numbers larger than 150 individuals, with 42 individuals found for one further family (Desidae). Formal analysis of the rarer families is likely to be unreliable. The less-prevalent families were therefore combined into an ‘other’ category, with 49 spiders in total (). There was no consistent relationship between catch and sample distance from the crop edge. Thus, the data were summarised over distances (Supplementary Figure 1).
Figure 1. Total spider, total adult spider, and total immature spider counts (per sample per site), and adults as a percentage of total spiders from sampling at three different New Zealand locations. Error bars are 95% confidence limits. Sampling methods are described in the text.
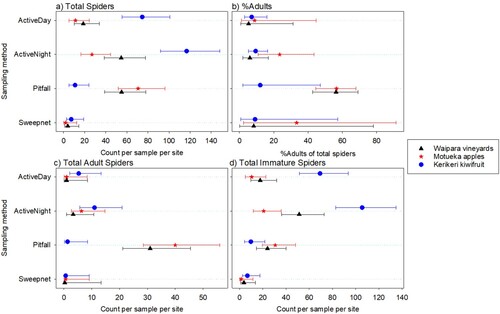
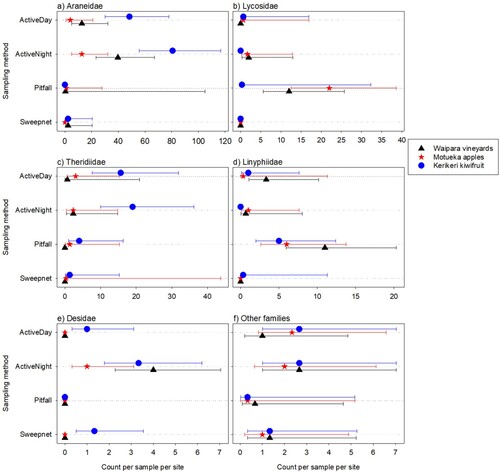
Figure 2. Total numbers of spiders caught per sample for each main family observed at three different New Zealand locations. Error bars are 95% confidence limits. Where the mean is 0, the upper limit is difficult to obtain, so is not shown. Sampling methods are described in the text.
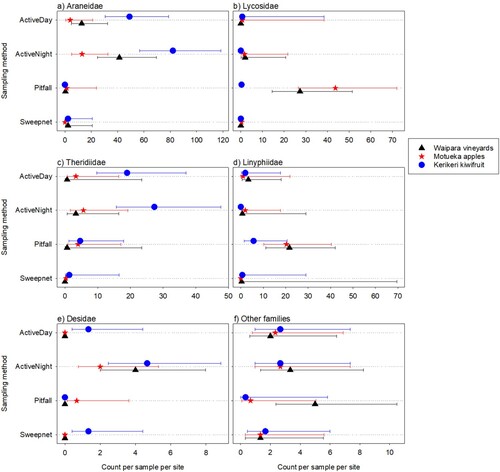
Table 1. Numbers of adult spiders of each sex found for each species from three different New Zealand locations. Families are in decreasing order of prevalence. E = New Zealand Endemic, N = New Zealand Native, I = Introduced, U = Unknown status. M = male, F = female.
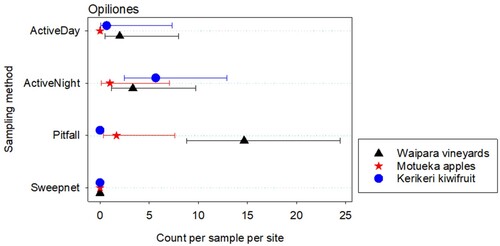
Of the total spiders found at a site, the greatest percentage by family was Araneidae for Waipara (42.8%) and Kerikeri (65.9%), but this family was only the third most prevalent at Motueka (16.5%) after Lycosidae (41.7%) and Linyphiidae (21%) (Supplementary Table 2). The total numbers of Opiliones per trap per site varied from 0 to 23 with a mean of 2.4 and median of 0. Counts varied with both location and sampling method (p = 0.036P 1 for the location by sampling method interaction. Where a numbered subscript for the p-values is referred to in the text, please see Supplementary material: Test statistics and associated p-values for various analysed variables and explanatory effects).
The highest counts of individual spiders were observed in kiwifruit orchards (n = 629) compared with apples orchards (n = 333) and vineyards (n = 397) (Supplementary Table 1). Of the four sampling methods, sweep netting obtained the lowest total catch of individual specimens (n = 35, ). Pitfall traps caught the highest number of adults spiders (n = 217), particularly in apple orchards and vineyards (). More immature spiders were caught using the active sampling methods than the pitfall traps or sweep netting, particularly in kiwifruit (). Spiders from the families Araneidae, Theridiidae and Desidae were more commonly caught using active searching methods, whereas spiders from the families Lycosidae and Linyphiidae were more commonly caught using pitfall traps (). More Araneidae and Theridiidae were found in kiwifruit orchards, whereas more Lycosidae and Linyphiidae were found in apple orchards and vineyards (). No Opiliones were found with sweep netting. The highest Opiliones counts were for the pitfall traps at Waipara, and the active night sampling at Kerikeri (). Species accumulation curves show plateaus for the Active Day, Active Night, and Pitfall sampling, but not for the Sweep net sampling (Supplementary Figure 2).
Figure 3. Total numbers of Opiliones caught per sample at three different New Zealand locations. Error bars are 95% confidence limits. Where the mean is 0, the upper limit is difficult to obtain, so is not shown. Sampling methods are described in the text.
Sampling methods
The total numbers of spiders, number of adults, and number of immatures all varied significantly between sampling method and locations (p < 0.001P 2 for the location and sampling method main effects, except for total adults, location main effect where p = 0.006 P 3) (). However, the pattern across sampling methods varied between locations (p < 0.001P 4 for the interaction between location and sampling method). The catch varied between the active day and active night sampling (p < 0.001P 5 for total and immatures; p = 0.02P 6 for adults). However, the percentage that were adults out of the total was reasonably consistent between sampling methods across the locations (p = 0.189P 7 for the sample method by location interaction), and the percentage was reasonably similar for the two active sampling methods (p = 0.411P 8).
Total spiders
Summarised over locations, for total spider abundance, the most prevalent family found by both active sampling (day and night) and sweep netting was Araneidae. The pattern for the pitfall trapping was quite different, with Lycosidae and Linyphiidae being the dominant families ().
Table 2. Percentages of spiders found for different sampling methods in each family from three different New Zealand locations. Sampling methods are described in the text.
For total spiders, in the three most prevalent families (Araneidae, Lycosidae, Theridiidae), counts varied between sampling types (p < 0.001P 9) and locations (p < 0.001P 10), with a similar pattern between the sampling methods for each location (0.6 < p < 0.9P 11 for the location by sampling method interaction). For Araneidae, the highest counts were found for the active sampling, with a higher catch at each location for the night catches than for the day catches (, ). Total Linyphiidae and Desidae catches varied between sampling types (p < 0.001P 12) but not strongly with locations (p = 0.110P 13, p = 0.088P 14 for the main effect for the two families, respectively; and p = 0.835P 15, p = 0.071P 16 for the interaction with sampling method). Linyphiidae were most often found with the pitfall trap, with numbers of this family found by the other sampling types being low or very low. Desidae were most prevalent with the active night sampling (, ). The total spiders from ‘other’ families did not vary strongly between sampling method or with location (p > 0.2P 17 for the main effects and the interaction) (, ).
Table 3. Average numbers of spiders per New Zealand site caught for each main family (95% Confidence limits). * where the mean is 0, the upper limit is difficult to obtain, so is not shown. Sampling methods are described in the text.
Adults
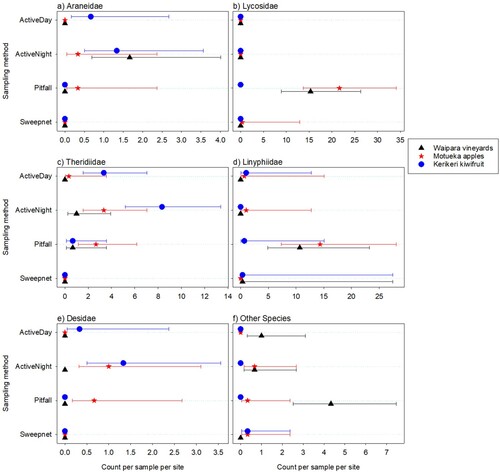
For all six of the family groupings, there were substantial differences in the numbers of adult spiders caught by the different sampling methods (p < 0.001P 18 for Araneidae, Lycosidae, Theridiidae and Linyphiidae, p = 0.009P 19 for Desidae, and p = 0.003P 20 for ‘other’ families) (). Adult counts for all families except Araneidae varied strongly between locations (p = 0.326P 21 for Araneidae; p < 0.001P 22 for Lycosidae, Theridiidae and other families; p = 0.028P 23 and 0.017P 24 for Linyphiidae and Desidae), with a similar pattern for all sampling methods except ‘other’ spider families (0.1 < p < 1P 25 and p = 0.035P 26 for others, for the location by sampling method interaction) ().
Figure 4. Total numbers of adult spiders caught per sample per site for each main family observed at three different New Zealand locations. Error bars are 95% confidence limits. Where the mean is 0, the upper limit is difficult to obtain, so is not shown. Sampling methods are described in the text.
Immatures
For the three most prevalent families (Araneidae, Lycosidae, Theridiidae) plus Desidae, immature spider counts varied with sampling method (p < 0.001P 27 for Araneidae, Lycosidae and Desidae, p = 0.005P 28 for Theridiidae) and with location (p < 0.001P 29 for Araneidae and Theridiidae, p = 0.004 P 30 Desidae, and p = 0.002P 31 for Lycosidae), with a similar pattern between the traps for each location (0.1 < p < 0.99P 32 for the location by sampling method interaction). Linyphiidae varied strongly with sampling method (p < 0.001P 33 for the trap main effect), but not strongly between locations (p = 0.124P 34 for the main effect and p = 0.719P 35 for the interaction). ‘Other’ families did not vary strongly with either factor (p = 0.852P 36, 0.054P 37 and 0.936P 38 for the location and trap main effects and their interaction, respectively) ().
Figure 5. Total numbers of immature spiders caught per sample per site for each main family observed at three different New Zealand locations. Error bars are 95% confidence limits. Where the mean is 0, the upper limit is difficult to obtain, so is not shown.
Adults: detailed species identification
The highest total spider catch was in Kerikeri, and the lowest in Motueka. However, the pattern for adults alone was the opposite, with the lowest catch in Kerikeri and the highest in Motueka. There were only three families (Lycosidae, Linyphiidae, Theridiidae) for which the total number of adults found was greater than 30 (). Amongst these families, most of the species were not very prevalent: just two species (Anoteropsis hilaris (Koch, 1877), Tenuiphantes tenuis (Blackwall, 1852)) had more than 30 individuals present. A further three had between 10 and 30 individuals present (Steatoda capensis (Hann, 1990), Cryptachaea veruculata (Urquhart, 1886), Cryptachaea blattea (Urquhart, 1886)).
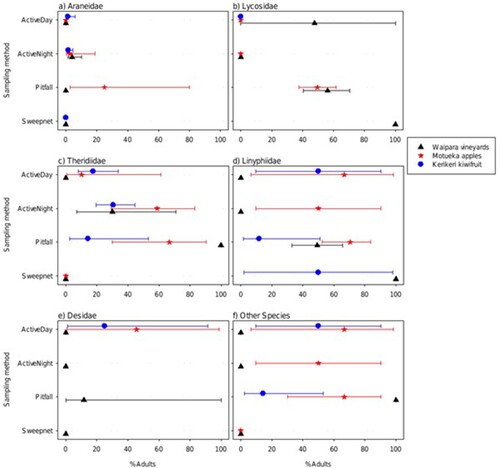
Differences in the percentage of spiders that were adults between locations were minor for Araneidae, Lycosidae, Theridiidae and Desidae (p = 0.433P 39, 0.262P 40, 0.073P 41, 0.081P 42, respectively, for the main effect). However, the percentage varied more substantially between locations for Linyphiidae and ‘other’ families (p = 0.016P 43 and p < 0.001P 44, respectively, for the main effect). Similarly, the percentage that were adults varied strongly between sampling types only for Lycosidae and ‘other’ families (p = 0.045P 45 and 0.003P 46, respectively), with relatively smaller differences for Araneidae, Theridiidae, Linyphiidae and Desidae families (0.07 < p < 0.5P 47). For all six family groups, the differences between sampling types were relatively similar for the locations (0.07 < p < 1P 48 for the interaction) ().
Figure 6. The percentages of spiders caught that were adults out of the total, for each of the families when sampled at three different New Zealand locations. Error bars are 95% confidence limits. Where the mean is 0 (or 100), the upper (or lower) limit is difficult to obtain, so is not shown. Sampling methods are described in the text.
Composition of samples: percentage of adults of each species and sex
Very few (two adults in Motueka apples, two in Kerikeri kiwifruit and one in Waipara vineyards) adult spiders of most species were caught with the sweep net, so this sampling method was excluded from the formal analysis of the composition of samples in terms of percentages of each sex by species combination. The pattern of percentages of the species and sex of those adults caught varied with both location and sampling method (p < 0.001P 49 for both main effects). However, the pattern across sampling method was reasonably similar across locations (p > 0.99P 50 for the interaction) (Supplementary Figure 3). When the species were aggregated to the family level, the pattern of percentages of each family/sex varied noticeably with sampling method and location (p < 0.001P 51 and p = 0.006P 52 for the location and sample method main effects, respectively). Notably, the number of families found was lower at Waipara (Supplementary Figure 4). The percentage of spiders that were male varied with both trap sample method and location (p < 0.001P 53 and p = 0.052P 54, respectively). There was a higher percentage of males for the pitfall trap compared to the two active sample methods except for Theridiidae where the percentage was highest for the active night sample method. The percentage male was above 50% at Motueka for all families.
Discussion
Of the total 1446 specimens collected, the five dominant spider families caught were Araneidae (orbweavers), Theridiidae (cobweb spiders), Linyphiidae (sheetweb spiders), Lycosidae (hunting spiders), and Desidae (ground spiders). Higher numbers of individual Araneidae and Theridiidae were found in Kerikeri kiwifruit, whereas in Motueka apple orchards, higher numbers of Linyphiidae and Lycosidae were found. This could be due to the habitats the vegetation structure of the different growing systems provides. In a kiwifruit orchard, there are a lot of aerial structures for web-building spiders to build their webs from, but the large amount of canopy cover blocks sunlight from reaching the ground, meaning not a lot of undergrowth is found for ground-dwelling spiders to occupy. In apple orchards and vineyards, more sunlight access between orchard rows allows more undergrowth vegetation for ground-dwelling spiders to occupy. In terms of the adult catches, the most dominant species were Anoteropsis hilaris (Lycosidae) and Tenuiphantes tenuis (Linyphiidae), followed by Cryptachaea veruculata (Theridiidae), Cryptachaea blattea (Theridiidae), and Steatoda capensis (Theridiidae). C. blattea (Theridiidae) was the dominant species in kiwifruit, and A. hilaris (Lycosidae) in both apples and vineyards. Sixteen of the 31 (51.6%) species found were introduced, 9 (29%) were endemic to New Zealand, two species (6.4%) were native to New Zealand, and four (12.9%) of unknown status.
Pitfall trap sampling captured more Linyphiidae and Lycosidae than active timed sampling or sweep netting, whereas active timed sampling caught more Araneidae and Theridiidae, particularly at night. Linyphiidae and Lycosidae are mostly ground-dwelling and Lycosidae are active hunters. Araneidae and Theridiidae are nocturnal web-building spiders and generally occupy the canopy. Araneidae move into the middle of the web after nightfall, making for easy detection and collection. Sweep netting caught only 40 specimens across all three locations, which was only 2.8% of the total catch. It was, however, the dominant sampling method for catching Oxyopidae (lynx spiders, New Zealand native), with a total of 11 specimens caught sweep netting. A few (6) Oxyopidae juveniles were also caught in active aerial sampling (day and night) sampling in Motueka apples.
Pitfall trap catch was lower in Kerikeri kiwifruit orchards than in Motueka apple orchards and Waipara vineyards. Rather than highlighting a difference in spider abundance in these systems, this was probably due to the different style of pitfall traps used in the different locations. The pitfall traps in Kerikeri kiwifruit had a funnel placed over a jar, which is likely to have allowed many spiders encountering the trap to evade the MPG by crawling out, possibly assisted by silk thread (Topping Citation1993). In Waipara and Motueka, an open cup was used so that as long as no vegetation or debris was dropping down into the cup, spiders encountering the trap would immediately fall into the pitfall trap.
The sampling episodes differed in crop type (vineyards, apples, kiwifruit), location (GPS 43.07, 172.75; GPS 41.11, 173.01; and GPS 35.23, 173.95), and sampling dates (January, February, May) because of New Zealand Government COVID-19 travel restrictions at the time of this study. The multiple confounding factors do make it difficult to determine whether differences observed in spider biodiversity were due to crop type, geographic location, or time of year. However, as no previous studies have been published on spiders in horticultural systems in New Zealand, this study still provides novel and important information on spider biodiversity.
The published studies of spiders in New Zealand crop ecosystems have been predominantly in arable crop or pasture systems (McLachlan and Wratten Citation2003; Vink et al. Citation2004; Curtis Citation2019) with just two studies in carrots (Berry et al. Citation1996; Sivasubramaniam et al. Citation1997) and one in common beans (Hodge and Vink Citation2000). These previous studies have predominantly found Linyphiidae and Lycosidae. The current study did find a large number of Linyphiidae and Lycosidae, but also a larger number of Araneidae and Theridiidae. As pastures and cereal crops have little habitat for canopy dwellers (as they lack a canopy), the comparative absence of Araneidae and Theridiidae makes sense.
Vink et al. (Citation2004) found 20 spider species and one harvestmen species (also P. opilio) associated with cereal crops in Canterbury, New Zealand. Thirteen of the 20 (65%) spider species found were endemic to New Zealand. The most abundant spider was an introduced linyphiid, T. tenuis. McLachlan and Wratten (Citation2003) suction sampled pasture crops and adjacent shelter belts in Canterbury and found 13 spider species in the pasture and 25 species in the shelter belts. Similarly to the previous study, 13 of the spider species found were endemic to New Zealand, and the dominant spider species caught was identified as T. tenuis. Curtis (Citation2019) also sampled pasture crops in Canterbury, but used several sampling techniques (pitfall traps, ground hand collection, suction sampling, sweeping). T. tenuis was again the dominant spider species caught, and a total of 28 spider species were collected. Topping and Lövei (Citation1997) compared exotic versus native spiders collected from agroecosystems and tussock grassland in New Zealand. The authors found a large difference in spider community assemblage between the two ecosystems. All species (100%) collected from tussock grassland were endemic to New Zealand, and only one of the species found in tussock grassland was also found in the nearby agroecosystem. At the agricultural sites sampled, 62.5% were exotic compared with 37.5% endemic. The authors suggest the poor dispersal power of New Zealand native spider species could explain the lack of invasion into the highly modified and more frequently disturbed agroecosystems. Other factors found to influence the colonisation of agroecosystems by spiders include habitat suitability and structure, prey availability, interspecific competition and competitive ability, and the presence of conspecifics (Marshall et al. Citation2000; Haddad et al. Citation2005; Hogg and Daane Citation2018).
Only 302 out of 1359 (22.2%) spider specimens caught in the current study were adults. The percentage that were adults did vary with both location and sampling method. For example, in the pitfall traps samples, 216 out of 441 (49%) were adults. Curtis (Citation2019) found 50% of spider specimens caught in dairy and cropping pastures in Canterbury from February to May were adults, and 54.7% in the pitfall samples. Topping and Lövei (Citation1997) sampled nine agricultural habitats near Bulls, New Zealand, from December to February using pitfall traps and D-Vac suction sampling and collected 418 adults out of 2213 specimens (18.9%). In a study of spider communities in New Zealand native alpine grasslands, Malumbres-Olarte et al. (Citation2013) used turf extraction and pitfall traps to collect 14,465 spider specimens, of which 2119 were adults (14.6%). In their pitfall samples, 1137 out of 3634 spider specimens were adults (31.3%).
The percentage of adults caught in this current study fits within the range of percentages of adults found in these other New Zealand spider studies. This ratio could be dependent on time of year, crop type, environmental health of the ecosystem sampled, or time after last spray etc. By reporting the numbers in detail, we hope to begin to observe patterns that may inform biodiversity conservation and land management decisions.
Perennes et al. (Citation2023) developed a model to describe potential pest control ecosystem services provided by arthropods, including spiders, in agricultural systems. The authors argue that this model supports the design of ‘habitat improvement, biodiversity conservation and the increase of ecosystem services supply’ to support the reduction in pesticide use in agricultural ecosystems by increasing effective ecosystem service provider populations. For the model to work, the authors highlight that sufficient data on species present in the systems studied are essential. Pearce and Venier (Citation2006) also highlight the need for more quantitative spider studies in different geographic regions and ecosystems. This current study provides the first important step in describing the harvestmen and spider families and species found in three economically important New Zealand horticultural systems, to help further the effective use of biodiversity and the ecosystem services these invertebrates can provide, particularly in a low-residue horticultural ecosystem.
Author contribution statement
NS, CV, AB, JS and AM conceived and designed research. NS conducted sampling. NS and CV conducted specimen identifications. RB analysed data. NS wrote the manuscript. All authors read and approved the manuscript.
StatTables 18_7_23
Download MS Word (34.2 KB)Supplementary Figure 3
Download JPEG Image (677.8 KB)
Supplementary Figure 1
Download JPEG Image (555.8 KB)
Supplementary Fig 2 Species accumulation curves
Download JPEG Image (164.8 KB)
Supplementary Figure 2
Download JPEG Image (935.5 KB)
Acknowledgements
The authors acknowledge the landowners for allowing research to be conducted on their land. We thank Rebecca Campbell, Tom Sullivan, Jessica Vereijssen, Lisa Watkins, Jonty Coulson, Roger Wallis, Jacqui Todd and Joanne Poulton for their assistance during field work. We thank Andrew Twidle, Andrew McLachlan, and two anonymous reviewers for helpful reviews of an earlier manuscript version. This research was funded by The New Zealand Institute for Plant and Food Research Limited through an MBIE Strategic Science Investment Fund.
Disclosure statement
No potential conflict of interest was reported by the author(s).
Additional information
Funding
References
- Argañaraz CI, Rubio GD, Rubio M, Castellarini F. 2020. Ground-dwelling spiders in agroecosystems of the Dry Chaco: a rapid assessment of community shifts in response to land use changes. Biodiversity. 21(3):125–135. doi:10.1080/14888386.2020.1831605.
- Berry NA, Wratten SD, McErlich A, Frampton C. 1996. Abundance and diversity of beneficial arthropods in conventional and “organic” carrot crops in New Zealand. N Z J Crop Hortic Sci. 24(4):307–313. doi:10.1080/01140671.1996.9513967.
- Bird SL, Esterly DM, Perry SG. 1996. Off-target deposition of pesticides from agricultural aerial spray applications. J Environ Qual. 25(5):1095–1104. doi:10.2134/jeq1996.00472425002500050024x.
- Birkhofer K, Djoudi EA, Schnerch B, Michalko R. 2022. Climatic conditions and functional traits affect spider diets in agricultural and non-agricultural habitats worldwide. Ecography. 2022(3):e06090. doi:10.1111/ecog.06090.
- Bolz H, Sieke C, Michalski B, Schäfer RB, Kubiak R. 2022. Spray drift-based pesticide residues on untreated edible crops grown near agricultural areas. J Consumer Protect Food Safety. 17(1):21–31. doi:10.1007/s00003-021-01355-9.
- Bowden JJ, van der Meer B, Moise ERD, Johns RC, Williams M. 2002. Not just for the birds: spiders as natural enemies of spruce budworm (Choristoneura fumiferana. Clem.). J Appl Entomol. 147:176–180. doi:10.1111/jen.13096.
- Coddington JA, Young LH, Coyle FA. 1996. Estimating spider species richness in a southern Appalachian cove hardwood forest. J Arachnol. 24(2):111–128.
- Curtis K. 2019. Operation COBRA: developing a new protocol for measuring spider biodiversity in New Zealand pastures. Lincoln University.
- Dubuis P-H, Droz M, Melgar A, Zürcher UA, Zarn JA, Gindro K, König SLB. 2023. Environmental, bystander and resident exposure from orchard applications using an agricultural unmanned aerial spraying system. Sci Total Environ. 881:163371. doi:10.1016/j.scitotenv.2023.163371.
- Fitzgerald BM, Sirvid PJ. 2004. Notes on the genus Phycosoma Cambridge, 1879, senior synonym of Trigonobothrys Simon, 1889 (Theridiidae: Araneae). Tuhinga. 15(7):12.
- Forster R, Forster L. 1999. Spiders of New Zealand and their worldwide kin. Dunedin: University of Otago Press.
- Geldenhuys M, Gaigher R, Pryke JS, Samways MJ. 2022. Vineyards compared to natural vegetation maintain high arthropod species turnover but alter trait diversity and composition of assemblages. Agric Ecosyst Environ. 336:108043. doi:10.1016/j.agee.2022.108043.
- GenStatCommittee. 2022. The Guide to the GenStat Command Language (Release 21) – Part 1: Syntax and Data Managment. Hemel Hempsted, UK: VSN International; pp. 514
- Gontijo LM. 2019. Engineering natural enemy shelters to enhance conservation biological control in field crops. Biol Control. 130:155–163.
- Haddad CR, Dippenaar-Schoeman AS, Pekar S. 2005. Arboreal spiders (Arachnida: Araneae) in pistachio orchards in South Africa. Afr Plant Prot. 11(1):32–41. doi:10.10520/EJC87786.
- Hambäck PA, Cirtwill AR, García D, Grudzinska-Sterno M, Miñarro M, Tasin M, Yang X, Samnegård U. 2021a. More intraguild prey than pest species in arachnid diets may compromise biological control in apple orchards. Basic Appl Ecol. 57:1–13. doi:10.1016/j.baae.2021.09.006.
- Hambäck PA, Porcel M, Tasin M, Samnegård U. 2021b. Predatory arthropod community composition in apple orchards: orchard management, landscape structure and sampling method. J Appl Entomol. 145(1-2):46–54. doi:10.1111/jen.12832.
- Hodge S, Vink CJ. 2000. An evaluation of Lycosa hilaris as a bioindicator of organophosphate insecticide contamination. N Z Plant Prot. 53(0):226–229. doi:10.30843/nzpp.2000.53.3693.
- Hogg BN, Daane KM. 2018. Aerial dispersal ability does not drive spider success in a crop landscape. Ecol Entomol. 43(5):683–694. doi:10.1111/een.12641.
- Hogg BN, Wang XG, Mills NJ, Daane KM. 2014. Resident spiders as predators of the recently introduced light brown apple moth, Epiphyas postvittana. Entomol Exp Appl. 151(1):65–74. doi:10.1111/eea.12168.
- Liu J, Sun L, Fu D, Zhu J, Liu M, Xiao F, Xiao R. 2022. Herbivore-induced rice volatiles attract and affect the predation ability of the wolf spiders, Pirata subpiraticus and Pardosa pseudoannulata. Insects. 13(1):90.
- Magurran AE. 2004. Measuring biological diversity. Oxford, UK: Blackwell Publishing; p. 1-256.
- Malumbres-Olarte J, Vink CJ, Ross JG, Cruickshank RH, Paterson AM. 2013. The role of habitat complexity on spider communities in native alpine grasslands of New Zealand. Insect Conservation and Diversity. 6(2):124–134. doi:10.1111/j.1752-4598.2012.00195.x.
- Marshall SD, Walker SE, Rypstra AL. 2000. A test for a differential colonization and competitive ability in two generalist predators. Ecology. 81(12):3341–3349. doi:10.1890/0012-9658(2000)081[3341:ATFADC]2.0.CO;2.
- McCullagh P, Nelder JA. 1989. Generalized linear models. London: Chapman & Hall; p. 511 + xix.
- McLachlan ARG, Wratten SD. 2003. Abundance and species richness of field-margin and pasture spiders (Araneae) in Canterbury, New Zealand. N Z J Zool. 30(1):57–67. doi:10.1080/03014223.2003.9518324.
- Michálek O, Gajski D, Pekár S. 2022. Winter activity of Clubiona spiders and their potential for pest control. J Therm Biol. 103295. doi:10.1016/j.jtherbio.2022.103295.
- Michalko R, Mifková T, Pekár S. 2021. Seasonal dynamics of prey utilization and individual specialization in a generalist spider in a pear orchard. Biol Control. 163:104763. doi:10.1016/j.biocontrol.2021.104763.
- Michalko R, Pekar S, Entling MH. 2019. An updated perspective on spiders as generalist predators in biological control. Oecologia. 189(1):21–36. doi:10.1007/s00442-018-4313-1.
- Mishra A, Kumar B, Rastogi N. 2022. Do the food availability conditions influence the stage-specific prey choice and predation attributes of agroecosystem-inhabiting spiders? Trop Ecol. doi:10.1007/s42965-022-00222-4.
- Paquin P, Vink CJ, Dupérré N. 2010. Spiders of New Zealand: annotated family key and species list. Manaaki Whenua Press, Landcare Research.
- Pearce JL, Venier LA. 2006. The use of ground beetles (Coleoptera: Carabidae) and spiders (Araneae) as bioindicators of sustainable forest management: a review. Ecol Indicators. 6(4):780–793. doi:10.1016/j.ecolind.2005.03.005.
- Perennes M, Diekötter T, Hoffmann H, Martin EA, Schröder B, Burkhard B. 2023. Modelling potential natural pest control ecosystem services provided by arthropods in agricultural landscapes. Agric Ecosyst Environ. 342:108250. doi:10.1016/j.agee.2022.108250.
- Selden PA. 2017. Arachnids. In: Reference module in life sciences. Elsevier.
- Sirvid P, Zhang ZQ, Harvey M, Rhode BE, Cook DR, Bartsch I, Staples D. 2010. Phylum Arthropoda, Chelicerata, horseshoe crabs, arachnids and sea spiders; 50–89.
- Sivasubramaniam W, Wratten SD, Klimaszewskl J. 1997. Species composition, abundance, and activity of predatory arthropods in carrot fields, Canterbury, New Zealand. N Z J Zool. 24(3):205–212. doi:10.1080/03014223.1997.9518115.
- Steven D, Barnett SW, Stevens PS, McKenna CE. 1997. Changing pest control on New Zealand kiwifruit. Acta Hortic. 444: 765–772.
- Suckling DM, Walker JTS, Wearing CH. 1999. Ecological impact of three pest management systems in New Zealand apple orchards. Agric Ecosyst Environ. 73(2):129–140. doi:10.1016/S0167-8809(99)00022-5.
- Sullivan NJ, Bell VA, Butler RC, Wallis R, Ramesh R, Reddy DS, Twidle AM, Bunn B, Unelius CR, Manning L-AM, Suckling DM. 2022. Developing a mealybug pheromone monitoring tool to enhance IPM practices in New Zealand vineyards. J Pest Sci. doi:10.1007/s10340-022-01504-5.
- Sunderland K. 1999. Mechanisms Underlying the Effects of Spiders on Pest Populations. J Arachnol. 27(1):308–316.
- Topping CJ. 1993. Behavioural responses of three linyphiid spiders to pitfall traps. Entomol Exp Appl. 68(3):287–293. doi:10.1111/j.1570-7458.1993.tb01715.x.
- Topping CJ, Lövei GL. 1997. Spider density and diversity in relation to disturbance in agroecosystems in New Zealand, with a comparison to England. N Z J Ecol. 21(2):121–128.
- Vanneste JL. 2012. Pseudomonas syringae pv. actinidiae (Psa): a threat to the New Zealand and global kiwifruit industry. N Z J Crop Hortic Sci. 40(4):265–267. doi:10.1080/01140671.2012.736084.
- Vink CJ, Sirvid PJ. 1998. The Oxyopidae (lynx spiders) of New Zealand. N Z Entomol. 21(1):1–9. doi:10.1080/00779962.1998.9722034.
- Vink CJ, Teulon DAJ, McLachlan ARG, Stufkens MAW. 2004. Spiders (Araneae) and harvestmen (Opiliones) in arable crops and grasses in Canterbury, New Zealand. N Z J Zool. 31(2):149–159. doi:10.1080/03014223.2004.9518368.
- Wilson VB A. 2020. Evaluating the impact of sooty mould in New Zealand: retrospective report by Scarlatti for Zespri. 2020; p. 17.
- Zhang ZQ. 1992. The natural enemies of Aphis-gossypii glover (Hom, aphididae) in China. J Appl Entomol – Zeitschrift Fur Angewandte Entomologie. 114(3):251–262. doi:10.1111/j.1439-0418.1992.tb01124.x.