
ABSTRACT
Invasive species threaten biodiversity in Aotearoa New Zealand. In wetlands − significant sites that provide an array of ecosystem and cultural services but represent <10% of their original extent − invasive species can affect hydrological function, nutrient regimes and overall ecological functionality. Environmental DNA (eDNA) has emerged as a valuable biomonitoring technique for cataloguing biodiversity and detecting biological incursions, but little is known about how biodiversity varies in wetlands over fine and broad spatial scales. Here, we examined the publicly available eDNA database of Wilderlab New Zealand, retrieving data from 26 sites across the country to characterise taxonomic diversity patterns, including the extent of exotic and non-exotic (native and endemic) species. We found significant spatial variation in biodiversity – even among neighbouring sites – and a pattern whereby all sites had ≥50% exotic species in their total species tally. Our results provide new information on the current state of wetland biodiversity in Aotearoa New Zealand and highlight the value of eDNA databases for generating new insights from publicly shared data. They also emphasise an urgent need for greater resource allocation to conservation and restoration initiatives in Aotearoa New Zealand that will ensure the persistence of treasured native and endemic wetland species.
Introduction
Concern regarding global change and alarming associated declines in biodiversity is escalating (Hohenlohe et al. Citation2021). Many species face numerous threats, including habitat loss and fragmentation, invasive species, disease, hunting and climate change (Hohenlohe et al. Citation2021; Forsdick et al. Citation2022). Among these, invasive species – organisms that expand demographically and spatially beyond their native range – pose a significant threat (Goldson et al. Citation2015), with a recent report from the United Nations Intergovernmental Science-Policy Platform on Biodiversity and Ecosystem Services estimating their global economic impact in 2019 at US$423 billion (Roy et al. Citation2023). Though this included management costs of just 8% (with the remaining 92% incurred from other factors, such as disease transmission and agricultural crop losses) early detection of invasive species increases successful control, minimises spread and ecological impact, and is more cost-effective than long-term management of established and widespread populations (Vander Zanden et al. Citation2010). Thus, methods that facilitate early detections of new incursions are important (Reaser et al. Citation2020), particularly in isolated landmasses with unique biodiversity.
The isolation of Aotearoa New Zealand from other significant landmasses resulted in a distinctive flora and fauna with high levels of endemism (Wallis and Trewick Citation2009). However, an initial absence of mammalian predators left native animals and plants ill-equipped for their later invasion (Atkinson Citation2001; Gibbs Citation2009). Over contemporary time scales (1968–2020), biological invasions in Aotearoa New Zealand have resulted in an estimated US$69 billion in economic damage and management costs (Bodey et al. Citation2022).
Among Aotearoa New Zealand’s unique ecosystems, wetlands are areas that encompass the interface between land and a water body and harbour specialised flora and fauna (Sorrell and Gerbeaux Citation2004; Ausseil et al. Citation2011b). They provide numerous ecosystem services, such as maintaining water quality and flood control (Clarkson et al. Citation2013), and provide cultural and recreational resources (Harmsworth Citation2021). With their shallow water bodies located in depressions, wetlands are sensitive to shifts in nutrient and sediment inputs. Consequently, they are prone to rapid transformations in response to hydrological and nutrient disturbances (Sorrell and Gerbeaux Citation2004) that alter both species’ compositions (Ausseil et al. Citation2011b) and ecological processes (Ausseil et al. Citation2008). For example, floodplain habitats serve as spawning grounds for invasive fish, such as common carp (Cyprinus carpio) and goldfish (Carassius auratus), that are notorious for disturbing and mobilising fine sediment and thereby altering freshwater ecosystems (Wu et al. Citation2013).
Invasive species are a pervasive issue in the wetlands of Aotearoa New Zealand. Coupled with a reduction of >90% in the original extent of wetland coverage (Ausseil et al. Citation2011a), invasives pose a significant threat to the persistence of indigenous species – altering ecosystem composition, structure and function (e.g. the grey willow, Salix cinerea; Griffiths et al. Citation2018). Introduced mammals are also frequently reported to depredate wetland birds (O'Donnell et al. Citation2015).
Quantifying the effects of invasive species in wetlands requires an ability to characterise broader aspects of the ecosystem’s intactness and resilience (Hill et al. Citation2022). One metric is the ecological integrity (EI) index, which quantifies human pressures on wetland ecosystems by considering the wetland’s drainage, naturalness of catchment cover and extent of artificial impervious cover, nutrient enrichment and introduced fish and woody plants (Ausseil et al. Citation2008). However, the EI index does not include the effects of mammalian pests, herbaceous weeds, or exotic invertebrates due to a lack of spatial data of this nature, and obtaining information on all of the relevant predictor variables that are included in the EI calculation can be challenging. For example, little is known about how distributions of both exotic and non-exotic (i.e. native and endemic) species vary in wetlands over fine and broad spatial scales. Other resources, like the Wetland Restoration Handbook (Peters and Clarkson Citation2010) and the Wetland Cultural Health Indicator (Robb Citation2014), offer comprehensive guidelines that support monitoring and restoration efforts in wetlands. However, environmental DNA (eDNA; genetic material shed by organisms into the environment) is a time-efficient biomonitoring technique that is gaining popularity for monitoring and surveying biodiversity (Beng and Corlett Citation2020).
eDNA can detect rare and endangered species – even when their populations are relatively sparse – and can out-perform traditional survey methods in detection capability with less associated time and labour (Franklin et al. Citation2019; Shelton et al. Citation2019; Takahara et al. Citation2020; Neice and McRae Citation2021). It is also useful for detecting invasive species. For example, the gold clam (Corbicula fluminea) was later found to have been detectable in reanalysed eDNA samples collected prior to its recent discovery in Aotearoa New Zealand’s Waikato River (Wilderlab New Zealand Citation2023). Finally, the relative ease of collecting makes eDNA amenable for use by citizen scientists, fostering community engagement with the environment (Goldson et al. Citation2015).
In this study, we examined a publicly available eDNA database established by Wilderlab New Zealand (https://www.wilderlab.co.nz/explore) − a commercial provider of eDNA services − and contributed to by academic and citizen scientists since 2019. Our objectives were to: (1) demonstrate the value of repurposing public data; (2) identify spatial biodiversity patterns across the country; and (3) examine the proportion of exotic and non-exotic species across each wetland site.
Material and methods
Site selection and data generation
Multi-species DNA metabarcoding data from 18 wetland locations (as classified by the sample submitter) were downloaded from Wilderlab New Zealand's public database. eDNA for all samples was extracted from water and samples were obtained between 2019 (Wilderlab New Zealand Ltd) and August 2022. Seven of these wetland locations included >1 sampling site, bringing the total number of individual sites to 28. The geographic location for all sites was cross-checked using Google Earth's aerial imagery and roadside view to ensure the eDNA samples were taken from a wetland environment. The wetland type (e.g. bog, fen, swamp, marsh, dune) was determined based on client self-reporting, Google Earth’s aerial imagery and roadside view, or websites established by government bodies or trusts. The Wilderlab dataset included DNA matches from all taxonomic ranks, which were filtered to retain only those sequences for which species and/or genus level identification could be determined. After reviewing the locations against this criteria, two sites were removed, leaving a final total of 16 locations (26 sites; and ). This included a single site that we were unable to confirm the precise location of (located in the upper North Island and referred to as ‘ANO’ for anonymous hereafter). Notably, we analysed public data that we did not collect ourselves, thus iwi consultation prior to research and sample collection lies with individual researchers and/or with Wilderlab.
Table 1. A summary of wetland locations used in this study, presented in geographical order (from the north of the North Island to the south of the South Island), including site code, latitude and longitude, sample collection date, the number of sites within each location, the number of eDNA replicates filtered, volume of water filtered (mL), and metabarcoding assay used.
Table 2. The wetland type, a brief site description, and ecological integrity (EI) index values (if known) observed from Ausseil et al. (Citation2008) for wetland locations used in this study, presented in geographical order (from the north of the North Island to the south of the South Island).
Because samples were collected by many different individuals or groups, there are naturally differences among sites in collection aspects, including the number of sampling sites, the number of replicate samples taken, the volume of water filtered, and the type of eDNA metabarcoding assay performed (see ). In the latter case, six sites used the ‘basic’ assay panel while the rest used the ‘comprehensive’ metabarcoding assay panel. These two assay panels differ in the number of primer combinations used, with different primers targeting different taxonomic groups and four primer pairs (targeting aquatic insects, vertebrates and fish) common to both assays (Table A1). We took steps in our analyses to examine or account for these differences among sites (see below). Following sample collection, the DNA extraction, amplification procedures and the bioinformatic pipeline – i.e. to convert sequence reads to amplicon sequence variants (ASVs): effectively zero-radius operational taxonomic units or OTUs, which allow the assignment of taxonomic identity to sequence reads – were performed consistently across samples by Wilderlab. For further details on laboratory and computational methods, see Wilkinson (Citation2023).
Determination of species’ status
To understand how native and non-native species are distributed across Aotearoa New Zealand wetlands, we first classified all species (n = 319) identified from the Wilderlab database that formed our dataset. We used the classifiers ‘exotic’ or ‘non-exotic’ for consistency with public databases and to minimise the anomalies in invasion biology terminology (Blackburn et al. Citation2011). Here, we consider an exotic species to be an organism that was introduced by humans to Aotearoa New Zealand from outside its native geographic range, and non-exotic species to include both native and endemic species. The former classification encompasses both invasive species, which have economic (Diagne et al. Citation2021) and environmental impacts (Doherty et al. Citation2016), and non-native species, which have become naturalised with possible benign effects (Schlaepfer et al. Citation2011). We primarily used the New Zealand Organisms Register (NZOR; https://www.nzor.org.nz/search) and iNaturalistNZ (https://inaturalist.nz/) to make these classifications. Additional databases used included Biota of New Zealand (https://biotanz.landcareresearch.co.nz/), Plants of the World Online (https://powo.science.kew.org/), New Zealand Birds Online (https://www.nzbirdsonline.org.nz/) and New Zealand Plant Conservation Network (https://www.nzpcn.org.nz/). In cases where the species could not be classified initially, broader search terms that included the generic name and the term ‘native range’ were employed in Google’s search engine to further attempt to define exotic/non-exotic status. We were ultimately able to classify the biostatus of 264 species, leaving 55 with an unknown status, which we excluded from the majority of our analyses (see below) (Table A2).
Data analysis
Because the total volume of water filtered and the total number of replicates taken varied per site, we first wanted to understand if either of these variables were correlated with (i) the number of taxa detected at the species level at each site; and (ii) the number of absolute eDNA read count at each site. Thus, we performed four separate Pearson’s product correlation tests using the cor.test function in R v.2023.06.1 + 524 (R Core Team Citation2023). Sites MAT, KAW 1–3, and OLD were excluded from the former analyses due to their unknown total volumes of water filtered.
To examine differences in biodiversity across three broad Aotearoa New Zealand regions [defined as: ‘upper North Island’ (locations TAA – PON) and ‘lower North Island’ (WKU – OUT) – based on relative position being above or below Lake Taupō, and ‘South Island’ (HOR – RAK)] and at the finer scale of 26 wetland sites, non-metric multidimensional scaling (nMDS) plots were generated using the vegan::metaMDS function from the vegan v.2.6-4 package (Oksanen et al. Citation2022) in R. We used default parameters, including Bray–Curtis dissimilarity with autotransform = FALSE. Subsequently, permutational multivariate analysis of variance (PERMANOVA) and permutational multivariate analysis of dispersion (PERMDISP) were performed using the adonis function from vegan to examine statistical support for differentiation among the different wetland regions/sites.
To understand variation in taxonomy across space, we used the eDNA read count to calculate the proportion of counts for each phyla relative to the total counts at that site for each site. We also examined the presence of non-exotic species across Aotearoa New Zealand by mapping the proportion of exotic and non-exotic taxa (i.e. the number of exotic/non-exotic species divided by the total number of species) at each site. In the latter case, to account for differences in sampling across sites (see above), we first subset the full dataset into two additional datasets: (i) only sites for which the comprehensive assay panel was performed; (ii) only taxa from the three groups that both metabarcoding assay panels detected (i.e. aquatic insects, vertebrates and fish). We then identified the top 10 exotic and non-exotic species across all datasets, ranking species according to their eDNA read count to calculate the percentage of each species present relative to the total eDNA read count for each site. We present the results of the comprehensive-only dataset in the main text, and provide the results for the other datasets in the Supplementary.
Results
Sampling effects
The total volume of water filtered was not positively correlated with either the number of taxa detected at the species level (r = 0.394; d.f. = 19; P = 0.077) or the number of absolute eDNA reads (r = 0.249; d.f. = 19; P = 0.277). However, the number of replicates taken per site was positively correlated with these variables (r = 0.445; d.f. = 24; P = 0.023 for number of taxa detected at the species level; r = 0.708; d.f. = 24; P < 0.001 for the number of absolute eDNA reads).
Spatial biodiversity differences
nMDS analysis identified spatial differences in DNA sequence composition among wetland sites, with the upper North Island showing more variation than the lower North Island, and South Island wetlands clustering outside the main group (A). These differences were statistically significant (F2,23 = 1.4104; P = 0.001; PERMANOVA; F2,23 = 13.572; P = 0.001; PERMDISP) for all pairwise comparisons among the three regions (P < 0.001 for upper North vs. lower North Island, P < 0.001 for upper North vs. South Island and P < 0.001 for lower North vs. South Island).
Figure 1. nMDS plot comparing DNA sequence composition among wetland sites: (A) For broad Aotearoa regions – upper (locations TAA – PON) and lower North Island (WKU – OUT), and South Island (HOR – RAK); and (B) For all 26 individual sites. Locations are presented in the key in geographical order (from the north of the North Island to the south of the South Island).
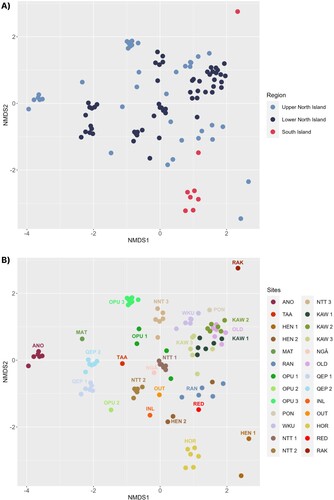
For individual sites, the nMDS plot showed a general pattern in which samples from wetlands in close geographical proximity (e.g. KAW, OLD, NGĀ and NTT) typically clustered together (B). Exceptions to this included RED and RAK wetlands (1.6 km apart), which clustered separately despite their neighbouring locations (B and A1). Multiple samples collected from the same wetland system exhibited high similarities for some sites (e.g. KAW 1 and KAW 2; QEP 1 and QEP 2), and significant dissimilarities for others (e.g. OPU 1–3) (B).
Analyses of the proportions of taxonomic phyla at each wetland showed high overall variation in biodiversity among sites ( and A2). The top five phyla across all sites were Annelida, Arthropoda, Chordata, Cnidaria, and Streptophyta. However, a notable difference when comparing the North and South Islands was that none of the South Island wetlands contained Streptophyta, while HOR (South Island) was the only wetland where the proportion of Bacillariophyta exceeded 1%. Moreover, ANO and MAT (upper North Island) showed the highest proportions of annelids (84.4% at ANO) and chordates (99.7% at MAT), while RAK (South Island) had the highest proportion of arthropods (94.3%). A difference among the North Island clusters was the greater variation of phyla in the lower North Island compared to the upper North Island when considering proportions >1%. For example, the primary phyla within the upper North Island wetlands were Annelida, Arthropoda, Chordata, and Streptophyta, while the lower North Island included these phyla but also harboured Mollusca and Cnidaria.
Figure 2. Map of each wetland location, with pie graphs indicating the proportion of each phylum represented (phyla proportions <1% were merged into a single ‘other’ category; these are described in full in Table A3). Note that the ANO site was left off (see Methods) and is presented in Figure A2.
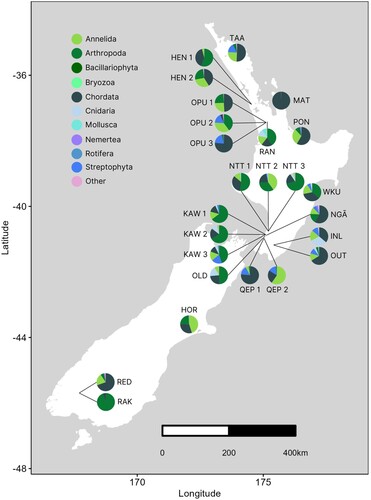
Even samples from wetlands in close geographical proximity demonstrated subtle differences when considering phyla proportions >1%. For instance, RAN and OPU 1–3 (6 km apart, upper North Island) displayed varying proportions of Chordata, Arthropoda, and Annelida but the OPU sites included Streptophyta, while RAN had Cnidaria and Mollusca. Similarly, NGĀ and OLD (2.9 km apart, lower North Island) had varying proportions of Annelida, Arthropoda, Chordata, and Cnidaria but only NGĀ contained Nemertea and Streptophyta. In the South Island, RAK was dominated by Arthropoda (as outlined above) and Chordata (5.7%), while the neighbouring RED wetland (1.6 km away) had a much higher proportion of Chordata (69.7%), only 6.2% Arthropoda, and low representation from Annelida (21.2%) and Nemertea (1.6%) (B).
Biostatus and invasive species extent
We were able to classify biostatus for 264 species, including 102 non-exotic species (48 endemic and 54 natives) – note that one DNA sequence was identified as either Anas chlorotis or A. gracilis (brown or grey teal), with the former classed as endemic and the latter as native; therefore, these species were excluded in the full dataset count – and 161 exotic species (Table A2). Annelida and Arthropoda accounted for over half of the 55 species we were unable to confirm biostatus for (n = 15 and 16, for Annelida and Arthropoda, respectively) – suggesting that we may know less about those groups – while the remaining unclassified phyla included Bacillariophyta, Chlorophyta, Cnidaria, Discosea, Gastrotricha, Nemertea, Oomycota, Platyhelminthes, Rhodophyta and Rotifera, and the class Chrysophyceae (Table A2).
All locations harboured ≥50% exotic species (A). ANO and OPU 2 completely lacked any non-exotic species, though the number of species differed between the two wetlands, with eight and 17 exotic species at ANO and OPU 2, respectively. Samples from spatially distant wetlands HEN 1 (n = 15), NGĀ (n = 66), HOR (n = 48) and RAK (n = 9) each exhibited 67% exotic species and 33% non-exotic species. PON (n = 20) and NTT 1 (n = 40) samples were dominated by 75% exotic species (A).
Figure 3. (A) Map of each wetland location, with pie graphs indicating the proportion of exotic versus non-exotic species. See Figure A3 for pie graphs of exotic versus native versus endemic ratio. Additional panels show the top 10 (B) exotic and (C) non-exotic (i.e. native or endemic) species across all wetland locations from the comprehensive dataset. Note that the ANO site was left off (see Methods) and is presented in Figure A3.
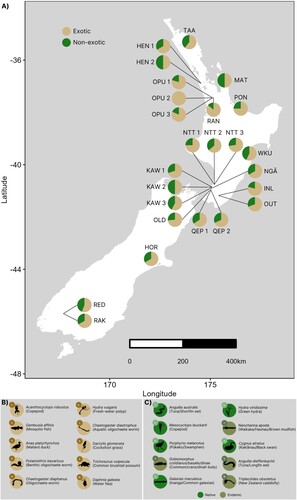
In the comprehensive dataset, the top 10 exotic species across all sampled sites included worms (n = 3), crustaceans (n = 2), a fish, a bird, a cnidarian, a plant, and a mammal. (B). Among these, Acanthocyclops robustus (copepod), Gambusia affinis (mosquito fish), and Anas platyrhynchos (mallard duck), were present at 17, five, and 14 of the 20 sites, respectively. Interestingly, the highest eDNA read count (for mosquito fish; n = 97,470 reads) was detected at OPU 3, while the remaining four sites that detected this species had much lower read counts (ranging from 2356–11,906). The top 10 list of non-exotic species (native and endemic) included five fish, two birds, a crustacean, a cnidarian, and an insect (C). Anguilla australis (tuna/short-finned eel), Mesocyclops leuckarti (copepod), and Porphyrio melanotus (pūkeko/swamphen) were observed at all, 11, and 15 of the 20 sites, respectively; Neochanna apoda (waikaka/hauhau/brown mudfish) and Triplectides obsoletus (New Zealand caddisfly) were each detected at only a single site (NTT 2 and NGĀ, respectively) (C). Comparing these results with the other two datasets (i.e. the ‘full’ and ‘aquatic insect/vertebrate/fish’ datasets; see Methods), we found that the top four or five species remained unchanged regardless of dataset, though there were some minor changes in the remaining species (Figure A4), with the latter dataset returning the same top 10 non-exotics species as the comprehensive dataset (i.e. B, C). Interestingly, P. melanotus was not detected in the South Island wetlands, despite it being found throughout the country near fresh or brackish waters (https://nzbirdsonline.org.nz/species/pukeko).
Discussion
We explored public eDNA records obtained from 16 locations to better understand spatial biodiversity patterns and the extent of exotic species across Aotearoa New Zealand wetlands. We found that patterns of phyla composition differed spatially and exotic species were present at all sites.
Environmental differences among sites are likely a key driver for signals of spatial biodiversity among wetlands, with variation in environmental features – such as water regime, substrate, nutrient status and pH (Clarkson and Peters Citation2012) – ultimately determining the composition of resident flora and fauna by selecting only those species that can tolerate the local abiotic conditions (Johnson and Gerbeaux Citation2004; Clarkson and Peters Citation2012). For example, certain plant species have specialised for wetland environments by adapting to wet and oxygen-deprived conditions (Sorrell and Gerbeaux Citation2004; Ausseil et al. Citation2011b). Also of importance is the extent of restoration and/or management operations, which can vary significantly among sites in both extent and effectiveness (Denyer and Peters Citation2020). In our study, eDNA samples collected from various wetland types (from swamp to coastal) and broad environmental regions showed spatial differences in biodiversity, even among proximate sites. For example, sites contained varying proportions of the top five phyla (i.e. Annelida, Arthropoda, Chordata, Cnidaria and Streptophyta), with some dominated by a specific phyla and others containing a plethora of phyla diversity. The composition and distribution of the top 10 exotic and non-exotic species also varied, with certain species found at all or most sites (e.g. Acanthocyclops robustus, Anguilla australis), and others detected at only one or a few locations (e.g. Neochanna apoda, Triplectides obsoletus).
Although we identified clear biodiversity differences among sites, there are some important caveats to consider. First, samples were collected by different individuals and groups who used different field sampling methodologies and different laboratory assay panels in their experimental designs – a potential shortcoming of meta-analyses that draw from different research teams, including citizen scientists. This restricted our inference scope, because sites where a greater volume of water was filtered and/or a greater number of replicates were taken may have detected a greater number of taxa. Though we found no significant correlations between these sampling variables and the number of taxa detected at species level or absolute eDNA read counts at each site, we did find significant correlations between these variables and the number of per-site replicates taken. These patterns are consistent with other research, where the volume of water within a single replicate did not significantly impact species detectability, but the number of replicates did have an impact (e.g. Willoughby et al. Citation2016; Melchior and Baker Citation2023). Nevertheless, we caution the reader that certain species may not have been detected at certain sites due to sampling extent. Perhaps exemplifying this, the pūkeko was unexpectedly only detected in eDNA samples from the North Island in this study.
Species presence/absence patterns emphasise a second important caveat in eDNA data that forms part of a wider ongoing discussion in the field regarding technical sampling limitations and eDNA's explicit ‘snapshot’ nature. In particular, detection of in situ eDNA can be affected by different DNA degradation and shedding rates, diffusion, transport and spatiotemporal dynamics (Ratsch et al. Citation2020; Ely et al. Citation2021; Troth et al. Citation2021), potentially leading to false negatives (failing to detect species of interest when they are present) and false positives (detecting species when they are absent) (Larson et al. Citation2020). There is also a strong reliance on reference databases to match unknown genetic sequences to taxonomic identifications, and these have gaps associated with cryptic, rare, and unsampled species, including those that only interact in a limited way with water bodies (Hotaling et al. Citation2021). Finally, eDNA is not (yet) generally capable of being translated into estimates of biomass or abundance, though this is an active area of research (e.g. Rourke et al. Citation2021).
While best practice eDNA collection guidelines are frequently becoming available (e.g. De Brauwer et al. Citation2022; Smith et al. Citation2023) and help to address some of the outlined limitations, the use of eDNA in wetland environments is less developed due to additional challenges associated with increased turbidity (with more filter clogging and therefore lower volumes of water often processed; Goldberg et al. Citation2018). Recent work has shown that the total volume of water processed, filter size, number of eDNA replicates and sampling sites, and timing of collection all impact biodiversity detection in wetlands (Bird et al. Citation2024); these factors may also reflect to some extent the similarity and dissimilarity identified between sites in this study.
Despite the noted limitations, our research suggests that wetlands of Aotearoa New Zealand are under serious threat. Indeed, > 60% of wetlands across the country had an EI index <0.5 in a 2008 study (Ausseil et al. Citation2008), and all of the 26 studied sites had at least 50% exotic species proportions in our study. With biological invasion forecasted to increase with climate change (Mainka and Howard Citation2010; Chown et al. Citation2014), the urgency for effective and efficient biodiversity monitoring measures that go alongside wetland restoration is clear. We have shown that, with due consideration to the associated caveats, eDNA is a promising addition to the biomonitoring toolbox. Our work highlights the potential of citizen science in eDNA to generate new insights into biodiversity dynamics and specific foci, such as the extent of invasive species presence across broad and fine geographic scales. Recent work has extended the application of eDNA data towards the development of a taxon-independent community index (TICI) for Wilderlab eDNA samples collected from Aotearoa New Zealand streams and rivers (Wilkinson et al. Citation2024). This index associates the presence of certain amplicon sequence variants (ASVs) with a ‘more’ or ‘less’ healthy ecosystem and is based on ecological approaches, such as the macroinvertebrate community index, or MCI (Stark and Maxted Citation2007). Using the TICI, the ecological health status of sites can be assessed, and before-versus-after eDNA sampling can elucidate the effects of restoration and management efforts using a single user-friendly metric (Wilkinson et al. Citation2024). Development of a TICI optimised for wetland environments is an additional advance we look forward to.
Author contribution statement
AM and SW conceived the research project. AM and SB designed the experimental analysis and SB analysed the data with guidance from AM. SB wrote the manuscript draft and revised the manuscript based on feedback from AM and SW.
Supplementary material: Figures
Download MS Word (2 MB)Supplementary material: Table
Download MS Excel (38.1 KB)Acknowledgements
The authors would like to acknowledge the Invasomics lab at the University of Waikato for helpful discussion of results.
Disclosure statement
No potential conflict of interest was reported by the author(s).
Data availability statement
Data are available at Wilderlab (https://www.wilderlab.co.nz/explore; accession numbers: 603456, 603161, 602697, 603227, 602353, 602509, 601982, 601772, 602406, 603499, 602000, 603082, 603498, 601570, 603118, 602725). All data files and R code required to reproduce the results in this manuscript are available at: https://github.com/invasomics/wetland_biodiversity.
References
- Atkinson IAE. 2001. Introduced mammals and models for restoration. Biological Conservation. 99(1):81–96. doi:10.1016/S0006-3207(00)00189-0.
- Ausseil A-G, Chadderton WL, Gerbeaux P, Stephens RTT, Leathwick JR. 2011a. Applying systematic conservation planning principles to palustrine and inland saline wetlands of New Zealand. Freshwater Biology. 56(1):142–161. doi:10.1111/j.1365-2427.2010.02412.x.
- Ausseil A-G, Dymond JR, Weeks ES. 2011b. Provision of natural habitat for biodiversity: quantifying recent trends in New Zealand. In: Grillo O, Venora G, editor. Biodiversity loss in a changing planet. Rijeka, Croatia: InTech; p. 201–220.
- Ausseil A-G, Gerbeaux P, Chadderton WL, Stephens T, Brown D, Leathwick J. 2008. Wetland ecosystems of national importance for biodiversity: Criteria, methods and candidate list of nationally important wetlands. Manaaki Whenua – Landcare Research. Landcare Research Contract Report LC0708/158. https://climateandnature.org.nz/wp-content/uploads/2021/04/Ausseiletal2008WONIwetlands_All_Final.pdf
- Barnes G, Martin A, Basheer G. 2001. Opuatia Wetland restoration plan. Waikato Regional Council. Environment Waikato Internal Series 2001/14.
- Beng KC, Corlett RT. 2020. Applications of environmental DNA (eDNA) in ecology and conservation: opportunities, challenges and prospects. Biodiversity and Conservation. 29(7):2089–2121. doi:10.1007/s10531-020-01980-0.
- Bird S, Dutton P, Wilkinson S, Smith J, Duggan I, McGaughran A. 2024. Developing an eDNA approach for wetland biomonitoring: insights on technical and conventional approaches. Environmental DNA. in press
- Blackburn TM, Pyšek P, Bacher S, Carlton JT, Duncan RP, Jarošík V, Wilson JRU, Richardson DM. 2011. A proposed unified framework for biological invasions. Trends in Ecology and Evolution. 26(7):333–339. doi:10.1016/j.tree.2011.03.023.
- Bodey TW, Carter ZT, Haubrock PJ, Cuthbert RN, Welsh MJ, Diagne C, Courchamp F. 2022. Building a synthesis of economic costs of biological invasions in New Zealand. PeerJ. 10:e13580. doi:10.7717/peerj.13580.
- Browne K, Campbell D. 2005. Ecohydrological characterisation of Opuatia Wetland and recommendations for future management. Waikato Regional Council. Environment Waikato Technical Report 2005/17. https://www.waikatoregion.govt.nz/assets/WRC/WRC-2019/tr05-17.pdf.
- Chown SL, Hodgins KA, Griffin PC, Oakeshott JG, Byrne M, Hoffmann AA. 2014. Biological invasions, climate change and genomics. Evolutionary Applications. 8:23–46. doi:10.1111/eva.12234.
- Clarkson B, Peters M. 2012. Wetland types. In: Peters M, Clarkson B, editor. Wetland restoration: A handbook for New Zealand freshwater systems. Lincoln: Manaaki Whenua Press; p. 26–37.
- Clarkson BR, Ausseil AGE, Gerbeaux P. 2013. Wetland ecosystem services. In: Dymond JR, editor. Ecosystem services in New Zealand: conditions and trends. Lincoln: Manaaki Whenua Press; p. 192–202.
- De Brauwer M, Chariton A, Clarke LJ, Cooper MK, DiBattista J, Furlan E, Giblot-Ducray D, Gleeson D, Harford A, Herbert S, et al. 2022. Environmental DNA protocol development guide for biomonitoring. Canberra: National eDNA Reference Centre. doi:10.25607/OBP-1853.
- Denyer K, Peters M. 2020. The root causes of wetland loss in New Zealand: An analysis of public policies and processes. National Wetland Trust of New Zealand. https://www.wetlandtrust.org.nz/wp-content/uploads/2021/02/ROOT-CAUSES-OF-WETLAND-LOSS-IN-NZ_Jan-2021.pdf.
- Diagne C, Leroy B, Vaissière A-C, Gozlan RE, Roiz D, Jarić I, Salles J-M, Bradshaw CJA, Courchamp F. 2021. High and rising economic costs of biological invasions worldwide. Nature. 592:571–576. doi:10.1038/s41586-021-03405-6.
- Doherty TS, Glen AS, Nimmo DG, Ritchie EG, Dickman CR. 2016. Invasive predators and global biodiversity loss. Proceedings of the National Academy of Sciences. 113(40):11261–11265. doi:10.1073/pnas.1602480113.
- Ely T, Barber PH, Man L, Gold Z. 2021. Short-lived detection of an introduced vertebrate eDNA signal in a nearshore rocky reef environment. PLoS One. 16(6):e0245314. doi:10.1371/journal.pone.0245314.
- Forsdick NJ, Adams CIM, Alexander A, Clark AC, Collier-Robinson L, Cubrinovska I, Dowgray MC, Dowle EJ, Duntsch L, Galla SJ, et al. 2022. Current applications and future promise of genetic/genomic data for conservation in an Aotearoa New Zealand context. Wellington (New Zealand): Department of Conservation. Science for Conservation 337. https://www.doc.govt.nz/globalassets/documents/science-and-technical/sfc337entire.pdf.
- Franklin TW, McKelvey KS, Golding JD, Mason DH, Dysthe JC, Pilgrim KL, Squires JR, Aubry KB, Long RA, Greaves SE, et al. 2019. Using environmental DNA methods to improve winter surveys for rare carnivores: DNA from snow and improved noninvasive techniques. Biological Conservation. 229:50–58. doi:10.1016/j.biocon.2018.11.006.
- Futter J. 2008. Baseline fish community surveys of the Rakatu Wetlands [diploma]. Dunedin, New Zealand: University of Otago.
- Gibbs GW. 2009. The end of an 80-million year experiment: A review of evidence describing the impact of introduced rodents on New Zealand's ‘mammal-free’ invertebrate fauna. Biological Invasions. 11(7):1587–1593. doi:10.1007/s10530-008-9408-x.
- Goldberg CS, Strickler KM, Fremier AK. 2018. Degradation and dispersion limit environmental DNA detection of rare amphibians in wetlands: increasing efficacy of sampling designs. Science of the Total Environment. 633:695–703. doi:10.1016/j.scitotenv.2018.02.295.
- Goldson S, Bourdôt G, Brockerhoff E, Byrom A, Clout M, McGlone M, Nelson W, Popay A, Suckling D, Templeton M. 2015. New Zealand pest management: current and future challenges. Journal of the Royal Society of New Zealand. 45(1):31–58. doi:10.1080/03036758.2014.1000343.
- Greater Wellington Regional Council. 2022 Jul. Queen Elizabeth Park [Brochure]. [accessed 2023 Oct 26]. https://www.gw.govt.nz/assets/Documents/2022/12/Queen-Elizabeth-Park-Brochure-2022-2.4_WEB.pdf.
- Griffiths J, Armstrong H, Innes R, Terry J. 2018. Can aerial herbicide application control grey willow (Salix cinerea L.) and stimulate native plant recovery in New Zealand wetlands? Ecological Management & Restoration. 19(1):49–57. doi:10.1111/emr.12299.
- Harmsworth G. 2021. Foreword. In: Taura Y, Van Schravendijk-Goodman C, Clarkson B, editor. Te reo o te repo – kei konei tonu au: The voice of the wetland – I am still here. Vol 2. Hamilton: Manaaki Whenua – Landcare Research; p. 101–112.
- Hill SLL, Harrison MLK, Maney C, Fajardo J, Harris M, Ash N, Bedford J, Danks FS, Guaras D, Hughes J, et al. 2022. The ecosystem integrity index: A novel measure of terrestrial ecosystem integrity. bioRxiv. doi:10.1101/2022.08.21.504707.
- Hohenlohe PA, Funk WC, Rajora OP. 2021. Population genomics for wildlife conservation and management. Molecular Ecology. 30(1):62–82. doi:10.1111/mec.15720.
- Hotaling S, Kelley JL, Frandsen PB. 2021. Toward a genome sequence for every animal: where are we now? Proceedings of the National Academy of Sciences. 118(52 ):e2109019118. doi:10.1073/pnas.2109019118.
- Johnson P, Gerbeaux P. 2004. Wetland types in New Zealand. Wellington, New Zealand: Department of Conservation.
- Kapiti Coast District Council. 2022. Operative Kapiti Coast District plan: Schedule 1: Ecological sites. [accessed 2023 Oct 26]. https://www.kapiticoast.govt.nz/your-council/forms-documents/district-plan/operative-district-plan-2021.
- Larson ER, Graham BM., Achury R, Coon JJ, Daniels MK, Gambrell DK, Jonasen KL, King GD, Laracuente N, Perrin-Stowe TI, et al. 2020. From eDNA to citizen science: emerging tools for the early detection of invasive species. Frontiers in Ecology and the Environment. 18(4): 194–202. doi:10.1002/fee.2162.
- Mainka SA, Howard GW. 2010. Climate change and invasive species: double jeopardy. Integrative Zoology. 5(2):102–111. doi:10.1111/j.1749-4877.2010.00193.x.
- McCulloch C. 2019 Dec 18. World class fish and wildlife habitat. New Zealand Herald. [accessed 2023 Oct 26]. https://www.nzherald.co.nz/sponsored-stories/world-class-fish-wildlife-habitat/FUHLYA4S4XPBNIXAZLKJOG5MTU/.
- Melchior M, Baker C. 2023. Environmental DNA guidelines and field protocols for lotic systems. National Institute of Water and Atmospheric Research. Living document Version 1.0. https://s3.ap-southeast-2.amazonaws.com/wilderlab.resources/literature/eDNA_guidelines_report_2023279HN.pdf.
- National Wetland Trust of New Zealand. Wetlands you can visit – Southland region. [accessed 2023 Oct 26]. https://www.wetlandtrust.org.nz/get-involved/visit-wetlands/wetlands-you-can-visit-in-the-southland-region/.
- Neice AA, McRae SB. 2021. An eDNA diagnostic test to detect a rare, secretive marsh bird. Global Ecology and Conservation. 27:e01529. 10.1016/j.gecco.2021.e01529.
- Ngā Manu Nature Reserve. The reserve. [accessed 2023 Oct 26]. https://ngamanu.org.nz/the-reserve/.
- O'Donnell CF, Clapperton BK, Monks JM. 2015. Impacts of introduced mammalian predators on indigenous birds of freshwater wetlands in New Zealand. New Zealand Journal of Ecology. 39(1):19–33.
- Oksanen J, Simpson G, Blanchet F, Kindt R, Legendre P, Minchin P, O'Hara R, Solymos P, Stevens M, Szoecs E, et al. 2022. Vegan: Community ecology package [software]. R package version 2.6-4. [accessed 2023 Oct 26]. https://CRAN.R-project.org/package = vegan.
- Peters M, Clarkson B, editors. 2010. Wetland restoration: A handbook for New Zealand freshwater systems. Lincoln: Manaaki Whenua Press.
- Ratsch R, Kingsbury BA, Jordan MA. 2020. Exploration of environmental DNA (eDNA) to detect Kirtland’s Snake (Clonophis kirtlandii). Animals. 10(6):1057. doi:10.3390/ani10061057.
- R Core Team. 2023. R: A language and environment for statistical computing [software]. R Foundation for Statistical Computing. [accessed 2023 Oct 26]. https://www.R-project.org/.
- Reaser JK, Burgiel SW, Kirkey J, Brantley KA, Veatch SD, Burgos-Rodríguez J. 2020. The early detection of and rapid response (EDRR) to invasive species: A conceptual framework and federal capacities assessment. Biological Invasions. 22:1–19. doi:10.1007/s10530-019-02156-w.
- Rings Beach Wetland Group. Our story. [accessed 2023 Oct 26]. https://www.ringsbeachwetlandgroup.org.nz/our-story/.
- Robb MJG. 2014. When two worlds collide: Mātauranga Māori, science and health of the Toreparu Wetland [master’s thesis]. Hamilton: University of Waikato.
- Rourke ML, Fowler AM, Hughes JM, Broadhurst MK, DiBattista JD, Fielder S, Wilkes Walburn J, Furlan EM. 2021. Environmental DNA (eDNA) as a tool for assessing fish biomass: A review of approaches and future considerations for resource surveys. Environmental DNA. 4:9–33. doi:10.1002/edn3.185.
- Roy HE, Pauchard A, Stoett P, Renard Truong T, Bacher S, Galil BS, Hulme PE, Ikeda T, Sankaran KV, McGeoch MA, et al. 2023. IPBES the thematic assessment report on invasive alien species and their control: Summary for policymakers. Bonn (Germany): Zenodo. Version 3. doi:10.5281/zenodo.7430692.
- Schlaepfer MA, Sax DF, Olden JD. 2011. The potential conservation value of non-native species. Conservation Biology. 25(3):428–437. doi:10.1111/j.1523-1739.2010.01646.x.
- Shelton AO, Kelly RP, Donnell O, Park JL, Schwenke L, Greene P, Henderson C, Beamer RA, M E. 2019. Environmental DNA provides quantitative estimates of a threatened salmon species. Biological Conservation. 237:383–391. doi:10.1016/j.biocon.2019.07.003.
- Smale MC, James A. 2014. Ngarara Farms Waimeha neighbourhood development area – Vegetation assessment of environmental effects. Hamilton (New Zealand): Manaaki Whenua – Landcare Research. https://ref.coastalrestorationtrust.org.nz/site/assets/files/8273/lc1992_ngarara_-_waimeha_nda_vegetation_aee_2014-09-23_2.pdf.
- Smith SJ, David BO, Hicks AS, Wilkinson SP, Ling N, Fake DR, Suren A, Gault AA. 2023. Establishing optimum eDNA replication for standardisation of freshwater fish and invertebrate monitoring in lotic systems in Aotearoa New Zealand. Version 1.1. [Manuscript in preparation]. Wilderlab NZ. https://s3.ap-southeast-2.amazonaws.com/wilderlab.docs/Resources/High_rep_trial_infosheet.pdf.
- Sorrell B, Gerbeaux P. 2004. Wetland ecosystems. In: Harding J, Mosley P, Pearson C, Sorrell B, editor. Freshwaters of New Zealand. Christchurch: New Zealand Hydrological Society Inc and New Zealand Limnological Society Inc; p. 28.1–28.15.
- Stark JD, Maxted JR. 2007. A user guide for the macroinvertebrate community index. New Zealand: Ministry for the Environment. Cawthron Report No. 1166. https://environment.govt.nz/publications/a-user-guide-for-the-macroinvertebrate-community-index/.
- Takahara T, Iwai N, Yasumiba K, Igawa T. 2020. Comparison of the detection of 3 endangered frog species by eDNA and acoustic surveys across 3 seasons. Freshwater Science. 39(1):18–27. doi:10.1086/707365.
- Tiaki Tāmaki Makaurau Conservation Auckland. Te Henga Wetland. Auckland Council. [accessed 2023 Sep 23]. https://www.tiakitamakimakaurau.nz/discover-tamaki-makaurau/learn-about-your-area/bfa-te-henga-wetland/.
- Troth CR, Sweet MJ, Nightingale J, Burian A. 2021. Seasonality, DNA degradation and spatial heterogeneity as drivers of eDNA detection dynamics. Science of the Total Environment. 768:144466. doi:10.1016/j.scitotenv.2020.144466.
- Tuia Pito Ora New Zealand Institute of Landscape Architects. 2019. Pathway of wetland habitat restoration continues at Waitangi. [accessed 2023 Sep 24]. https://nzila.co.nz/news/2019/03/pathway-of-wetland-habitat-restoration-continues-a.
- Vander Zanden MJ, Hansen GJA, Higgins SN, Kornis MS. 2010. A pound of prevention, plus a pound of cure: early detection and eradication of invasive species in the Laurentian great lakes. Journal of Great Lakes Research. 36(1):199–205. doi:10.1016/j.jglr.2009.11.002.
- Waka Kotahi NZ Transport Agency. 2012. Ecological impact assessment: MacKays to Peka Peka Expressway. New Zealand. Technical Report 26. https://www.nzta.govt.nz/projects/wellington-northern-corridor/mackays-to-peka-peka/environmental-protection-authority-application/technical-reports/.
- Wallis GP, Trewick SA. 2009. New Zealand phylogeography: evolution on a small continent. Molecular Ecology. 18(17):3548–3580. doi:10.1111/j.1365-294x.2009.04294.x.
- Western Bay of Plenty District Council. 2021. Pongakawa students enjoy wetland lesson. [accessed 2023 Sep 24]. https://www.westernbay.govt.nz/council/news-and-updates/news?item = id:2emxmfn5l17q9s5auhsg.
- Wilderlab New Zealand. 2023. eDNA testing for the freshwater golden clam Corbicula fluminea. [accessed 2023 Oct 2]. https://www.wilderlab.co.nz/golden-clam.
- Wilkinson S. 2023. Laboratory methods for Wilderlab(TM) metabarcoding panels (Version 2.1.0). New Zealand: Wilderlab NZ. [accessed 2024 Mar 26]. https://s3.ap-southeast-2.amazonaws.com/wilderlab.resources/methods/Wilderlab_metabarcoding_methods_2.1.0.pdf.
- Wilkinson SP, Gault AA, Welsh SA, Smith JP, David BO, Hicks AS, Fake DR, Suren AM, Shaffer MR, Jarman SN, et al. 2024. TICI: A taxon-independent community index for eDNA-based ecological health assessment. PeerJ. 12 :e16963. doi:10.7717/peerj.16963.
- Willoughby JR, Wijayawardena BK, Sundaram M, Swihart RK, Dewoody JA. 2016. The importance of including imperfect detection models in eDNA experimental design. Molecular Ecology Resources. 16(4):837–844. doi:10.1111/1755-0998.12531.
- Wong A, Heggie-Gracies S, Quinn J, Markham J, Curry L, Neale M. 2020. Otawere water storage reservoir: Preliminary assessment of ecological values and effects. Puhoi Stour and Tokin and Taylor. PSL Report Number 2020/15. https://www.epa.govt.nz/assets/Uploads/Documents/Fast-track-consenting/Otawere/application-documents/Appendix-I-Preliminary-Assessment-of-Ecological-Values-and-Effects.pdf.
- Wu N, Górski K, Daniel AJ. 2013. Abundance of larval native and nonnative fishes in floodplain habitats of the lower waikato river, New Zealand. Inland Waters. 3(3):359–368. doi:10.5268/iw-3.3.550.