
 ?Mathematical formulae have been encoded as MathML and are displayed in this HTML version using MathJax in order to improve their display. Uncheck the box to turn MathJax off. This feature requires Javascript. Click on a formula to zoom.
ABSTRACT
Softening and Melting (S&M) experiments have evolved alongside the blast furnace as a crucial tool for burden characterisation and optimisation. Modern blast furnaces derive a base load of hydrogen from various sources. However, with hydrogen-enrichment of the blast furnace being considered to mitigate emissions, new S&M test conditions are required. In this study, a 2-D axisymmetric CFD model is used to simulate the internal conditions of a modern blast furnace operation, and a future operation with tuyere level hydrogen injection. The model results are used to guide the development of novel S&M test conditions, inclusive of H2, H2O, CO, CO2 and N2. The maximum hydrogen concentration under hydrogen enrichment was 20%, with the hydrogenous fraction of the gas primarily replacing nitrogen. A particular focus was given to the importance of including water vapour in the inlet gas, andits impact on reactions occurring in the S&M test.
Introduction
Injection of hydrogen into the tuyeres of the blast furnace is a promising solution to mitigate carbon emissions while the steel industry transitions to alternate ironmaking technologies. In order to most effectively implement such technology, burden behaviour under hydrogen-enriched conditions needs to be rigorously characterised. Softening and Melting (S&M) experiments [Citation1] have been an integral part of blast furnace optimisation, allowing operators to compare burden behaviour at laboratory scale under controlled conditions, and researchers to investigate the underlying mechanisms occurring above and within the cohesive zone.
Historically, the S&M test has been carried out with simplified inlet gas compositions and temperature profiles, simulating blast furnaces operating almost exclusively with coke. Gas compositions used in S&M experiments have reflected this, typically using only carbon monoxide (CO), carbon dioxide (CO2) and nitrogen (N2) [Citation1]. However, with the use of hydrogenous fuels such as natural gas (NG) and utilisation of pulverised coal injection (PCI) now common, increasing amounts of hydrogen (and its byproduct water vapour) are present in the blast furnace. As well as this, injection of pure hydrogen is now being trialled as a feasible measure to mitigate carbon emissions [Citation2]. Thus, for S&M experiments to more closely replicate the conditions present in a modern blast furnace, as well as to simulate hydrogen-enriched conditions, the test conditions must be re-examined and modified to include hydrogen and water vapour into the gas.
With blast furnaces operated differently around the globe, a compromise exists in all developed S&M testing conditions between representability/specificity of a particular operation and generalisation to all operations. Early S&M test conditions were generalised, often targeting a particular degree of reduction under a simplified 30% CO / 70% N2 gas composition [Citation3]. With the progression of blast furnace understanding through 1-D and 2-D models, conditions specific to the modelled operations are possible. 1-D models produce an average gas composition across the radius of the blast furnace. With the centre coke charging common [Citation4], a 1-D model may not represent the conditions experienced by the majority of the ferrous burden.
While multiple studies have modelled the internal conditions of the blast furnace under various approaches to hydrogen injection [Citation5–12], extension of these operating conditions to the S&M test framework and elaboration of their development is quite limited. As the blast furnace is a counter-current reactor, in which the charged ferrous burden encounters a gaseous stream rich in the byproducts of reduction, it is critical that the byproducts of hydrogen reduction such as water vapour be included in the gas composition to correctly represent a hydrogen-enriched environment.
It has been suggested that the sample temperature and gas composition are the dominant factors influencing burden behaviour in S&M experiments [Citation13]. While very few studies have included water vapour in S&M tests [Citation14], selected studies have included hydrogen. It is known that constant gas compositions, while providing simpler process control and analysis, cannot truly reflect the blast furnace behaviour [Citation15].
Addressing this knowledge gap, this study utilised a 2-D axisymmetric multiphase Computational Fluid Dynamics (CFD) blast furnace model to guide the development of the required S&M test conditions through simulating blast furnace operations, including with high hydrogen injection. This work focused on gas compositions in the mid-radial position, typical of the conditions experienced by the majority of the ferrous burden. The newly developed experimental conditions may then be compared with the conditions used in previous studies that involved varying gas compositions including hydrogen during the S&M test. In putting forward the proposed conditions, the authors seek to promote broad discussion and consensus on a more representative test for assessment and comparison of ferrous properties in contemporary and future blast furnace operations. Implications of including hydrogen but excluding water vapour on the thermodynamic potential for burden reduction, as well as gas-phase reactions such as the Water Gas Shift Reaction (WGSR) and coke gasification were discussed.
Methodology
Development of S&M testing conditions
The CFD model reported in this study (details of the model can be found elsewhere [Citation1,Citation16–18]) was utilised to simulate a typical blast furnace operating condition. Necessary boundary conditions to solve the model were generated from a separate two-stage heat and mass balance model, details of which can be found in a previous study assessing hydrogen injection limits in the blast furnace [Citation19]. For this study, the internal conditions (and corresponding S&M testing conditions) were determined for two separate cases, namely Base Case and Case 1, the same as reported in the previous study of the authors [Citation19]. To summarise, Case 1 represents an operation with 19.5 kg/t-HM of room temperature hydrogen injected through the tuyeres of a blast furnace (height = 25.6 m and hearth diameter = 12 m). The modelled blast furnace produced 7748 t/d of hot metal at 1522°C. Hydrogen injection in Case 1 was limited by a decrease in the top gas temperature to a minimum of 118°C, and a decrease in the Raceway Adiabatic Flame Temperature (RAFT) of 200°C below the Base Case. For completeness, the operating conditions of the respective cases are shown in .
Table 1. Operating conditions of Base Case and Case 1.
Owing to the heterogenous distribution of ore and coke to ensure better permeability in the shaft and cohesive zone, radial variation of temperature and gas composition in the blast furnace is quite significant. Because of this, the conditions experienced by a descending burden will be essentially path dependant. shows a representation of the burden distribution at the top of the furnace in terms of the radial variation of ore volume fraction, as used in the current modelling.
Figure 1. Burden distribution profile used as input in the CFD modelling.
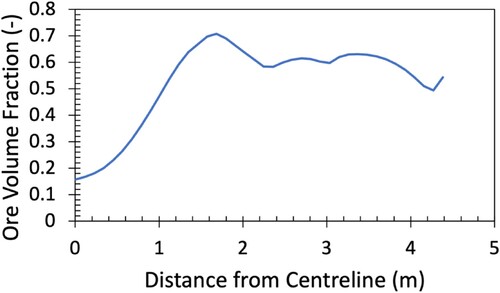
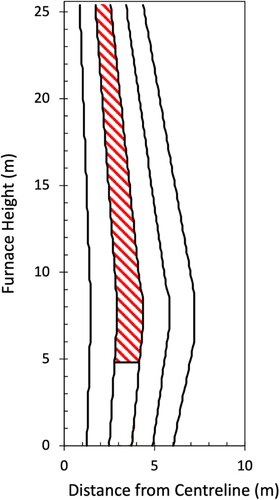
Because the conditions experienced are dependant on the descent path of the ore, the blast furnace was divided equally into five radial sections, with a mid-radial descent path defined as shown in (shaded region). This region is reflective of the burden descent streamline and is consistent with shaft solid flows reported previously [Citation20]. The mid-radial position was deemed most representative as this region contained the highest ore volume fraction at the top of the furnace (as seen in ). This region is of interest to characterise as it is the most challenging for reduction and smelting, and thus controls the lowest point of the cohesive zone.
Figure 2. Division of blast furnace to simulate different descent paths (mid-radial path shaded).
The spatial distribution of solid temperature and gas composition was calculated at heights above the bosh zone (temperatures below 1600°C). The temperature and gas composition were averaged in the radial direction to provide a representative value. The furnace was divided into 100 vertical sections at which the parameters were calculated.
The primary output from the CFD model was a temperature-dependant gas composition, as this is a representative and generalised way of expressing the most important conditions. However, another aspect of the conditions experienced by the burden is the time dependence of these two parameters. The gas composition is presented in its most generalised form (as a function of temperature) so as to allow well-established S&M experiment temperature profiles to dictate their time dependence.
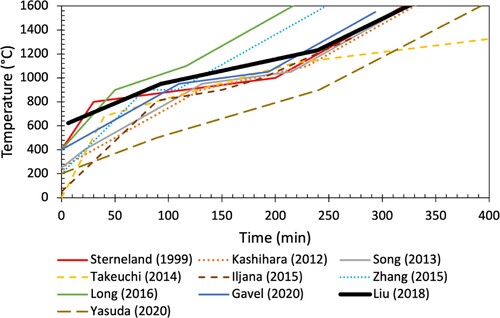
S&M experiment temperature profiles from comparative studies [Citation1,Citation7,Citation15,Citation21–27] are shown below in . These temperature profiles generally follow a similar trend, with an initial fast heating rate, followed by a slow heating rate (simulating the thermal reserve zone), and ending with a fast heating rate. The temperature profile selected for use with the newly developed conditions is indicated by the bold black line [Citation1,Citation28]. It is worth noting that previous tests utilising this temperature profile did not include hydrogen. This profile was selected as it is well-established [Citation1,Citation3,Citation28–30] and showed good agreement with previous S&M studies which included hydrogen. The selected profile is defined by a 10°C/min increase up to 600°C, followed by a 3.6°C/min increase up to 950°C, 1.9°C/min up to 1230°C and 4.7°C/min up to 1600°C (all indicated temperatures are control temperature). With the rapid heating rate below 600°C, the sample temperature can lag significantly behind the control temperature. To avoid this undesired temperature discrepancy, reducing gas is introduced at 600°C control temperature, where the sample temperature reads approximately 200°C.
Figure 3. Comparison of previous temperature profiles used in S&M experiments that included hydrogen and a varied gas composition with the proposed profile (bold, black).
The generalised S&M test conditions were developed by incorporating the time dependant temperature profile with the temperature-dependant gas composition. The gas composition was simplified into a step function using the three stages of the temperature profile (600°C–950 °C, 950°C–1230°C, 1230°C–1600°C), being averaged across all values between these temperature ranges. The detailed S&M test conditions, including parameters such as crucible size, burden mass and configuration, flow rate independence and compressive loading are system specific and not discussed here.
Thermodynamic analysis of system equilibrium
Equilibrium diagrams of Fe–C–O and Fe–H–O are commonly used to express the stability of ferrous oxides under a reducing gas atmosphere – and in particular demonstrate minimum gas requirements in order to reduce specific phases of iron oxide. Equations (1)–(6) are typically considered in equilibrium diagrams [Citation31]. Equilibrium constants (K) were calculated at temperatures between 100°C and 1600°C for reduction reactions (Equations (1)–(6)) using the thermodynamic software FactSage 8.1, Reaction Module (FactPS, FToxid) compound databases. These calculations were performed assuming the most stable state of each species at the specified temperature and atmospheric pressure.
(1)
(1)
(2)
(2)
(3)
(3)
(4)
(4)
(5)
(5)
(6)
(6)
The value of the equilibrium constant, K, expresses the relationship between the products and reactants of a reaction at equilibrium, where the equilibrium condition is determined by the minimisation of Gibbs free energy.
Reduction reactions (Equations (1)–(6)) can be represented by the general expression . Condensed phase reactants and products always have an activity of one, as they are pure substances. The activity of gas phase reactants can be represented by their partial pressure. As such, the equilibrium constant for these reactions can be expressed as Equation (7).
(7)
(7) In order to understand the gas requirements of each reaction, the equilibrium constant is typically modified to express the Gas Reduction Degree (GRD) instead. The GRD describes the oxidation state of the gas, either for the carbon (
), hydrogen (
) or both components (GRD
). As such, the equilibrium constant can be modified as in Equation (8). The algebraic derivation of the expression is shown for completeness.
(8)
(8) The plots of GRDC and GRDH with temperature for Equations (1)–(3) (hydrogen reduction reactions) and 4–6 (carbon monoxide reduction reactions) are shown in and , respectively.
Figure 4. Calculated equilibrium diagram for Fe–H–O system.
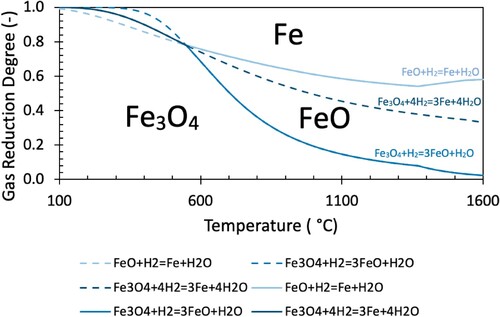
Figure 5. Calculated equilibrium diagram for Fe–C–O system.
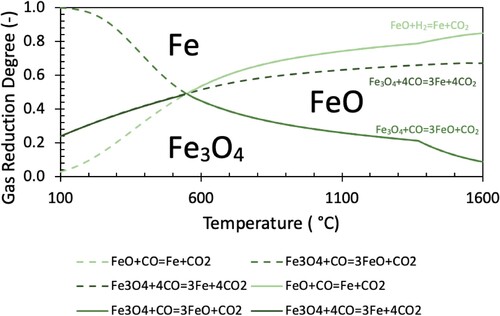
Commonly used equilibrium diagrams (referred to as Chaudron or Baur-Glässner diagrams) typically only plot the solid lines indicated in and . This simplifies the diagram into three regions, where particular phases are considered to be most stable (conventionally named stable phases indicated). However, as the system is not always at equilibrium (as will be discussed later), it is useful to plot the complete reaction lines to understand the equilibrium behaviour of each reaction at all temperatures. The continuation of each reaction line is indicated by a dashed line of the same colour. The inclusion of the dashed lines should not be confused with actual mechanistic pathways for reduction. The stability of various iron oxide associations can be demonstrated independently of the gas composition in a binary Fe–O diagram. The binary system can be seen to show the same stability temperature of 570°C for FeO.
It should be noted that in the following figures where the equilibrium diagrams are used for comparison with gas compositions, only the solid lines are shown.
Of note, the equilibrium lines calculated by FactSage include the phase change from solid to liquid wustite. The transition to liquid wustite alters the equilibrium state, causing the outward bulging of the FeO stability region above 1380°C. The expansion of this region implies that above this temperature (where liquid wustite forms), reduction of magnetite to wustite can be performed with a lower GRD, but reduction of wustite to metallic iron requires a slightly higher GRD.
Effect of water vapour on reactions
Owing to the counter-current nature of the blast furnace, the byproducts of reduction accumulate in the gas as it rises in the furnace. Because of this, thermodynamic limits exist in the furnace related to the reducing power of the gas as it rises. It is intuitive that in order to replicate the gas conditions in the furnace, water must be included in the S&M test gas – in particular at low temperatures corresponding to the top gas compositions. However, to date, the effect of not including water in the S&M test gas has not been quantified. While inclusion of water into the S&M test input gas is not always practical, understanding the effect of water in the S&M experiments is crucial to interpretation of results from tests which both do and do not include water.
To quantify the effect of water on the reactions occurring in the S&M apparatus, FactSage was used to determine the Gibbs free energy change (G) of reactions occurring during the experiment as a function of the partial pressure of water. The S&M test gas compositions determined from modelling at these temperatures were used as inputs for the calculations assuming ideal gas behaviour. The resulting figures are thus specific to S&M conditions modelled.
To demonstrate the impact of water on key reactions occurring in the S&M apparatus, the reduction of magnetite (Equations (1) and (2)) with hydrogen was assessed, as this is the primary reaction occurring in the temperature ranges at which water is present in the input gas. Reduction of hematite to magnetite was not included as it is thermodynamically favourable even at high partial pressures of water, and thus its occurrence is not significantly impacted by the exclusion of water in the S&M test gas. As well as the ferrous reduction reactions, the reverse Water-Gas Shift Reaction (rWGSR, Equation (9)) and gasification of coke with water (Equation (10)) were considered.
(9)
(9)
(10)
(10) While these reactions may not serve a large role in the S&M experiment (owing to the flow through arrangement of the gas), they can affect the composition of the rising blast furnace gas and are thus useful to relate S&M conditions to the blast furnace internal conditions. The rWGSR (with water as a product) is presented here as it provides an intuitive understanding of the direction of the reaction when it typically reaches equilibrium in the furnace (>827°C [Citation32]).
A lower limit of 600°C [Citation32,Citation33] was taken for the commencement of magnetite reduction. It is typically assumed that during its ascent through the blast furnace, there exists a chemical reserve in the furnace at which the gas is equilibrated with wustite [Citation34]. Thus, it was assumed that at 950°C, all higher oxides were reduced to wustite, which was taken as an upper limit for the reduction of magnetite.
Results and discussion
CFD modelling: temperature profile and gas composition
The spatial distribution of solid temperature determined above the 1600°C isotherm inside the blast furnace is shown below in .
Figure 6. Solid temperature contours determined from CFD model for Base Case (left) and Case 1 (right), isotherms indicated.
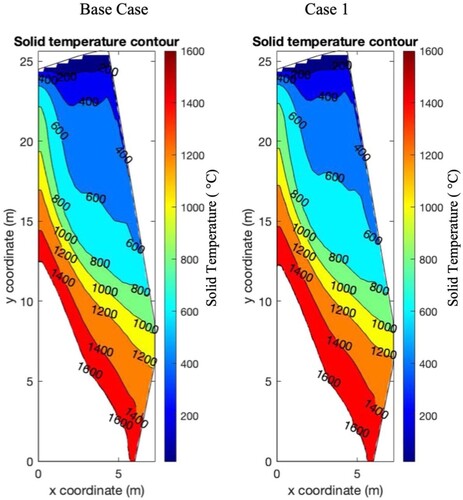
From , the calculated solid temperature profiles for the Base Case and Case 1 at temperatures below the 1600°C were similar. Marginal differences can be noted, such as the thickening of the 600–800°C region at the expense of the 400–600°C region. The similarity between profiles indicates that in this region (from the burden surface to the cohesive zone), the temperature experienced by the burden between both cases is similar. As such, the temperature profile in this region is not sufficiently affected to justify changing the simplified S&M test temperature profile between cases.
The gas compositions as a function of temperature corresponding to the mid-radial descent path of the Base Case and Case 1 are shown in and respectively.
Figure 7. Temperature dependant gas composition determined from CFD model for the Base Case.
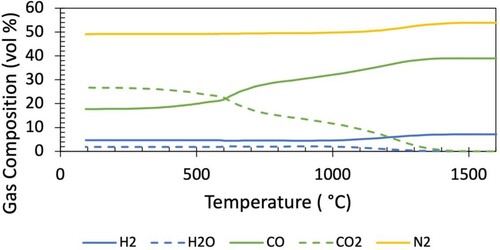
Figure 8. Temperature dependant gas composition determined from CFD model for Case 1.
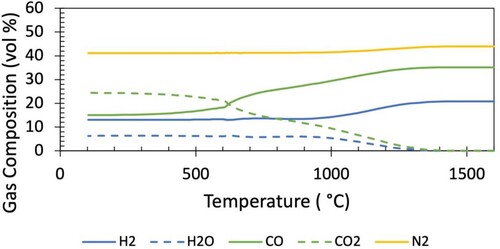
The primary difference between the gas composition for the Base Case and Case 1 is the amount of hydrogenous species, which are primarily seen to replace nitrogen. This can be represented through the hydrogenous fraction () of each gas composition, which was 0.15 for the Base Case and 0.37 for Case 1. The maximum hydrogen concentration reaches 7 vol.-% in the Base Case, and 21 vol.-% in Case 1.
It is noted that the top gas CO utilisation is ∼ 0.6, above what would be determined from a 1-D model reflecting the average top gas utilisation. The radial distribution of top gas utilisation is a product of the location of the burden – the gas utilisation is higher where there is more burden (and thus reduction). This top gas composition is consistent with operational data at this radial position [Citation35].
Comparison with previous studies
The S&M test gas conditions can be represented by two parameters which have significant impacts on reduction behaviour, namely temperature and GRD. It should be noted that when describing blast furnace internal conditions, gas utilisation (,
) is typically used as it intuitively describes the effective utilisation of reducing gas as it rises through the furnace. With the gas conditions being imposed in the S&M experiment, the GRD provides a more natural term for understanding the driving force behind the reduction reactions occurring.
Shown in below is the temperature-dependant GRD determined from the CFD model in comparison with a range of experimental conditions used previously [Citation7,Citation14,Citation15,Citation21–27,Citation36] (shaded red stripes). The range of GRD is shown only for the carbon component of the previous S&M test gas conditions as the reduction degree of the hydrogen component at the inlet is always one (as no steam is used). Because of this, the effect of the presence of hydrogen in the system is shown by the range of Chaudron equilibrium lines in (shaded green area). These lines are influenced by the hydrogen fraction, which in the previous tests ranges between 0.05 [Citation21] – 0.27 [Citation27]. The equilibrium lines for the hydrogen fraction of the Base Case and Case 1 are also indicated in . In addition to the S&M test conditions, a typical GRDC in an operating blast furnace is also shown (shaded blue area), interpreted from Geerdes, et al. (Citation2015).
Figure 9. Comparison of Base Case and Case 1 GRD. (Blue shaded area. typical GRDc in an operating blast furnace; Red shaded area. previous S&M test conditions; Green shaded area. Equilibrium (Chaudron) lines at hydrogenous fraction ranges of previous S&M test conditions).
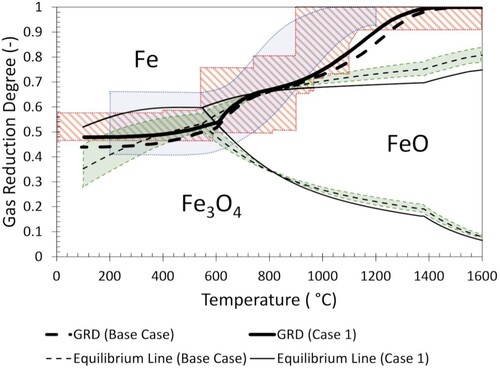
The thick lines in represent the conditions determined from CFD modelling (Base Case indicated by dashed line). From these lines, three general regions can be identified. At 100°C, (approximately representing top gas conditions), the Base Case gas is in the metallic iron region, while the Case 1 gas is in the magnetite region, although it is expected that the formation of metallic iron will not occur owing to slow reaction kinetics in this temperature range. At 800°C, both the Base Case and Case 1 gas fall on the equilibrium between wustite and metallic iron. This region represents the wustite equilibrium reached in the chemical reserve zone (CRZ) of the furnace shaft. Finally, at 1600°C, both the Base Case and Case 1 gas are at GRD = 1 and fall in the metallic iron region of the graph.
It should be noted that the CRZ temperature can also vary with different descent paths, as it is impacted by the volume of burden present. As such, the CRZ temperature at one radial position cannot be directly compared with an average CRZ temperature as is used in a 1-D model. Additionally, the concept of stack reduction efficiency must also include specific reference to the radial position. The determined CRZ temperature is consistent with operational results measured at a similar radial position [Citation37].
The temperature at which previous S&M test conditions introduce pure reducing gas (GRD = 1) into the test varies significantly, as simplifications are required to convert a continuous gas composition into a step profile. When compared with the bounds of previous step profiles, the continuous gas composition determined from modelling is seen to have a slightly lower GRD between 1100°C and 1200°C. Despite this small deviation, overall, the Base Case GRD conditions are in good agreement with previous S&M test conditions that included hydrogen (shaded area in red). The equilibrium line also falls within the range used in previous studies. It should be noted that while some of these conditions are simulating hydrogen-enriched conditions [Citation7,Citation15], the maximum hydrogen fraction is representative of regular operations with hydrogen sources such as steam and PCI (without additional hydrogen enrichment) [Citation27]. The equilibrium line for Case 1 is seen to be outside of the bounds of previously used conditions owing to the increased hydrogen fraction of the gas from the modelled hydrogen injection.
Of particular interest is the area encompassed by the calculated GRD line and the boundary between FeO and Fe stability regions. When comparing these regions for the Base Case and Case 1, above 800°C the Base Case lines are closer together than those for Case 1. This indicates that for Case 1, the driving force for reduction is increased when compared to the Base Case. This is facilitated by the downward movement of the equilibrium line owing to the increased hydrogen content.
The temperature-dependant GRD determined for the Base Case and Case 1 are both similar, with Case 1 being slightly higher than the Base Case below ∼600°C and above 1000°C. However, when comparing the equilibrium lines, the increased hydrogen fraction of Case 1 raises the region of magnetite stability upwards (higher GRD requirement to reduce) at temperatures below 800°C. The upward movement raises the equilibrium line above the GRD of the gas for Case 1. This indicates that while the overall GRD has only changed slightly, the reduction ability of the combined gas is decreased with the increased hydrogen (and water vapour) content. However, in this region (<700°C), the WGSR does not reach equilibrium in the furnace shaft [Citation32]. For this reason, the behaviour of the system at lower temperatures is likely to be influenced by the equilibrium behaviour of each individual system instead of the combined equilibrium.
For further detail on this behaviour, the individual GRDH and GRDC for the Base Case and Case 1, as well as the individual equilibrium lines for hydrogen and carbon systems are shown in .
Figure 10. Equilibrium lines and GRD for independent carbon and hydrogen systems of Base Case and Case 1.
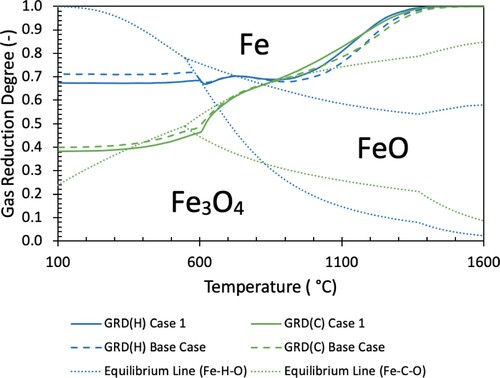
The equilibrium lines in are a common way of expressing the reduction behaviour of hydrogen and carbon monoxide. Specifically, the stability region of metallic iron increases with temperature for hydrogen but decreases with temperature for carbon monoxide. This implies that hydrogen reduction is more efficient at high temperature, whereas carbon monoxide reduction is more efficient at low temperature. However, with the counter-current nature of the blast furnace, the GRD decreases with decreasing temperature (as it is utilised rising through the furnace). Because of this, carbon monoxide remains able to reduce iron oxides throughout the entire furnace, whereas hydrogen cannot. In , this is evident as below ∼700°C, the GRD of the hydrogen species remains constant (signifying that reduction with hydrogen has halted) and remains in the region in which Fe3O4 is stable. The carbon system GRDC continues to decrease (carbon monoxide continues to reduce burden) at low temperatures, with the final GRD in the region where metallic iron is most stable.
Simplification of S&M test conditions
S&M test conditions are typically simplified into multiple step changes to allow simpler process control, repeatability, and analysis. The conditions determined from the CFD model shown in and were averaged between the temperatures at which the temperature profile changed heating rate. The resulting S&M test conditions are presented in full in and for the Base Case and Case 1 respectively. The gas composition at low temperatures is included in this table for completeness. As previously discussed, the difference between the control and sample temperature is greatest during the heating up period, hence the test (and reducing gas flow) is usually commenced at 600°C sample temperature. The GRD conditions at low temperature are quite low, however it may be important to include the gas atmosphere at these temperatures to facilitate the low temperature reduction of hematite to magnetite.
Table 2. S&M test conditions for Base Case.
Table 3. S&M test conditions for Case 1.
Effect of water vapour exclusion from S&M test
Previous S&M tests that have included hydrogen have excluded water vapour from the input gas. To quantify the effect of excluding water, the newly developed conditions from were used as inputs to determine the change in Gibbs free energy (ΔG) of each reaction under the conditions present at the inlet of the S&M apparatus. The ΔG was plotted as a function of the partial pressure of water (pH2O) provided to the reaction, with the lower limit being 10−9 atm and the upper limit being the partial pressure of water in the inlet gas at the respective temperature.
Shown in is the ΔG of Equations (1, 2, 9 and 10) for the Base Case gas at 600°C and 950°C. Despite the flow through arrangement of S&M experiments, coke gasification remains of interest as coke layers are typically included in the crucible. As such, the effect of gasification reactions on the coke microstructure can be studied. The stoichiometry of Equation (1) is modified to express the reaction per mole of reducing gas (H2), as this is considered the limiting reactant under local conditions inside the particle where reduction occurs. The pH2O is plotted on a logarithmic scale. The conditions for the Case 1 gas are not shown as they demonstrate the same behaviour for exclusion of water vapour.
Figure 11. Dependence of change in Gibbs free energy on partial pressure of water for key reactions in the S&M apparatus.
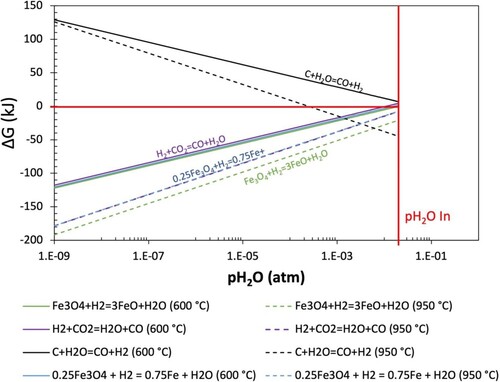
In , ΔG = 0 is indicated by the horizontal red line and the inlet conditions to the S&M test are indicated by the vertical red line. At this pH2O, the S&M test conditions represent those determined from the modelling (conditions reflective of those present in the blast furnace). At these conditions magnetite reduction reactions are approximately at equilibrium (ΔG = 0) at 600°C, and become increasingly thermodynamically favourable (ΔG < 0) as the temperature increases to 950°C. At 950°C, both reduction reactions are thermodynamically favourable, with ΔG1 = −8 kJ, and ΔG2 = −21 kJ.
As partial pressure of water decreases the ΔG of each reaction is seen to decrease significantly. The rate at which these lines decrease (gradient) is reflective of the extent to which removing water affects each reaction. At the lowest partial pressure of water, both reduction reactions become extremely thermodynamically favourable, even at 600°C, where ΔG1 = −120 kJ and ΔG2 = −122 kJ. With the input gas being this far from equilibrium when water is excluded, the reduction of magnetite is promoted.
It is worth noting that illustrates a system specific application of the same thermodynamic equilibrium data used to plot , with the exception that is demonstrating behaviour away from equilibrium. From , the GRD axis is related to the pH2O such that a decrease in pH2O corresponds to an increase in the GRD. From , the continuation of the equilibrium line for Equation (1) is seen to be higher (requiring a higher GRD) than EquationEquation 2(2)
(2) . Under the specific conditions determined from the modelling (GRD = 0.75), the GRD is sufficiently high such that it is above both equilibrium lines in at 950 °C. This is consistent with , which demonstrates that both Equations (1) and (2) are thermodynamically favourable at 950°C. What cannot be deduced from alone is the behaviour of each reaction as it moves away from the reaction equilibrium lines, which is demonstrated in .
In a carbon-based (no hydrogen injection) blast furnace, the endothermic gasification of coke with carbon dioxide becomes relatively insignificant below ∼1000°C (dependant on coke reactivity) and a thermal reserve is maintained through the slightly exothermic reduction of wustite by carbon monoxide. From , the gasification of coke is seen to be slightly more favourable than reduction reactions at 950 °C, implying that endothermic reformation of reduction gases may still occur below 1000°C with increased hydrogen concentration. This effect could facilitate an increase in the stack reduction efficiency but may also alter the thermal reserve zone temperature. It is important to note that while the reaction may be thermodynamically viable, the reaction kinetics at these temperatures may decrease [Citation38].
In , the rWGSR is seen to be promoted when water is excluded from the S&M test input gas. This is an important consideration for interpretation of results, as reduction degree is typically determined utilising analysis of the off-gas. As well as this, coke gasification reaction is noted to cease completely when the partial pressure of water is decreased. It can be concluded that for analysis of coke behaviour during S&M tests, inclusion of water vapour is deemed to be a critical element for appropriate representation of blast furnace operating conditions.
Conclusion
Numerical modelling was used to determine blast furnace internal conditions of a hypothetical operation, including with increased hydrogen injection, to assist in the development of appropriate Softening and Melting (S&M) experimental conditions. Using a CFD model, S&M test conditions were developed simulating a typical modern blast furnace operation with PCI (Base Case), as well as an operation with 19.5 kg/t-HM of hydrogen (Case 1) injected through the tuyeres. Based on a review of literature, and the results of computational and equilibrium analysis described in this investigation, a new set of S&M test gas and temperature conditions is proposed that includes water vapour. This novel contribution will be a critical step in characterising burden behaviour under hydrogen-enriched conditions. Based on the newly developed conditions, it was found that:
The fraction of hydrogen plus water vapour (excluding nitrogen) in S&M test conditions simulating hydrogen injection increased from 0.15 (Base Case) to 0.37 (Case 1).
The maximum hydrogen concentration for the S&M test conditions simulating hydrogen injection increased from 6 vol.-% (Base Case) to 20 vol.-% (Case 1), primarily replacing nitrogen. The corresponding maximum water concentration increased from 2 vol.-% to 6 vol.-% respectively.
The determined temperature-dependant gas conditions for the Base Case operation agreed well with previous studies which incorporated a varied gas composition including hydrogen, as well as typical blast furnace gas conditions.
Thermodynamic analysis of the gas composition indicates that hydrogen is most effective at high temperatures where the WGSR reaches equilibrium, however it is unable to further reduce magnetite at lower temperatures where the GRDH is lower.
Water vapour must be included in the S&M test gas, to appropriately retard reduction reactions, and to promote a realistic extent of coke gasification. This is expected to have a significant impact on the resulting behaviour characterisation of both coke and ore.
Acknowledgements
The authors acknowledge the funding of the Australian Research Council in supporting the ARC Research Hub for Advanced Technologies for Australian Iron Ore and BHP for their financial support and permission to publish this paper. The authors also thank BlueScope Steel for valuable discussions on the numerical modelling.
Disclosure statement
No potential conflict of interest was reported by the author(s).
Additional information
Funding
References
- Liu X, Honeyands T, Evans G, et al. A review of high-temperature experimental techniques used to investigate the cohesive zone of the ironmaking blast furnace. Ironmak Steelmak; 46 10(2018):953–967, doi:10.1080/03019233.2018.1464107.
- Thyssenkrupp. Injection of hydrogen into blast furnace: thyssenkrupp Steel concludes first test phase successfuly. https://www.thyssenkrupp-steel.com/en/newsroom/press-releases/thyssenkrupp-steel-concludes-first-test-phase-successfully.html (23/11/2021).
- Ono K, Kushima K, Hida Y. Ironmaking Conf., Atlanta, Iron & Steel Society, Warrendale, (1983), 117.
- Chakrabarty A, Basu S, Nag S, et al. Model study of centre coke charging in blast furnace through DEM simulations. ISIJ Int. 2021;61(3):782–791, doi:10.2355/isijinternational.ISIJINT-2020-498.
- Chu M, Nogami H, Yagi J-i. Numerical analysis on injection of hydrogen bearing materials into blast furnace. ISIJ Int. 2004;44(5):801–808, doi:10.2355/isijinternational.44.801.
- Nogami H, Kashiwaya Y, Yamada D. Simulation of blast furnace operation with intensive hydrogen injection. ISIJ Int. 2012;52(8):1523–1527, doi:10.2355/isijinternational.52.1523.
- Long HM, Wang H, Zhao W, et al. Mathematical simulation and experimental study on coke oven gas injection aimed to low carbon blast furnace ironmaking. Ironmak Steelmak. 2016;43(6):450–457, doi:10.1080/03019233.2015.1108480.
- Wang H, Chu M, Bi C, et al. 8th international symposium on high-temperature metallurgical processing. Cham: Springer; 2017; 21.
- Castro JAd, Takano C, Yagi J-i. A theoretical study using the multiphase numerical simulation technique for effective use of H 2 as blast furnaces fuel. J Mater Res Technol. 2017;6(3):258–270, doi:10.1016/j.jmrt.2017.05.007.
- Yilmaz C, Wendelstorf J, Turek T. Modeling and simulation of hydrogen injection into a blast furnace to reduce carbon dioxide emissions. J Cleaner Prod. 2017;154:488–501, doi:10.1016/j.jclepro.2017.03.162.
- Castro JAd, de Medeiros GA, de Oliveira EM, et al. A comprehensive modeling as a tool for developing New mini blast furnace technologies based on biomass and hydrogen operation. J Sustain Metall. 2020;6(2):281–293, doi:10.1007/s40831-020-00274-7.
- Tang J, Chu M, Li F, et al. Mathematical simulation and life cycle assessment of blast furnace operation with hydrogen injection under constant pulverized coal injection. J Cleaner Prod. 2021;278:123191, doi:10.1016/j.jclepro.2020.123191.
- Ranade MG. 5th International Iron and Steel Congress (IISC), Washington, Iron and Steel Society, Warrendale. 1983, 129.
- Small J, Adema A, Andreev K, et al. Metals (Basel). 2018;8(12):1082, doi:10.3390/met8121082.
- Zhang H-j, She X-f, Han Y-h, et al. Softening and melting behavior of ferrous burden under simulated oxygen blast furnace condition. J Iron Steel Res Int. 2015;22(4):297–303, doi:10.1016/S1006-706X(15)30003-0.
- Chew S, Zulli P, Yu A. Mathematical modeling of iron and steel making processes, modelling of liquid flow in the blast furnace, application in a comprehensive blast furnace model.. ISIJ Int. 2001;41(10):1122–1130, doi:10.2355/isijinternational.41.1122.
- Abhale PB, Viswanathan NN, Saxén H. Numerical modelling of blast furnace – evolution and recent trends. Min Proc Extractive Metall. 2020;129(2):166–183, doi:10.1080/25726641.2020.1733357.
- Hoque MM, Doostmohammadi H, Mitra S, et al. High temperature softening and melting interactions between newman blend lump and sinter. ISIJ Int. 2021;61(12):2944–2952, doi:10.2355/isijinternational.ISIJINT-2021-198.
- Barrett N, Mitra S, Doostmohammadi H, et al. Assessment of blast furnace operational constraints in the presence of hydrogen injection. ISIJ Int. 2022;62(6):1168–1177, doi:10.2355/isijinternational.ISIJINT-2021-574.
- Bambauer F, Wirtz S, Scherer V, et al. Transient DEM-CFD simulation of solid and fluid flow in a three-dimensional blast furnace model. Powder Technol. 2018;334:53–64, doi:10.1016/j.powtec.2018.04.062.
- Sterneland J, Lahiri AK. Contraction and meltdown behaviour of olivine iron ore pellets under simulated blast furnace conditions. Ironmak Steelmak. 1999;26(5):339–348, doi:10.1179/030192399677194.
- Kashihara Y, Sawa Y, Sato M. Effect of hydrogen addition on reduction behavior of Ore layer mixed with coke. ISIJ Int. 2012;52(11):1979–1985, doi:10.2355/isijinternational.52.1979.
- Song Q. Effect of nut coke on the performance of the ironmaking blast furnace. Delft: Delft University of Technology; 2013.
- Takeuchi N, Iwami Y, Higuchi T, et al. Evaluation of Sinter Quality for Improvement in Gas Permeability of Blast Furnace. ISIJ Int. 2014;54(4):791–800, doi:10.2355/isijinternational.54.791.
- Iljana M, Kemppainen A, Heikkinen E-P, et al. Proc. METEC & 2nd ESTAD Conf., Dusseldorf, TEMA Technologie Margeting AG, Aachen, (2015).
- Gavel DJ, Song Q, Adema A, et al. Characterization of the burden behaviour of iron ore pellets mixed with nut coke under simulated blast furnace conditions. Ironmak Steelmak. 2020;47(2):195–202, doi:10.1080/03019233.2018.1510873.
- Yasuda N, Nishioka K, Nomura S. Formulation of shrinkage rate of sinter during softening process. ISIJ Int. 2020;60(7):1487–1494, doi:10.2355/isijinternational.ISIJINT-2019-817.
- Dawson P. South East Asia Iron & Steel Institute Quarterly (SEAISI Q.), 16(1987), 23.
- Loo CE, Matthews LT, O'Dea DP. Lump Ore and sinter behaviour during softening and melting. ISIJ Int. 2011;51(6):930–938, doi:10.2355/isijinternational.51.930.
- Liu X, Honeyands T, Evans G, et al. in: 8th International Congress on Science and Technology of Ironmaking, Vienna, 2018.
- Spreitzer D, Schenk J. Reduction of iron oxides with hydrogen—a review. Steel Res Int. 2019;90(10):1900108, doi:10.1002/srin.201900108.
- Geerdes M, Chaigneau R, Kurunov I, et al. Modern blast furnace ironmaking: an introduction. Amsterdam: IOS Press; 2015. Incorporated
- Dutta S, Chokshi Y. Basic concepts of iron and steel making. Singapore: Springer Nature; 2020.
- Peacey JG, Davenport WG. The iron blast furnace. Oxford: Pergamon Press; 1979.
- Hashimoto Y, Sawa Y, Kitamura Y, et al. Development and validation of kinematical blast furnace model with long-term operation data. ISIJ Int. 2018;58(12):2210–2218, doi:10.2355/isijinternational.ISIJINT-2018-177.
- Gavel DJ, Adema A, van der Stel J, et al. A comparative study of pellets, sinter and mixed ferrous burden behaviour under simulated blast furnace conditions. Ironmak Steelmak. 2021;48(4):359–369, doi:10.1080/03019233.2020.1786644.
- Sterneland J, Andersson MAT, Jönsson PG. Comparison of iron ore reduction in experimental blast furnace and laboratory scale simulation of blast furnace process. Ironmak Steelmak. 2003;30(4):313–327, doi:10.1179/030192303225003980.
- Lan C, Lyu Q, Liu X, et al. Thermodynamic and kinetic behaviors of coke gasification in N2CO CO2H2H2O. Int J Hydrogen Energy. 2018;43(42):19405–19413, doi:10.1016/j.ijhydene.2018.08.216.