
 ?Mathematical formulae have been encoded as MathML and are displayed in this HTML version using MathJax in order to improve their display. Uncheck the box to turn MathJax off. This feature requires Javascript. Click on a formula to zoom.
ABSTRACT
International trade in table grapes is expanding rapidly, with Peru overtaking South Africa as the second-largest exporter from the Southern Hemisphere behind Chile. The primary objective of the study was to the determine whether South Africa, with 75% of its exports destined for Europe, will be negatively affected by changes in Peru and Chile's export orientation. This question is addressed by breaking it down into four key factors. The first is the role of policy by applying Anderson et al.'s (2006) empirical framework of nominal rate of assistance (NRA) followed by measures of competitiveness, namely relative trade advantage (RTA), normalised revealed comparative advantage (NRCA) and the logarithmic relative export advantage (InRXA). The last two measures – indirect freight cost and trade barriers - zoom in on trade from one country to a specific destination. The results and discussion highlight that Peru, operating in close to a zero-distorted environment, has the potential to increase its competitiveness in the global table grape market. Whilst South Africa's table grape exporters also have this potential, given the advantages of a depreciating rand, broader and more favourable market access outside the EU and UK is paramount.
1. Introduction
The volume of world table grape production increased by 60% from the 2010/2011 to the 2023/2024 southern hemisphere marketing year (USDA Citation2023a, Citation2023b). During this period, Southern Hemisphere countries experienced the fastest growth in exports, with Chile, Peru and South Africa the dominant role-players. Chile is still the leading Southern Hemisphere table grape exporter by volume, but her share of Southern Hemisphere exports fell from 70% to 38%, whereas Peru and South Africa’s contribution grew, with Peru faring better than South Africa (ITC Citation2022a). Due to proximity, Chile and Peru’s main export market is the United States.
South Africa has long enjoyed favourable market access to Europe, which contributed to the development of a strong and export-oriented table grape industry which exports more than 90% of production. In the process, South Africa became a world player that could effectively compete, especially after deregulation in the 1990s. Given the growth in total volumes from South America and the spill-over effect in European markets, there is uncertainty surrounding South Africa's ability to compete sustainably in the long run. More than 50% of South Africa’s table grape exports go to the EU market, and 20% to the UK, thus the country’s market position is at risk if Chilean and Peruvian exporters divert additional excess production to the EU and UK. Whether South African exporters can stand up to this challenge will depend on their competitiveness, which is, in turn, affected by a range of exogenous factors over which they have little to no control. These include a change in marketing strategy by Chilean or Peruvian producers to focus more on the EU and the UK, policies by their governments that incentivise exports, weather patterns and climate change, prices, and exchange rates.
The main research question of this paper is therefore whether South African table grape exporters have been effective in mitigating the onslaught of these factors. Analysis of the trends in competitiveness under changing market conditions, changes in policy (and consequently exchange rates), as well as weather-related production impacts, is critical to strategic decision-making in the industry going forward. To address the research question, we break it down into four key factors. The first is the role of policy and the extent to which it supports or taxes the industry, while the second is a measure of competitiveness to determine how effectively South African exporters have been able to compete internationally despite or as a result of the country’s policy environment. Whilst these first two measures indicate the comparative advantage within a global context that South Africa or South American competitors may have in table grape exports, the next two measures – indirect freight costs and the extent of trade barriers – zoom in on the specifics of the table grape trade from these countries to the EU and UK markets.
The remainder of the paper is structured as follows: a short literature review on competitive analysis and policy distortions is given in the next section followed by a brief overview of South Africa, Peru and Chile’s table grape industry, while Section 3 describes the methodology used in this article. Section 4 describes data sources, while the results are presented and interpreted in Section 5. Section 6 summarises the results and concludes with some implications and recommendations.
2. Literature review on competitiveness analysis and policy distortions
The export-oriented table grape industry operates in a competitive environment. There is no shortage of interpretations of the concept of competitiveness (Freebairn Citation1986; Esterhuizen et al. Citation2008). This study applied the definition of Esterhuizen et al. (Citation2008), who define competitiveness as the ability of a sector in a country to trade for gain at the global level under market distortions, and to be able to expand, innovate and perform sustainably, while at the same time being able to correctly predict and act upon changes in the global environment. This definition was chosen as the most appropriate since it emphasises the uneven global trade setting, including trade under market distortions.
There are several extant ways of measuring the competitiveness of an agricultural good of a country. Farm-level profitability analysis is one measure of competitiveness, such as intra-country analysis as in the agri benchmark study (Agethen et al. Citation2020). Another example is the competitiveness review reports, which rate countries based on the scores realised in production efficiency, industry infrastructure and inputs, and financial and market factors for a specific commodity (Belrose, Inc Citation2018). However, these studies are typically data intensive and rely heavily on study group information or surveys, information that is not usually in the public domain. Therefore, measures such as the relative trade advantage (RTA), revealed comparative advantage (RCA), net export index (NEI), export market share (EMS), revealed competitiveness (RC), logarithmic revealed export advantage (RXA), logarithmic revealed import advantage (RMA) and normalised relative comparative advantage (NRCA) have been developed (e.g., Balassa 1965, Boonzaaier Citation2015; Seymen and Utkulu Citation2004; Vollrath Citation1991). However, each has its strengths and weaknesses; therefore, the choice of measurement is dictated by the question that is being addressed.
The competitiveness of the agricultural sector is influenced by the external environment. The main factor is the public policies of the sending and receiving country that influence how the market for agricultural goods operates (Esterhuizen et al. Citation2008). At the farm level, domestic policy influences production costs, which play a role in the profitability of the industry. Furthermore, table grape exports compete in the international market at a certain price, and policies on factors such as freight rates and exchange rates have a direct and indirect influence on these prices. Ultimately, the more profitable a product, the more a country will produce and trade with it, within the constraints of the country’s natural resources.
Secondly, trade barriers influence how agricultural goods operate in a market. Many studies have addressed how tariff and non-tariff barriers (NTB) affect global trade. Laborde Debucquet, Martin, and van der Mensbrugghe (Citation2017) for example applied a two-stage modelling approach to better estimate how to apply optimal NTBs. Further, Santeramo and Lamonaca (Citation2019) and Santeramo et al. (2019) conducted a meta-analysis to analyse the effect of non-tariff measures (NTMs) on the trade of agricultural goods, where NTMs refers to mechanisms such as Sanitary and Phytosanitary Standards (SPS), Maximum Residue Levels (MRL) and Technical Barriers to Trade (TBT) (Santeramo et al., 2019). Gravity models are also a well-known technique used to evaluate how a trade policy such as NTM will affect the trade of an agricultural product (Santeramo and Lamonaca 2022; Santeramo et al. Citation2023a, Citation2023b; Emlinger et al. 2023).
Consequently, the competitive advantage of countries has evolved due to policy changes, which have had a major impact on the global economy of trade. There are several studies on the methodological approaches to measure distortions due to policy changes. These include CGE models (Gautum et al., 2021; Martin Citation2021), gravity-based models (Bozzola et al., 2023; Emlinger et al., 2023; Martin 2020) and the family of models that measure rates of protection such as the nominal rate of protection (NRP) developed by Allen et al. (2020), Allen et al. (Citation2021), Kassie, Martin, and Tokgoz (Citation2022) and Tokgoz (Citation2018). These have also been used to examine the distortions to incentives in South African agriculture (Day Citation2018). Day (Citation2018) mentions that there is a link between incentive distortions and competitiveness in the agricultural sector of a country.
3. Overview of the table grape industry
The grape industry is a broad industry that mainly consists of wine grapes, table grapes and raisins. Almost 50% of the world’s grape production goes to wine, 42% to table grapes and the remaining 8% to the drying of grapes (OIV Citation2022). The table grape industries of South Africa, Peru and Chile are compared regarding their position in the international market and the political environment in which each country operates. The Southern Hemisphere shows growth in the overall market share of table grapes in the world, which is complementary to the European (EU) and United Kingdom (UK) markets. Table grapes are a high-value, labour-intensive export crop and have the potential to improve incomes and job opportunities for unskilled labour in developing countries such as South Africa, Chile and Peru, which have a comparative advantage in table grapes (Markman Citation2019). One should note that the fresh fruit industry is complex, and careful measures need to be taken when examining the table grape industry in each country since the EU and UK markets are highly competitive (Maspero and Van Dyk Citation2004). Land, water and labour are important for long-term productivity in table grape production (Markman Citation2019). Therefore, these three production factors are explained for each country, followed by the country’s market composition and the structure and dynamics of the country’s table grape industry.
3.1 South Africa
South Africa is the fourth-largest table grape exporting country in the world and the third-largest in the Southern Hemisphere. The country’s production increased by more than 40% from the 2010/2011 marketing year to 2022/2023. Exports increased from 202 500 tonnes to 335 747 tonnes over the same period (SATI Citation2023). Table grape production and exports contribute substantially to the South African economy, especially in terms of net foreign exchange earnings, job creation, and the value chain linkages to supporting sectors and institutions (DAFF Citation2020). South Africa’s table grape exports represent a stable 8% of world exports (ITC Citation2024).
Some 19 788 hectares are planted to table grapes in South Africa, an increase of more than 5,000 hectares from 2010 (SATI Citation2023). The increasing production area of new varieties such as Sweet Globe and Autumn Crisp, indicates positive farm-level responses to changing consumer demands. South Africa has unique natural resources conducive to the production of table grapes, yet climate change has already affected the industry negatively, for example with the unprecedented three-year drought between 2015 and 2017 and the concomitant irrigation water restrictions (SATI Citation2019).
The deterioration of South Africa’s infrastructure for both production and exports has been widely noted (Gerber, Havenga, and Simpson Citation2017; Anelich et al. Citation2022; Cloete, Davids, and Vink Citation2022; Davids et al. Citation2022; BFAP Citation2022a, Citation2022b; SARB Citation2022a, Citation2022b), and has impacted severely on the industry. This is a concern for South Africa’s export-oriented table grape industry as an inefficient port results in slower economic growth as well as increasing international trade costs that negatively impact the competitiveness of the South African industry (World Bank Group Citation2021).
3.2 Peru
The Peruvian economy has experienced significant growth over the last decade, including notable growth in the fruit industry (Perea et al. Citation2019). Table grapes are the highest-valued export fresh commodity in the country, amounting to $1.23 billion compared to $1,08 billion from Chile and $868 million from South Africa (Prom Peru Citation2020; OEC Citation2021). Overall, table grape production increased from 297,000 tonnes in 2010/2011 to 776,000 tonnes in 2022/2023. This has made the country the second-largest exporter in the world and in the Southern Hemisphere, with a relatively stable market share of 13.5% over time. Peru’s main export destination is the North American market, with the USA taking 46.3% of exports and Mexico some 5.8% (ITC Citation2024).
Peruvian exporters benefit from an even climate, availability of suitable land, relatively cheap labour and a low incidence of pests and diseases. The growth in exports is due to intense and sustained growth in vineyards, now at 35 000 hectares (USDA Citation2023a, Citation2023b), an improvement in production methods, higher yields and strong varietal change (TopInfo Citation2021). The cultivar composition has changed from 81% traditional seedless cultivars and only 17% licensed seedless cultivars in 2015/2016 to 51% traditional seedless and 40% licensed seedless in 2018/2019 in reaction to market signals (Léon Citation2019), giving it a competitive edge (Msantini Citation2022). Peru also has a largely stable climate, except when experiencing an El Niño phenomenon (Léon Citation2019).
3.3 Chile
Chile is the world’s leading table grape exporter, with a world market share of 18.1% (ITC Citation2024). However, Chile’s production has declined by 40% from 2010/2011 to 2022/2023 (USDA Citation2023a). Over the last few years, Chilean exporters have lost market share, largely through their inability to compete with new suppliers (Nardone, Santeramo, and Seccia Citation2015). Their main exporting destinations are the US (41.3%) and China (20.2%), followed by Korea (6.1%), the Netherlands (4.9%) and the UK (4.8%) (ITC Citation2022a).
The area planted to table grapes in Chile has declined to 45 345 ha over the last decade. Chile’s main table grape production consists of older varieties, namely Red Globe, Thompson Seedless and Crimson Seedless. In the last few years, the country has started to plant more new varieties that are in demand, but at a slower pace than Peruvian and South African producers. In 2015, the Global Climate Risk Index ranked Chile in the top 10 countries that are affected most by climate change (The Nature Conservancy Citation2022). The country is also currently in a ten-year megadrought that is not only a major environmental problem but has also resulted in social and economic problems. A major constraint on Chile’s table grape industry is the country’s increasingly high labour cost as a result of continuous wage increases over the past few years (Trading Economics Citation2022).
4. Data and methodology
A wide range of secondary data was sourced for the different measures used here. Trade data came from two data platforms of the International Trade Centre (ITC), namely Trade Map (ITC Citation2022a) and Market Access Map (ITC Citation2022b), from the USDA, and the UN Comtrade database (Citation2022). Production data was sourced from the Abstract of Agricultural Statistics for South Africa (DAFF Citation2021), the Office of Agrarian Studies and Policies (ODEPA, n.d.) for Chile and the agrarian news agency Agraria.pe for Chile (Agraria.pe Citation2022).
The distortions faced by table grape producers in Chile, Peru and South Africa were compared by calculating the nominal rate of assistance (NRA) to producers. NRA calculations gave an indication of the policy environment in which a specific agricultural sector in a country operates (Anderson et al. Citation2006). In this regard, welfare is maximised in the absence of externalities, trade distortions wholesale and retail marketing margins, and domestic and international trading costs. This can be expressed as (Anderson et al. Citation2006):
(1)
(1) where DFP is the domestic farm gate price for a product, and CPP is the consumer product price of a product equal to E times P, where E is the domestic currency price of foreign exchange and P is the foreign currency price in the international market of an identical product.
Any externalities or market failures through government actions will reduce welfare. If, for example, then the state levies an ad valorem tariff on imports, denoted as , this will have the same welfare impact as a production tax or subsidy (sf or -sf) at the same rate
. If the tariff is the only distortion, the effect on producer incentives can be measured as the nominal rate of assistance (NRA) to farm output as a result of border price support (
). This relationship is expressed by EquationEquation 2
(2)
(2) (Anderson et al. Citation2006), where tm can be replaced by sf or -sf.
(2)
(2) Exchange rates can also lead to distortions in prices, and impact the “E” in the equation. The exchange rate-driven distortion must be analysed to determine what domestic currency price of foreign exchange (E) to apply to the three countries.
The NRA does not measure competitiveness per se, hence the relative trade advantage (RTA), normalised revealed comparative advantage (NRCA) and the logarithmic relative export advantage (InRXA) were used (Benalywa et al. Citation2019). These measures take real-world conditions, with different trade regimes and market distortions, into account. One shortcoming is that they do not explain how a country obtained its global market share, only that it exists (Esterhuizen, D’Haese, and Van Rooyen Citation2006).
The RTA accounts for the exports and imports of a traded commodity by considering it within the context of all traded goods in a country and globally. In the process, it provides an overarching view of a commodity’s competitiveness by implicitly weighing the revealed competitive advantage where the relative importance of imports and exports is considered. In the process, it removes biases that can creep in with products imported with the sole purpose of being re-exported (Jantjies, 2024). The RTA is calculated as the difference between the relative export advantage (RXA) and relative import advantage (RMA), and is formulated as follows (Vollrath Citation1991):
where RXA is calculated as follows:
(3)
(3) and RMA is calculated as follows:
(4)
(4) where X refers to exports and M refers to imports, and the superscripts a, i, r and n, respectively, referring to any specified commodity (i.e., table grapes), any specified country (i.e., Chile, Peru, or South Africa), world minus country i (i.e., world minus Chile/Peru/South Africa) exports (imports), and all traded commodities minus commodity a.
Several studies show that the advantage of using the logarithmic form is that the indices become symmetric through the origin (Ferto and Hubbard Citation2002; Vollrath and Vo Citation1988), giving a more accurate measure of competitive advantage (Dordevic, Cavlin, and Ignjatijevic Citation2014).
(5)
(5) The natural log of the relative export advantage (lnRXA) uses only export data, whereas RTA also takes import data into account. Furthermore, the natural log is used to find the power that a given base must be raised to in order to get the input value. The advantage of using all three methods is that they measure competitiveness under real-world conditions (Benalywa et al. Citation2019, Jantjies, 2024).
The Normalised Relative Comparative Advantage (NRCA) can also be used to measure and compare competitiveness (Yu et al., Citation2009). With the NRCA, normalised inter-country-based comparisons can be done, reducing the impact of the structure of local economies in the index. The NRCA models the degree of deviation of actual exports over a period from a neutral level (Jantjies, 2024).
(6)
(6) where X refers to exports, and the superscripts a and i, respectively, refer to any specified commodity (i.e., table grapes), and any specified country (i.e., Chile, Peru or South Africa).
Given that the competitive trends were used in this study rather than ranked values, it was found that these measurements would suffice to provide a comprehensive overview of the competitiveness of the table grape industry (Seymen and Utkulu Citation2004). Recall, however, that competitiveness may be the result of government intervention in the form of policies that distort markets, and that such policies can change.
The cost, insurance and freight (CIF) and free-on-board (FOB) values of exports from each country were also calculated in order to obtain a deeper understanding of their competitiveness as freight cost plays a role in deciding the best portfolio of export markets. Tariff and non-tariff barriers facing producers in each country were used to support the findings of the NRA analysis. Other factors that also have an impact on the competitiveness of table grape exports include quality, cultivar choice and the country’s relationship with the EU market. Qualitative information was used to support the interpretation of the impact of these factors. Finally, the months in which South Africa is earliest in the EU market were identified in order to assess when, on average, exports from Chile and Peru become the biggest threat to South African producers.
5.5 Results and discussion
5.1 Understanding policy implications: the nominal rate of assistance
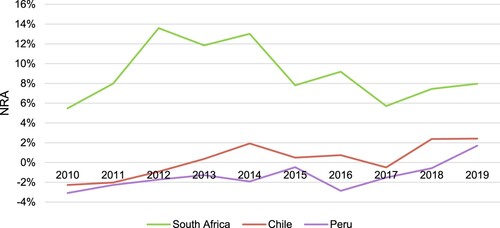
shows that the NRA for table grapes exports from South Africa has been positive since 2010, but has declined since 2012 to the point where it is now at the same level as in 2011. Given that South African producers receive no direct subsidies, the NRA is equal to border price support. Peru’s NRA, on the other hand, shows a gradual but volatile upward trend, starting from −3.08% (denoting negative support/taxation) to positive support of 1.70% in 2019. Chile’s NRA values started at −2.27% in 2010, increasing to 2.24% in 2019, i.e., a slight increase from being taxed in the early years to a small but positive level of subsidisation. South African exporters have had an advantage over their Peruvian and Chilean competitors throughout the study period.
Figure 1. Three-year moving average of NRAs in table grape exports: 2010–9.
Source: Author’s calculation from ITC (Citation2022a, Citation2022b), DAFF (Citation2021), ODEPA (n.d.), and Agraria.pe (Citation2022).
However, movements in exchange rates must also be taken into account. These affect the prices of goods and determine whether an export market is attractive or not. Recent exchange rate uncertainty has also negatively affected the fresh fruit trade globally – exchange rate volatility affects sectors differently due to different degrees of openness to international trade. However, examining only the country’s currency strength against the US dollar can be misleading, and therefore the nominal effective exchange rate (NEER) was used to ascertain the nominal value of the country’s currency. The NEER is the weighted exchange rate of the country’s exchange rate measured against a basket of currencies, in this case from the country’s 20 key trading partners. Lastly, the real effective exchange rate (REER) for each country shows how the external value of a country’s currency affects the country’s trading competitiveness by adjusting for inflation (Day Citation2018). The NEER and REER become important when we want to determine whether the change in the exchange rate will benefit or harm the industry.
In this study period, the rand depreciated considerably against the dollar – by 50% – from R7.45/$ in 2010 to R14.91/$ in 2021. During this period the NEER depreciated by less, indicating that the rand’s weakening against the basket of currencies was less dramatic than against the dollar. Furthermore, South Africa’s inflation rate was between 4% and 6% over the study period, further reducing the real impact of the effective exchange rate (World Data Citation2022a). The REER is thus an indication of trade competitiveness, where a decrease in REER means a gain in trade competitiveness, as has been the case for South Africa (IMF Citation2022).
The trends for Chile were similar to those of South Africa. Peru, however, differs, as the weakening of the sol against the dollar was at a slower rate than that of the relevant basket of currencies. Furthermore, Peru has experienced much lower inflation (in the range of 1% to just over 3% over the decade) (World Data Citation2022b), thus the NEER and REER have moved in a close band. Peru’s REER was stable over the 10 years, indicating less of an advantage from exchange rate movements than has been the case for South Africa and Chile.
South Africa’s agricultural sector, including the table grape industry, has experienced considerable social, political and economic upheaval since the start of the democratisation process in 1994 (Sandrey et al. Citation2008). In addition, the performance of the table grape industry is influenced by many factors, such as cultivar development, market access, drought, increases in labour costs increasing input costs such as fuel, fertilisers, and electricity, and skewed and inadequate infrastructure. Nevertheless, the country’s agricultural sector output has doubled in real terms since 1994 because of the increase in productivity and exports (following the era of boycotts and sanctions under apartheid), and table grapes have played a large role in this regard (Kirsten and Sihlobo Citation2022). However, depreciation of the exchange rate can provide temporary benefits only when a large proportion of inputs are imported, as is the case with South African agriculture generally (BFAP Citation2021).
Peru is currently one of Latin America’s best economic performers, with stable macroeconomic policies (IMF Survey Citation2015). In 2002, Peru adopted a formal inflation-targeting monetary policy, which was successful in reducing inflation to the lowest level in Latin America. Peru’s economy started to recover in 2010 as monetary policies were tightened, resulting in a more stable macroeconomic environment (International Institute for Sustainable Development [IISD] Citation2015). Trade openness was supported by an expansion of exports, also because of trade liberalisation and free-trade agreements (FTA) that were established with key trading partners (Wong Citation2015). Deregulation in markets and the removal of the ban on the sale and purchase of agricultural land in the 1990s led to an increase in productivity in the agricultural sector, resulting in an expansion of land in both the northern and southern parts of Peru and the transformation to higher value products, one being table grapes (Alcaraz et al. Citation2020). One of Peru’s greatest achievements in the last 20 years is the country’s boom in agricultural exports. This is especially true for Peru’s export fruit and vegetable industry.
Chile is among the ten countries globally with the lowest level of subsidies for agriculture (ODEPA Citation2019). Government support creates limited distortions in the agricultural sector in general and in table grapes in particular, with almost no price subsidy for farmers (ODEPA Citation2019). Indirect interventions, such as exchange rate depreciation and industrial protection, influence the agricultural environment to a greater extent than direct sectoral policies. The worrying factors that influence the table grape industry are the appreciation of the exchange rate and the labour intensity of the sector (Anderson and Valdes Citation2008). Therefore, the policy environment faced by table grape producers in Chile can mostly be explained by the effect of a fluctuating exchange rate. Nevertheless, the industry is challenged by rising input costs, and specifically labour costs in a labour-intensive industry.
In summary, while all three countries face unique challenges, South African exporters have benefited most from the depreciation of the currency. Peruvian and Chilean exporters are, however, catching up, with the result that South Africa’s table grape exporters will become less competitive over time.
5.2 Understanding competitiveness: the revealed comparative advantage
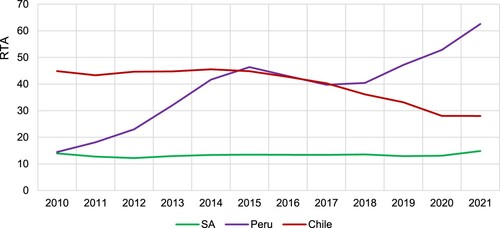
The purpose of the RTA analysis is to contextualise table grape trade value from a country (South Africa, Peru or Chile) within the context of its total trade and express its competitiveness by scaling it to global table grape trade within the context of total global commodity trade. The RTA of a commodity for a country identifies countries that enjoy a relative advantage in a particular commodity. The RTA index results in shows that South Africa has a competitive advantage in table grape trade. However, in comparison, Peru, enjoys a strong global competitive advantage, with an increasingly positive trend, while Chile also shows global competitiveness in table grapes, although at a declining rate since 2014. The average annual growth rate of table grape output for South Africa over the past decade was 1.15%, for Peru 13.03%, and −7.10% for Chile. This indicates that Peru’s competitiveness in the table grape industry is growing faster than that of Chile, which is decreasing, whereas the extent of South Africa’s competitiveness has remained constant.
Figure 2. Three-year moving average comparison of RTAs in table grape exports: 2010–21.
Source: Author’s calculation from ITC (Citation2022a, Citation2022b).
According to Vollrath (Citation1991, 275), the natural log of the RXA “preserves the unambiguous economic interpretation of revealed comparative advantage as being equivalent to deviations of actual from expected trade”. It is therefore sometimes preferred because it is less exposed to policy-induced distortions, although the RTA is a truer reflection of the actual comparative advantage. Thus, the lnRXA could almost be viewed as an “if no policy-induced distortion exists”-type of analysis. Similar to their RXA index values, all three countries show a positive lnRXA measurement, indicating that they all have a global comparative advantage in table grape exports (). Peru has an increasing trend in the lnRXA index, whereas the converse is true for Chile, with South Africa maintaining a neutral trend over the study period. The application of the lnRXA measurement does not change the results of each country’s competitiveness in tradable table grapes but rather affirms it.
Table 1. Comparison of three-year moving average lnRXAs in table grape exports: 2010–21.
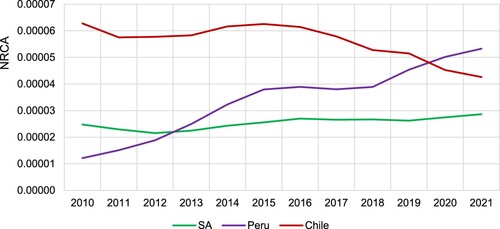
A final measure of comparative advantage is the NRCA index, which is comparable across commodity, country, and time, to support the results obtained thus far. The reason for this is unlocked in the formula, which considers total global exports of all commodities and total global table grape exports to normalise the export of table grapes (). While the trends are similar to the RTA and the lnRXA, the intercept of the trend line for Peru and Chile is only observed between 2019 and 2020, later than in the other analyses. This may be due to the fact that the normalisation resulted in a slower than previously observed downward trend in the comparative advantage of Chilean table grape exports. The NRCA results also reaffirm that Peruvian table grape exporters enjoy a bigger comparative advantage, followed by Chile, with South Africa trailing since 2013.
Figure 3. Three-year moving average comparison of NRCAs in table grape exports: 2010–21.
Source: Author’s calculation from ITC (Citation2022a, Citation2022b).
These three countries have the same counter-seasonal advantage in table grape exports and are the main competitors for market share in the EU and UK markets, with Peru the largest, and Chile a significant but diminishing threat. Furthermore, all three countries face the threat of rapid and unpredictable changes in consumer preferences (Mashabela and Vink Citation2008). At the same time the EU and UK table grape markets are mature, with limited scope for growth (Van de Klundert Citation2021) – evident in the slow annual average growth of 1% in imports into these markets from the Southern Hemisphere from 2010 to 2020 (ITC Citation2022b).
Nevertheless, Peru and South African exporters have been able to gain market share at the expense of Chilean exports. South African exporters grew their sales by 18% from 2016 to 2020, while Peruvian exporters were able to increase sales by 53%. Given that South African exporters are more dependent on these two markets, the threat from Peru is all the more real.
5.3 Understanding the impact of freight rates: FOB and CIF
Transportation costs play a vital role in the analysis of international trade (Hummels and Lugovskyy Citation2003). Transport cost gives a better understanding of the relationship with the global geography of trade prices and volumes (Gaulier et al. Citation2008). The indirect measures used in this study are distances between South Africa, Peru and Chile’s main trading partners, as well as the cost, insurance and freight (CIF) and free on board (FOB) values.
Two factors drive the average cost of shipments, namely demand and supply on the shipping route, and the distance between trading partners. Higher freight cost, whether as a result of high demand on the route or as a result of the direct fuel expenditure due to the travel distance, is expected to negatively affect a country’s trade flow, especially if alternatives are available. Transport cost increases due to long distances to importing markets, and the time of transport is therefore a barrier to international trade (Jenserud Citation2018).
The FOB and CIF unit values give an estimate of the freight and insurance costs that each country that is exporting and importing must carry. The Netherlands pays a premium price for both South African and Peruvian table grapes, although the premium price decreased over the study period for both countries. While the price received by Peruvian exporters declined, they still gained higher prices on average than their South African competitors, whose prices received declined even more, largely because of the increase in table grape export volumes in a mature market. This is a concern that has been exacerbated by increasing freight costs, which means that table grape exporters receive smaller profits. This pattern is replicated in the UK table grape market. Therefore, it appears that because of substantial premiums in the market and despite the implied freight cost for Peru, Peruvian export unit values remain consistently higher than both South Africa and Chile’s to these markets.
5.4 Understanding trade barriers: tariff and non-tariff measures
The final was to determine the extent to which trade barriers play a role in the competitiveness of the table grape exports of the three countries to the EU and the UK. In the event, all three of these countries have preferential free trade agreements with the EU and the UK, allowing them to export their table grapes at a 0% tariff (ITC Citation2022b).
There is a similar situation regarding non-tariff barriers (NTBs) applied by the EU and UK. While these NTBs are an important hurdle to overcome when the exporters from the three countries want to export to the EU and UK markets, they are exactly the same for all three countries. The NTBs represent a fixed cost of trade, for example in the certification needed to export the commodity to a specific market. Gaining these certifications can take long and involve costs such as the inspectors that must come out and the research that must be done on potentially harmful pests. These legal requirements that must be met by exporters in a country can be classified into quality and marketing, phytosanitary regulations and packaging.
6. Summary and implications
The study aimed to determine whether South African table grape exporters have been effective in countering the onslaught of South American exports into the EU and UK markets. The South African table grape industry has to understand the extent to which these exogenous changes affect its ability to compete in these markets. To this end, competition from Chilean and Peruvian producers in the form of changes in their portfolios of table grape exports (volumes, destinations, timing, cultivars, etc.) and the support that their governments are providing was deemed of critical importance.
A range of measures were employed to address this question, including nominal rates of assistance and revealed comparative advantage analyses to better understand the implications of policy decisions, exchange rates, weather conditions and investment in vineyards on the ability of South African table grape exporters to compete. To understand the competitiveness and impact of distortions, the study also included an analysis of indirect freight cost measures and trade barriers.
The NRA analysis showed that while South African table grape exporters are operating in a supportive environment, the support has been declining over the period analysed. In contrast, both Peruvian and Chilean table grape exporters have experienced a switch from taxing to supportive over the same period as South African table grape exporters experienced a decline in support. Exchange rates are one of the key drivers in NRA analyses, with a weakening of the local currency against the US$ typically improving the NRA. While Peru’s currency remained fairly stable against the US$, the currency of both South Africa and Chile weakened against the US$ over the analysed period. Thus, despite the weakening of the rand, which in theory should improve the NRA for South African table grapes, a decline in support was observed. One can therefore conclude that the decline could have been more substantial if the local currency retained its value better.
The main goal of each country’s table grape industry is to export table grapes at a profit to remain competitive in the global industry. The profitability of table grape production is a function of the interaction between demand and supply (i.e., market prices), the exchange rate, and input costs. Even though the exchange rate is not an explicit policy factor, it has the largest effect on the export-oriented table grape industry, which is open to global market competition. South Africa’s depreciating rand is an advantage for South Africa’s table grape producers and exporters, as long as market prices in rand terms remain above the production cost, as some inputs are imported. Peru experienced minimal exchange rate fluctuations, resulting in a relative depreciating advantage compared to South Africa. Chile experienced a similar exchange rate scenario as South Africa. However, South African table grape exporters will gain more competitiveness if input costs can be lowered.
The results on the aggregate level highlight that South Africa’s industry operated in a supportive environment throughout the 10-year study period, while Peru and Chile’s industry moved from being “taxed” to a supportive environment. Taking the distortion estimates into consideration, together with the competitiveness measurement, the results highlight that Chile’s industry is losing competitiveness, while Peru’s is gaining momentum. Even though South Africa’s exporters are being supported by the depreciating exchange rate, the industry has not managed to gain competitiveness against especially Peru.
In this regard, the evidence shows that the Chilean table grape industry is not a major threat to South Africa’s exports in the EU and UK markets. On the other hand, Peru’s industry experienced exponential growth over the study period, effectively overtaking South Africa and becoming a significant threat, especially in the EU market. Furthermore, Peru has the potential to become even more competitive in the future. As Peruvian volumes grow at a faster rate than Chilean volumes decline, South Africa’s competitive position comes under threat and, through the recursive effect of increasing volumes negatively affecting market prices, South Africa is struggling to impose dominance, despite increasing its market offering. The freight cost is also increasing, which places downward pressure on FOB prices, which are mostly borne by producers and exporters.
Nevertheless, South Africa’s early producing areas are largely safeguarded against the Peruvian onslaught due to the timing of the market. As the grape season unfolds and Peru’s volumes and timing change, however, South Africa’s position in the EU market will become even more threatened. In this regard, this research has shown that Peru’s greater competitiveness originates from a more stable macro environment: a similarly stable environment is likely to favour the competitiveness of the South African industry. This can be done through greater political stability, as well as better economic governance in order to ensure a more stable macroeconomic environment. Consequently, a greater focus on the modernisation of the country’s economy such as better use of new technologies in production, the cold chain and better-maintained infrastructure can also contribute to a more stable economy.
South Africa’s table grape export volumes are forecasted to increase, albeit at a decreasing rate, as production is still growing. However, constrained port operations affect the quality of grapes and lead to uncertainty in the ability to trade. Therefore, a stable and favourable policy environment, with improved and sufficient infrastructure, including roads, ports, electricity and water, is required for sustained growth. Lastly, market development outside of Europe, especially in countries and regions where South Africa would typically have a shorter shipping distance advantage and/or fewer trade barriers, for example, the Middle East, should also be explored.
The key findings can be summarised by taking the aggregate table grape distortion estimates, the global competitiveness, indirect freight cost and trade barrier results and trends into account. How these different measures collectively describe the current environment for South African table grape exporters, provides critical insight that would directly and indirectly affect investment decisions changing the trajectory of area and volume. In terms of the nominal rate of assistance, both Peru and Chile moved from taxing to supporting producers, while South African exporters experienced a declining, but still supportive policy environment. Exchange rate devaluation plays a big role in support of South African and Chilean producers. However, Peruvian table grape exports are a much bigger threat for South Africa, with a strong positive trend observed in its revealed comparative advantage. While the trade barriers analysis determined that all three competitors face the same non-tariff measures in the EU and UK markets, with no distortion from tariffs, the distance to market and premiums realised do affect marketing decisions and ultimately competitiveness. Whereas South Africa enjoys the advantage of the shortest distance to market, Peruvian table grape exports realised much bigger premiums in European markets. In both these measures – distance to market and price premiums – Chile is at a disadvantage.
This study applied several measures to better understand where South Africa’s table grape industry competitiveness lies compared to Peru and Chile. The results can be used to arrive at clear and practical conclusions. This provides a framework for further analyses between South Africa and other competitors in all agricultural commodity markets and over different periods of time.
Disclosure statement
No potential conflict of interest was reported by the author(s).
References
- Alcaraz, A., A.G. Black, G. Munoz, and A.A. Garcia. 2020. Analysis of policies agricultural in Peru 2014-2018. agricultural policy reports. Washington, DC: Inter-American Development Bank.
- Allen, Summer L.; Kassie, Girma T.; Majeed, Fahd; and Tokgoz, Simla. 2021. Policy-induced market distortions along agricultural value chains: evidence from Ethiopia and Nigeria. IFPRI policy brief May 2021. Washington, DC: International Food Policy Research Institute (IFPRI). doi:10.2499/9780896294158
- Anderson, K., and A. Valdes. 2008. Distortions to agricultural incentives in Latin America and the Caribbean. agricultural distortions working paper No. 70. Washington DC: World Bank.
- Anderson, K., Martin, W., Sandri, D. & Valenzuela, E. 2006. Methodology for measuring distortions to agricultural incentives. Agricultural Distortions Working Paper No. 2. Washington DC: World Bank.
- Anelich, L., T. Davids, M. Delport, J. Kirsten, F. Meyer, W. Sihlobo, and H. Vermeulen. 2022. A sector-wide review of the COVID-19 impact on the South African agricultural sector during 2020–21. Agrekon 61, no. 1: 3–20. DOI: 10.1080/03031853.2022.2030241.
- Agethen, K., M.I. Almadani, I. Behrendt, C. Chibanda, C. Deblitz, H. Garming, T. Lasner, et al. 2020. The typical farm approach and its application by the agri benchmark network. Agriculture [Electronic] 10, no. 12: 646.
- Agraria.pe. Agencia agraria de noticias. 2022. https://agraria.pe.
- Benalywa, Z.A., M.M. Ismail, M.N. Shamsudin, and Z. Yusop. 2019. Revealed comparative advantage and competitiveness of broiler meat products in Malaysia and selected exporting countries. International Journal of Business and Society 20, no. 10: 383–96.
- Belrose, Inc. 2018. World apple review. https://www.e-belrose.com/apple-world-review/ [October 10, 2022].
- BFAP. 2021. BFAP baseline agricultural outlook 2021–2030. https://www.bfap.co.za/wp-content/uploads/2021/09/BFAP-Baseline-2021.pdf (accessed October 17, 2022).
- BFAP. 2022a. Enhance the decision support tool for improved efficiency of containerized cargo exports through the port of Cape Town – specifically for wine export. https://www.westerncape.gov.za/assets/departments/economic-development-tourism/report_bfap_final_0.pdf (accessed May 13, 2023).
- BFAP. 2022b. Fruit logistics BRIEF. https://www.bfap.co.za/wp-content/uploads/2023/04/Logistics_Brief_May2022.pdf (accessed May 13, 2023).
- Boonzaaier, J.D.T.L.. 2015. An inquiry into the competitiveness of the South African stone fruit industry. Unpublished Master's thesis. Stellenbosch: Stellenbosch University.
- Cloete, K., Davids, T. & Vink, N. 2022. COVID-19 and the South African wine industry. Agrekon. 61, no. 1:42-51. DOI: 10.1080/03031853.2021.1975550.
- Day, M.R.R. 2018. The distortions to incentives in South African agriculture: A case study of the wheat industry (unpublished master’s thesis). Stellenbosch: Stellenbosch University [Online]. Available: http://hdl.handle.net/10019.1/103282 (accessed December 20, 2021).
- DAFF. 2020. A profile of the South African table grape market value chain. https://www.dalrrd.gov.za/doaDev/sideMenu/Marketing/Annual%20Publications/Table%20Grape%20Market%20Value%20Chain%20Profile%202020.pdf (accessed May 9, 2022).
- DAFF. 2021. Abstract of agricultural statistics. Pretoria: DAFF.
- Dordevic, D., M. Cavlin, and S. Ignjatijevic. 2014. Measurement of comparative advantages of processed food sector of Serbia in the increasing the export. Ekonomika Poljoprivrede 61, no. 3: 677–93.
- Davids, T., M. Delport, D. Jordaan, F. Meyer, T. Reardon, G. Van Den Burgh, and M. Van Der Merwe. 2022. Hotspots of vulnerability and disruption in food value chains during COVID-19 in South Africa: industry- and firm-level “pivoting” in response. Agrekon 61, no. 1: 21–41. DOI: 10.1080/03031853.2021.2007779.
- Esterhuizen, D., L. D’Haese, and J. Van Rooyen. 2006. An evaluation of the competitiveness of the agribusiness sector in South Africa. Competition Forum 4, no. 1: 71.
- Esterhuizen, D., D’Haese, L. & Van Rooyen, J. 2008. An evaluation of the competitiveness of the agribusiness sector in South Africa. Advances in Competitiveness Research, 16, no 1-2: 31.
- Ferto, I. & Hubbard, L.J. 2002. Revealed comparative advantage and competitiveness in Hungarian agri-food sectors technology foresight in Hungary. IEHAS Discussion Papers, No. MT-DP – 2002/8. Budapest: Hungarian Academy of Sciences, Institute of Economics, Budapest. https://www.econstor.eu/bitstream/10419/108046/1/MTDP0208.pdf (accessed August 15, 2022).
- Freebairn, J. 1986. Implications of wages and industrial policies on competitiveness of agricultural export industries. Australian Agricultural Economics Society Policy Forum, 55, no. 1: 1-9.
- Gaulier, G., Mirza, D., Turban, S. & Zignago, S. 2008. International transportation cost around the world: A new CIF/FoB rates dataset. http://www.cepii.fr/baci_data/freight_rates/freight_rates_doc.pdf (accessed September 16, 2022).
- Gerber, L.G., Havenga, J. & Simpson, Z. 2017. International trade logistics costs in South Africa: informing the port reform agenda. Research in Transportation Business & Management, 263-275.
- Hummels, D., and V Lugovskyy. 2003. Usable data? Matched partner trade statistics as a measure of international transportation costs. https://www.researchgate.net/publication/228807850_Usable_Data_Matched_Partner_Trade_Statistic (accessed August 29, 2022).
- IMF. 2022. What is real effective exchange rate (REER)? http://datahelp.imf.org/knowledgebase/articles/537472-what-is-real-effective-exchange-rate-reer (accessed August 1, 2022).
- IMF Survey. 2015. Peru recovering gradually after slowing in 2014. https://www.imf.org/en/News/Articles/2015/09/28/04/53/socar052715a (accessed April 22, 2022).
- IISD. 2015. Peru: Timeline of agricultural transformation, 1960-2015. Available: https://www.iisd.org/sites/default/files/uploads/peru-agricultural-transformation-timeline.pdf (accessed November 7, 2022).
- ITC. 2022a. Trade Map. http://www.trademap.org [2022, January 24].
- ITC. 2022b. Mac Map. https://www.macmap.org/ [2022, September 15].
- ITC. 2024. Trade Map. http://www.trademap.org [2022, January 24].
- Jenserud, I. 2018. Analysing measurements of international transportation costs. Unpublished master’s thesis. Potchefstroom: North West University. https://repository.nwu.ac.za/bitstream/handle/10394/30991/Jenserud_I.pdf?sequence=1&isAllowed=y (accessed September 29, 2022).
- Kassie, G.T., Martin, W., and Tokgoz, S. 2022. Analysis of the impacts of agricultural incentives on the performance of agricultural value chains. IFPRI discussion paper 2127. Washington, DC: International Food Policy Research Institute (IFPRI). doi:10.2499/p15738coll2.135936
- Kirsten, J., and W. Sihlobo. 2022. Agriculture in South Africa. In The Oxford handbook of the South African economy, eds. A. Oqubay, F. Tregenna, and I. Valodia, 195–215. Oxford: Oxford Academic.
- Laborde Debucquet, David, Will Martin, and Dominique van der Mensbrugghe. 2017. Measuring the impacts of global trade reform with optimal aggregators of distortions. Review of International Economics 25, no. 2: 403–25. doi:10.1111/roie.12271.
- Léon, A.F. 2019. Peruvian table grape industry overview. Global Grape Summit 2019. 5 June, London.
- Markman, N.H. 2019. Perspectives on agribusiness and sustainable development from within Chile and Peru’s table grape industry. Unpublished Master’s thesis. Davis: University of California [Online]. Available: https://iad.ucdavis.edu/sites/g/files/dgvnsk4906/files/inline-files/Noah%20Klein- Markman_capstone%202019.pdf (accessed May 20, 2022).
- Martin, Will. 2021. Tools for measuring the full impacts of agricultural interventions. IFPRI – MCC technical paper series: prioritizing agricultural investments for income, poverty reduction, and nutrition 2. Washington, DC: International Food Policy Research Institute (IFPRI); and Millennium Challenge Corporation (MCC). doi:10.2499/p15738coll2.134777
- Mashabela, T.E., and N. Vink. 2008. Competitive performance of global deciduous fruit supply chains. South Africa versus Chile. Agrekon 47, no. 2: 240–57.
- Maspero, E. & Van Dyk, F.E. 2004. An analysis of South Africa’s fruit logistics infrastructure. Orion, 20, no. 1:55- 72.
- Ministry of Agrarian Development and Irrigation. 2019. Grape exports continue to rise and more than 184 thousand tons were placed in the first quarter of 2019. https://www.gob.pe/institucion/midagri/noticias/27757-exportaciones-de-uva-siguen-en-alza-y-se-logro-colocar-mas-de-184-milm-toneladas-en-primer-trimestre-de-2019 [2022, September 22].
- Msantini. 2022. Table grape area in Peru does not increase, although production volume increases rapidly [in Spanish]. https://www.agroforum.pe/agro-noticias/superficie-de-uva-de-mesa-peru-no-aumenta-aunque-volumen-de-produccion-se-incrementa-de-manera-acelerada-19140/ (accessed August 19, 2022).
- Nardone, G., F.G. Santeramo, and A. Seccia. 2015. Trade competitiveness in table grapes: A global view. Outlook on Agriculture 44, no. 2: 127–34.
- ODEPA Oficina de Estudios y Politicas Agrarias. n.d. ¿Qué es Odepa? Available: https://www.odepa.gob.cl/institucional/que-es (accessed January 20, 2022).
- ODEPA Ministerio de Agricultura. 2019. Panorama de la Agricultura Chilena. Santiago: Chilean Ministry of Agriculture, Office of Agricultural Policies, Trade and Information. Available: https://www.odepa.gob.cl/wp-content/uploads/2019/09/panorama2019Final.pdf (accessed July 11, 2022).
- OEC. 2021. Observatory of Economic Complexity. https://oec.world/en/profile/hs/grapes# (accessed May 11, 2023).
- OIV. 2022. World Statistics. https://www.oiv.int/what-we-do/global-report?oiv (accessed January 31, 2023).
- Oxford Business Group. 2016. Peru seeks to maintain growth as demand for commodities falls. https://oxfordbusinessgroup.com/overview/balancing-act-ensuring-inclusive-growth-amid-falling-demand-commodities-peru%E2%80%99s-main-challenge (accessed May 10, 2022).
- Perea, H., M. Broncano, F. Grippa, and I. Mendoza. 2019. Report agricultural exports Peru. BBVA Research. https://www.bbvaresearch.com/en/publicaciones/peru-agricultural-exports-report/ (accessed August 22, 2022).
- Placek, M. 2022. Monthly container freight rate index worldwide 2019–2022. Available: https://www.statista.com/topics/9237/container-freight-rates/#topicHeader__wrapper (accessed May 14, 2022).
- Prom Peru. 2020. Blueberries & table grapes: Peru is a leading provider of fresh fruits to the world! Available: https://perutradeoffice.us/blueberries-table-grapes/ (accessed July 22, 2022).
- Sandrey, R., H.G. Jansen, N. Vink, T. Fundira, F. Meyer, C. Hughes, B. Nyhodo, and L. Smit. 2008. South Africa’s way ahead, looking east. Stellenbosch: Trade Law Centre for Southern Africa.
- Santeramo, F.G., E. Lamonaca, and C. Emlinger. 2023a. Technical measures, environmental protection, and trade, EUI, RSC, Working Paper, 2023/45, Global Governance Programme-509 - https://hdl.handle.net/1814/75784.
- Santeramo, F.G., M. Bozzola, and E. Lamonaca. 2023b. Impacts of climate change on global agri-food trade (July 6, 2023). Robert Schuman Centre for Advanced Studies Research Paper No. 2023_40. https://ssrn.com/abstract=4530102.
- Santeramo, F.G., and E. Lamonaca. 2022. On the trade effects of bilateral SPS measures in developed and developing countries. The World Economy 45: 3109–45. doi:10.1111/twec.13256.
- Santeramo, Fabio Gaetano, and Emilia Lamonaca. 2019. The role of non-tariff measures in the agri-food sector: positive or negative instruments for trade? MPRA Paper 96763, University Library of Munich, Germany.
- Santeramo, F.G., and E. Lamonaca. 2019. On the impact of non-tariff measures on trade performances of the African agri-food sector. Agrekon 58, no. 4: 389–406. doi:10.1080/03031853.2019.1568889.
- Santeramo, Fabio Gaetano, and Emilia Lamonaca. 2019. The effects of Non-tariff measures on agri-food trade: A review and meta-analysis of empirical evidence. Journal of Agricultural Economics 70, no. 3: 595–617. Web.
- Seymen, D., and U. Utkulu. 2004. Revealed comparative advantage and competitiveness: evidence for Turkey vis-à-vis the EU/15. Izmir: Economics Department, Dokuz Eylül University.
- SARB. 2022a. “QUARTERLY BULLETIN March 2022.” https://www.resbank.co.za/content/dam/sarb/publications/quarterly-bulletins/quarterly-bulletin-publications/2022/march/01Full%20Quarterly%20Bulletin.pdf (accessed May 11, 2023).
- SARB. 2022b. “QUARTERLY BULLETIN December 2022.” https://www.resbank.co.za/content/dam/sarb/publications/quarterly-bulletins/quarterly-publications/2022/december/01Full%20Quarterly%20Bulletin.pdf (accessed May 11, 2023).
- SATI. 2019. Sati statistical booklet. Paarl: SATI.
- SATI. 2023. Sati statistical booklet. Paarl: SATI.
- The Nature Conservancy. 2022. Santiago Water Fund. https://www.nature.org/en-us/about-us/where-we-work/latin-america/chile/stories-in-chile/santiago-water-fund/ (accessed September 11, 2022).
- Tokgoz, Simla; Allen, Summer L.; Majeed, Fahd; Paris, Bas; Adeola, Olajide; and Osabuohien, Evans. 2020. Distortions to agricultural incentives: evidence from Nigerian value chains. Review of Development Economics 24, no. 3: 1027-1045. doi:10.1111/rode.12664
- Tokgoz, S., and F. Majeed. 2019. Measuring distortions to agricultural incentives for value chain analysis: evidence from Indian value chains. Journal of Agricultural Economics 70, no. 2: 275–92. DOI: 10.1111/1477-9552.12305.
- Tokgoz, Simla. 2018. Distortions to agricultural incentives along value chains. AGRODEP technical note TN-16. Washington, DC: International Food Policy Research Institute (IFPRI).
- TopInfo. 2021. Notable changes mark table grape sector in Southern Hemisphere. https://www.freshfruitportal.com/news/2021/08/16/notable-changes-mark-table-grape-sector-in-southern-hemisphere/ (accessed June 17, 2022).
- Trading Economics. 2022. Peru minimum monthly wages. https://tradingeconomics.com/peru/minimum-wages (accessed May 15, 2022).
- United States Department of Agriculture (USDA). n.d. Farm production and conservation. https://www.usda.gov/our-agency/about-usda/mission-areas (accessed June 29, 2022).
- UN Comtrade Database. 2022. https://comtrade.un.org/ (accessed February 2, 2022).
- USDA. 2021. Fresh apples, grapes, and pears: World market and trade. https://apps.fas.usda.gov/newgainapi/api/Report/DownloadReportByFileName?fileName=Fresh%20Deciduous%20Fruit%20Annual_Lima_Peru_11-01-2021.pdf (accessed April 29, 2022).
- USDA. 2022a. Fresh apples, grapes, and pears: World markets and trade. https://apps.fas.usda.gov/psdonline/circulars/fruit.pdf (March 12, 2022).
- USDA. 2022b. Fresh deciduous fruit semi-annual. https://apps.fas.usda.gov/newgainapi/api/Report/DownloadReportByFileName?fileName=Fresh%20Deciduous%20Fruit%20Semi-annual_Santiago_Chile_CI2022-0009.pdf (accessed May 3, 2022).
- USDA. 2023a. Fresh apples, grapes, and pears: World markets and trade. Available: https://apps.fas.usda.gov/psdonline/circulars/fruit.pdf (accessed May 18, 2024).
- USDA. 2023b. Fresh deciduous fruit annual. https://apps.fas.usda.gov/newgainapi/api/Report/DownloadReportByFileName?fileName=Fresh%20Deciduous%20Fruit%20Annual_Lima_Peru_PE2023-0020.pdf (accessed May 18, 2024).
- Van de Klundert, C. 2021. Q&A with Origin Fruit Direct on evolution of EU grape market. https://www.producebusinessuk.com/qa-with-origin-fruit-direct-on-evolution-of-eu-grape-market/ (accessed July 20, 2022).
- Vollrath, T., and D.H. Vo. 1988. Investigating the nature of world agricultural competitiveness [Washington DC]: Agriculture and Trade Analysis Division, Economic Research Service, U.S. Department of Agriculture. file:///Users/jana-mart/Downloads/download%20(2).pdf (August 29, 2022).
- Vollrath, T. 1991. A theoretical evaluation of alternative trade intensity measures of revealed comparative advantage. Welwirthschaftliches Archiv 127, no. 2: 265–80.
- Wong, Y.W. 2015. Trade evolution and policy challenges. In Peru: staying the course of economic success. revised edition, eds. A. Santos, and A. Werner, 311–84. Washington: International Monetary Fund.
- World Bank Group. 2021. Transport Global Practice. The Container Port Performance Index 2021. https://thedocs.worldbank.original/Container-Port-Performance-Index-2021.pdf (accessed January 31, 2023).
- World Data. 2022a. Inflation rate in South Africa. https://www.worlddata.info/africa/south-africa/inflation-rates.php (accessed September 5, 2022).
- World Data. 2022b. Inflation rate in Peru. https://www.worlddata.info/america/peru/inflation-rates.php (accessed September 5, 2022).
- Yu, R., Cai, J. & Leung, P. 2009. The normalized revealed comparative advantage index. The Annals of Regional Science, 43: 267-82.