Abstract
New Zealand's economy remains highly dependent on agricultural production. There are 175,000 lifestyle blocks in New Zealand covering 873,000 ha, and these, along with urbanisation, potentially constrain future land productivity. Using GIS analysis to bring together data on land cover, land use, and lifestyle blocks, we find lifestyle blocks occupy 10% of New Zealand's high-class land, while urbanisation since 1990 occupies 0.5%. An average of 5800 new lifestyle blocks have been added every year since 1998. With one-sixth of all lifestyle blocks occupying high-class land, and an additional area affected by proximity factors such as ‘reverse sensitivity’ and the ‘impermanence syndrome’, both national monitoring of land fragmentation and policy interventions are urgently required.
Introduction
[The area] is so close to Wellington that it is gradually being cut up for residential sections. Gardeners have already been driven out of this portion, so the city must look elsewhere for its market supplies.
This comment on urbanisation from a newspaper article reflects current concern over the loss of valuable productive land (e.g. Mackay Citation2008; Palmer Citation2008; Horticulture New Zealand Citation2009; Rutledge et al. Citation2010; Mackay et al. Citation2011). However, while the area referred to in the quote above could easily be the Kāpiti Coast District today, in fact the extract is from a Wellington newspaper almost 100 years ago and refers to urbanisation of the Hutt Valley (Evening Post Citation1916, p. 11). With the help of the government of the day, some market gardeners in the Hutt Valley relocated to Ōtaki, itself an area now seeing increased rural subdivision.
The loss of productive land has been a political football in New Zealand for a long time, and shows no signs of being resolved. What has changed since 1916? Certainly the population is now much more urban: in 1916 the urban and rural populations were approximately equal, whereas the urban population is now over 85% (Pool Citation2011). Agricultural goods made up over 75% of New Zealand's merchandise exports in 1916 (Ballingall & Lattimore Citation2004), and while this has dropped significantly since then, it is still high at over 57% in 2011 (MAF Citation2011).
The Town and Country Planning Act 1953 introduced compulsory planning and restrictions on land use in rural zones. In 1973 the Act was amended to include, among other things, ‘the avoidance of encroachment of urban development on, and the protection of, land having a high actual or potential value for the production of food’, and this was carried over into the new Town and Country Planning Act 1977 (Baumgart & Howitt Citation1979). In 1991, the Resource Management Act (RMA) changed the focus of planning to independent impacts on the environment, removing the explicit concern for preserving food production potential (Palmer Citation2008).
While urbanisation has long been a cause of concern for the loss of high-quality food-production land, lifestyle blocks have more recently received attention as potentially locking productive land out of future production. In this paper, we investigate how much of New Zealand's high-class land is occupied by lifestyle blocks, and compare this to the rate of new occupation due to urbanisation between 1990 and 2008. We then explore the arguments for and against the protection of high-class land and discuss whether lifestyle blocks constitute loss of productive land. We conclude with a summary and recommendations for future work.
Lifestyle blocks
In the early 20th century, rural properties in New Zealand were small as land owners sought to feed themselves and make an income by selling surpluses. As specialisation increased, rural properties were consolidated into larger holdings and the number of smallholdings fell. This trend reversed in the late 1960s and early 1970s, with the harder times faced by farmers forcing them to diversify and sell parts of their land (McAloon Citation2009).
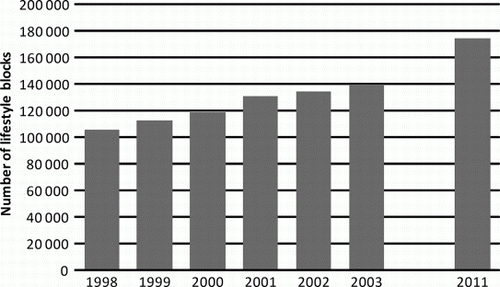
The number of small rural properties has grown substantially in recent decades. According to McAloon (Citation2009), the number of holdings below 40 ha was 15,302 in 1972, and this grew to 35,701 by 1992. Gouin (Citation2006) suggested this increase was largely because of new lifestyle blocks. The number of lifestyle blocks recorded in the national property valuation database has increased markedly since the late 1990s, from just over 100,000 in 1998 to the present figure of about 175,000 ().
Figure 1 Number of lifestyle properties indicated by the national property valuation database (Sanson et al. Citation2004; Terralink).
Surveys of owners of small rural properties have repeatedly shown a wide range of characteristics, such that it is difficult to generalise about such properties, and this reflects international experience (Daniels Citation1986). Land productivity, length of tenancy, motivations for ownership, off-farm income and rural experience are all highly variable (Fairweather Citation1996; Fairweather & Robertson Citation2000; Sanson et al. Citation2004; Isnard Citation2009; Property Economics Citation2009). Generally, though, studies suggest there are often significant benefits to rural residential subdivision, such as reinvigoration of rural communities, swelling of rural school rolls, building of resilience through diversifying production methods, and the improved quality of life of those with lifestyle blocks.
High-class land
High-class land is versatile and enables efficient production of (particularly) food. It has been rightly argued that high-quality soils are not the only requirement for efficient food production, with other factors such as climate, topography, infrastructure, labour supply, technology and the regulatory environment all being necessary for efficient food production (Treadwell Citation1996; Horticulture New Zealand Citation2009; Bloomer Citation2011). However, to equate these various factors would be invalid. There are several important attributes that differ among items in the list presented initially by Treadwell (Citation1996) and referred to in subsequent Environment Court cases. In the context of this article, chief among these attributes is the timescale and ease of their renewability.
Many of the geophysical attributes of high-class land are renewable only over a relatively long timescale and generally require non-engineering methods (e.g. restoration of soil structure by sowing grass and resting for up to 5 years), while improvement of a poor soil can take decades or longer, making soil recovery and creation an expensive exercise. Some attributes, such as climatic factors, are not under our direct influence. A site's slope and aspect can only be modified by use of engineering methods that tend to worsen other factors, particularly soil characteristics. In contrast, economic factors like supply of labour and its quality are partly under the influence of the regulatory environment, but are also subject to economic cycles. The effects of interactions with neighbouring landowners can be influenced in a number of ways, including mediation, communication and modified farming methods. The cost and time associated with renewing the geophysical attributes of land are therefore higher than those required for other attributes to change.
While the RMA removed the explicit protection of land for the purposes of food production, since the 1968 amendment to the Land Settlement Promotion and Land Acquisition Act there have been restrictions on the ownership of rural land by overseas persons and companies (Fairweather Citation1985). This general protection of rural land from potential loss to foreign parties contrasts with a lack of effective, nationally consistent, preventive measures against the gradual loss of the same productive land by urbanisation and subdivision.
International context
In only the last few years, urbanisation of the world's population passed 50% for the first time in history, while in developed countries the overall rate of urbanisation is about 77% (World Bank Citation2012). In opposition to the long and steady global march of urbanisation is a smaller, but still significant trend in developed countries of rural residential development (sometimes called ‘rural sprawl’), seen by some as part of a larger movement from productivism to post-productivism (Wilson Citation2001). In Australia, the UK, Canada and the USA,Footnote1 there has been considerable reporting and debate of rural land fragmentation, loss of agricultural land, and the success of policies aimed at preserving farmland.
In the USA, Daniels (Citation1986) asserts that the proliferation of American hobby farms ‘may threaten the future viability of commercial farm operations’ (p. 31) and claims ‘few restrictions have been placed on the creation of hobby farms’ (p. 34). Nelson (Citation1992, p. 467) reports that every state in the USA had farmland preservation policies, but highlights the particular success of such policies in Oregon in accommodating rural-residential development ‘without harming commercial farm operations’. In apparent contrast, Davis et al. (Citation1994, p. 56), in their summary of ‘exurban’ USA, could identify no major policy that ‘specifically deals with the management of exurban development’, but rather asserted that ‘all existing policies unwittingly stimulate or frustrate it’. In a discussion of the discourses and ideologies of farmland preservation, Bunce (Citation1998, p. 233) states ‘farmland preservation in North America remains a contentious issue which has failed to mature into an integrated element of rural land use planning’.
In an analysis of the five mainland states of Australia, Houston (Citation2005) found that agriculture in peri-urban regions contributed almost 25% of Australia's total gross value of agricultural production, which suggests the threat of their residentialisation may have a disproportionate effect on agricultural production. Butt (Citation2011, p. 3) reports that much of the peri-urban area surrounding Melbourne has experienced increasing lifestyle development and a decline in the number of commercial farm businesses and, despite policy intent, ‘the risks of the loss of a land resource seem to have rarely influenced long-term planning decisions’.
Some authors point to a contrasting development between North America and Western Europe, including the UK, where prevailing opinion holds that agriculture itself represents the main threat to rural areas (Bunce Citation1998; Holloway Citation2000; Wilson Citation2001). The rural landscape of the UK is markedly different from that in New Zealand, and there are several important factors at play in the residentialisation of rural land that are not present in New Zealand, including the ‘farming crisis’ (Holloway Citation2000), significant tax incentives (HM Revenue & Customs Citation2012), and the existence of numerous small villages, which provide intermediate opportunities for escape from urban life. In continental Western Europe, the proportion of the population living in rural areas is significantly higher than in New Zealand (World Bank Citation2012). A further important contrast between New Zealand's situation and that of other developed nations is the former's high economic dependence on agricultural production.
Data and methodology
Urban area data
Urban areas are readily observable from remotely sensed imagery, primarily based on building density. The Land Use and Carbon Analysis System (LUCAS) uses satellite imagery to help track land-use change for New Zealand's reporting under the Kyoto Protocol (MfE Citation2012). Maps for 1990 and 2008 have been created and a further map is planned for 2012. However, the urban areas (‘settlements’)—which are not important for the carbon accounting goal of LUCAS—are taken directly from maps of land cover in 1995/96 and 2002/03 (Land Cover Database versions 1 and 2 [MfE Citation2009]), and are therefore poor representations of urban areas in 1990 and 2008 (Shepherd & Newsome Citation2009). We have used the source LUCAS imagery (Landsat TM for 1990 and SPOT5 for 2008) and manually digitised urban areas for 1990 and 2008, giving a consistent pair of maps suitable for identifying areas of change. We estimate the overall mapping accuracy of urban areas to be greater than 97%.
Lifestyle block data
Property valuations are the main determinant of local government rates in New Zealand, and Land Information NZ (LINZ) provides Rating Valuations Rules under the Ratings Valuations Act 1998 ‘in the interests of ensuring a nationally consistent, impartial, independent, and equitable rating valuation system that can be monitored and audited’ (LINZ Citation2010, p. 1). As part of these rules, the territorial authority must assess the land use for each rating unit, including whether it is a lifestyle block defined as being (LINZ Citation2010, p. 60):
… generally in a rural area, where the predominant use is for a residence and, if vacant, there is a right to build a dwelling. The land can be of variable size but must be larger than an ordinary residential allotment. The principal use of the land is non-economic in the traditional farming sense, and the value exceeds the value of comparable farmland.
Key here is that the land is determined to be used in a ‘non-economic’ way, implying that revenues from production from the land are likely to be insufficient to cover the costs of the property. This judgement is made by the territorial authorities’ valuation contractors without access to the landowners’ accounts and the definition is therefore clearly open to inconsistent interpretation. It seems likely that, after use for a residence, the judgement of whether the farm is ‘traditional’ or not is the determining criterion in the categorical assessment. A highly productive, mixed-output smallholding could easily be classified as ‘non-traditional’. Despite these concerns, we believe this is the most robust dataset available for identifying lifestyle blocks in New Zealand. Data collected under the Rating Valuations Rules are collated by Quotable Value and matched to cadastral data by Terralink to create a coherent spatial database of property valuations. We have used a subset spatial dataset that flags individual properties as either lifestyle or not, and these data were extracted from Terralink's database in May 2011. Terralink's database indicates approximately 175,000 lifestyle blocks, comprising 198,000 land parcels, of which 135,000 parcels are in the North Island and 63,000 in the South Island. Lifestyle blocks occupy 546,000 ha in the North Island and 328,000 ha in the South Island, giving a national total of 873,000 ha, or about 5% of New Zealand's non-reserved land. By way of comparison, urban areas cover approximately 221,000 ha.
High-class land
While recognising that other factors are required for productivity of high-class land, in this article we limit our analysis to land's physical qualities: soil, climate, topography—qualities that are not readily modifiable. The Land Use Capability (LUC) classification is derived from assessment from all three of these qualities (Lynn et al. Citation2009). At its highest level, the LUC classification represents the versatility of an area of land, and classes 1 and 2 are generally considered to be versatile, although some practitioners add category 3e. In response to the newly apparent needs of the RMA, Webb and colleagues developed a definition of ‘high-class land’ and mapped this class at 1:50,000 scale across New Zealand (Webb et al. Citation1995). This new definition classifies high-class land in a similar way to class 1 and 2 land in the LUC classification, but with differences in the thresholds for climate, erosion and drainage class, among others. In particular, these new thresholds were chosen to be more defensible in the context of high-class land.
Analysis
The three spatial datasets were rasterised to a 15 m grid. Using ERDAS Imagine, the urban areas of 1990 and 2008 were differenced to obtain a national raster map of urbanisation. This raster map, and that of lifestyle blocks, was then overlaid on the raster map of high-class land. These data are suitable and reliable for analysis at the regional and national level, but their accuracy may not be suitable for more local analysis.
Results
Between 1990 and 2008, approximately 25,000 ha of new urban areas were developed, of which 16,000 ha was in the North Island and 9000 ha in the South Island (). Of this new urban area, 7000 ha (29%) has been developed on high-class land. This is approximately 0.5% of New Zealand's total area of high-class land (i.e. 7000 ha of 1,465,000 ha).
Table 1 Areas occupied by new urban areas between 1990 and 2008.
In Hawke's Bay and Marlborough a high proportion of urbanisation has occurred on high-class land (49% and 59%, respectively), but this still amounts to relatively small proportions of the available high-class land in each region (). At 11%, Nelson's urbanisation has occupied high-class land at the fastest rate of any region, with Auckland's rate next at 4%.
Table 2 Areas occupied by new urban areas between 1990 and 2008, by region.
In early 2011, the valuation database indicated 175,000 lifestyle blocks in New Zealand covering an area of 873,000 ha. Seventy-five thousand of these had been established since 1998, giving an average of 5800 new lifestyle blocks per year. Our analysis shows 148,000 ha (17%) of lifestyle blocks are located on high-class land (). The proportion is slightly higher in the South Island (18%) than the North Island (16%). The 148,000 ha of lifestyle blocks on high-class land is approximately 10% of New Zealand's total area of high-class land, with a slightly higher proportion in the North Island (11%) than in the South Island (9%).
Table 3 Areas occupied by lifestyle blocks.
There are some regional differences (). For example, in Auckland 21% of lifestyle blocks are on high-class land, but this amounts to 35% of all high-class land in the region, while in Northland only 7% of lifestyle blocks are on high-class land, but this amounts to 28% of all such land in the region. In Southland, 39% of lifestyle blocks occupy high-class land, but this represents only 4% of high-class land in the region.
Table 4 Areas occupied by lifestyle blocks, by region.
Discussion
The results of our analysis show 10% of high-class land is presently occupied by lifestyle blocks, and the area of lifestyle blocks has been increasing rapidly in recent years. This significant proportion raises the question of whether high-class land should be protected and whether occupation by lifestyle blocks is equivalent to loss of productive land. The RMA establishes the promotion of sustainable management of resources as its overarching goal, where sustainability recognises potential impact on the ability of future generations to meet their needs. Given that we do not know the needs of future generations, it can be argued that we should leave options open to them, and it would then follow that non-renewable resources should be protected.
Importing food
The pricing of food is complex. However, ceteris paribus, when existing productive, high-class land is taken out of commercial production, food prices are likely to rise as supply reduces or supply is maintained by producing on land of lower quality. As prices rise, previously expensive imports become competitive. With globalisation, it could be argued that we must protect non-renewable resources at a global level, but not necessarily at a local level. We could import more food in future if we lose the capacity to produce it ourselves.
New Zealand is a net exporter of food: in 2009 it exported almost four times as much food by weight as it imported and almost seven times by value (Statistics New Zealand Citation2010). Furthermore, New Zealand has the highest value of food exports as a proportion of GDP of the 80 largest economies in the world (National Bank Citation2011). However, New Zealand depends significantly on imports for many foods considered staples, including wheat, sugar, vegetable oils, bananas and rice. About 30% by weight of New Zealanders’ food is imported, and about 50% by calories (FAO Citation2010). Much of the food imported does not grow well in New Zealand and/or is much more efficiently, and cheaply, produced in other countries, with negligible deleterious effect on quality from international transportation.
The importation of food confers a number of benefits, including making available a wider variety of foods, extending supply seasons, supplementing local production, reducing costs, smoothing out local supply disruptions (e.g. those caused by bad weather), and potentially providing important revenue for developing countries. Disadvantages of importing food include loss of control over methods of production (labour conditions, environmental regulation, animal ethics, use of agrichemicals, energy use, land clearance, food quality and genetic modification), greater exposure to fluctuations in international prices, biosecurity risks, environmental effects of international transportation and effects on the balance of payments. Fluctuations in international prices can be extreme: during the world food crisis of 2008, with food prices surging to record highs (FAO Citation2011), a number of major developing economies placed restrictions on exports of food commodities (Jones & Kwiecinski Citation2010). For New Zealand, environmental effects of international transportation are only significant for air-freighted goods, and the carbon emissions associated with the international transportation of New Zealand's imported food are equivalent to only about 0.4% of the average New Zealander's carbon footprint (Andrew et al. Citation2010).
Some foods require very short transportation times to retain freshness and quality. For example, the quality of leafy greens (e.g. lettuce, spinach) is strongly dependent on the time since harvest. A high proportion of the leafy greens supplied to Auckland are produced in Waikato, a short distance away (Horticulture New Zealand, Chris Keenan, pers. comm. June 2011). Importation is not considered to be a viable alternative for highly perishable foods.
Even if New Zealand did not import food, food prices would still be exposed to the fluctuations of international markets by two mechanisms: (1) New Zealand's domestic food production is highly dependent on imported fertilisers, oil, machinery and other goods, and price fluctuations in these commodities flow through to food prices; and (2) for any foods that New Zealand exports more than it consumes domestically (e.g. dairy, meat) the domestic price is likely to be strongly influenced by the price achieved on the export market. Nevertheless, an increase in food imports increases exposure to international market fluctuations.
Producing on lower class land
One potential consequence of the loss of high-class land is an increase in production from lower class land, although this can also result from the expansion of production (e.g. dairy expansion). Lower class land by definition is less efficient for food production, where efficiency measures production and/or revenue compared to inputs and detrimental environmental consequences (and negative externalities in general). Lower class land may have either excessively rapid or very poor drainage. Rapidly draining soils require higher rates of irrigation, increased fertiliser demand, or lower expectations of yield. Where land has very poor drainage, soil may sit waterlogged for several days, resulting in reduced yields. Occasionally poor drainage can be remedied, but this is not guaranteed.
When the slope of land is higher than about 12°, surface runoff can lead not only to wasted irrigation water, but also to significant soil erosion, and lost soil is lost productivity. While surface runoff and consequent erosion on gently sloping land can be reduced using appropriate management techniques (Johnstone et al. Citation2011), land with slopes over about 12° is substantially more difficult to manage. As well as runoff and erosion, land with higher slopes becomes more difficult for the operation of machinery such as tractors, harvesters, topdressers, etc. (Webb & Wilson Citation1995).
Subdivision and loss of high-class land
As noted by Maassen (Citation2009), the act of subdivision of land does not affect the soil's productive capacity. However, it would be facile to disconnect the legal division of property parcels from the usual consequences of subdivision, namely the construction of roads and buildings. In addition to the physical removal, covering up, mixing, erosion and compaction of soils resulting from construction (where buildings and roads are located, but also in places where heavy machinery have been), productive potential can be effectively lost when the new landowner does not intend to rely on production from the land as the main source of income.
Clearly, economies of scale are an important factor in whether land can be efficiently productive, and the more of a property that is built over the less likely it is that production can be efficient. Urban properties are at one end of this continuum, and therefore often have poor food production efficiencies. However, while the average urban property has low efficiency this does not mean that higher efficiencies are not possible, but it does reflect choices and conditions of householders that are unlikely to change significantly in the near term. Lifestyle blocks are further along the continuum and it is not a simple matter whether they are efficient or not. Two important issues are relevant: the concept of effective irreversibility, and the evidence for productivity of lifestyle blocks.
Effective irreversibility
Subdivision of land is legally reversible: smaller parcels of land can be re-aggregated into larger parcels. However, once a subdivided, small parcel of land is valued by the market as a lifestyle block, and a residence is constructed on it, it is unlikely to revert to ‘normal’ rural land use. The key reason for this is the increased value of the property per hectare. When a large house is present, this sunk cost is included in the market value but may not be of value to a commercial producer.
Land is valued in the market based partly on the benefits it provides the owners, comprising productive value, residential value and speculative value (Property Economics Citation2009). Productive farm land is primarily valued based on the profit the market believes can be extracted from production on that land. In urban areas, residential land is valued based on the range of benefits that homeowners expect to derive, including but not limited to security, happiness, status and potential rental income.
The value of lifestyle blocks mixes these two sources of benefits: that of the homeowner and of the productive farmer. According to the definition of lifestyle properties used in property valuations, lifestyle properties have land value higher than similar farm land (LINZ Citation2010). In general, owners of lifestyle blocks place this higher value on the land because they are there for more than purely economic reasons, so the land value in many cases is based on more than the productive potential of the land. Further value is added to the property through infrastructure such as septic tanks, electricity connections and water supplies. In addition, the value of the house constructed on a lifestyle block is often substantial.
In Rodney District in 2008, average lifestyle blocks were selling for $100,000/ha, compared with ‘land intensive’ farms selling for $10,000–$30,000/ha. However, there is also evidence of some ‘highly productive agricultural uses’ achieving prices similar to lifestyle blocks (Property Economics Citation2009, p. 3). According to Stillman (Citation2005), between 1990 and 2002 lifestyle blocks in the national valuation database had average values just under those of horticulture, piggeries and chicken farms, the most capital-intensive rural productive operations.
The higher market value of lifestyle blocks and the non-productive components of this value (e.g. the residence) effectively take it out of the financial reach of those valuing only financial return because the cost of the property cannot be recouped through production. As a consequence, land, once subdivided, is generally highly unlikely to return to economic food production. Exceptions to this rule of thumb include where the profitability of food production increases significantly (e.g. through technology development or food markets driving prices), where economic conditions force lifestyle block owners to return to urban areas (with consequent drop in market value of lifestyle blocks), and through government intervention in the market, as happened in the 1940s and 1950s (McAloon Citation2009).
An additional mechanism by which rural subdivision is effectively irreversible is what might be called the peri-urban slippery slope of subdivision. In peri-urban areas, the subdivision of rural land into rural-residential properties often leads to, and facilitates, further subdivision into smaller, urban properties. As noted by Nelson (Citation1992, p. 475), ‘the market for farmland is internalizing expectations of conversion’. Decisions to allow rural subdivision should therefore consider the increased likelihood of urban and rural sprawl that may result in future.
Productivity of lifestyle blocks
An early national survey published in the 1970s found just under half the smallholdings obtained income from their property (Jowett 1976, cited by Fairweather Citation1996). Several later surveys have shown that few of the owners of lifestyle blocks obtain the majority of their income from their property (Fairweather & Robertson Citation2000; Isnard Citation2009). Fairweather and Robertson (Citation2000, p. 42) conclude with the ‘general observation that smallholders overall do not engage in high levels of production’. This appears to be similar in the UK, although available evidence is limited (Holloway Citation2000).
According to De Luca (Citation2009), three surveys conducted in Western Bay of Plenty between 1996 and 2005 showed a consistent relationship between new lot sizes and primary production loss—up to 66% of properties less than 4 ha and up to 82% of those less than 1.5 ha were not being used for any productive purpose at all. On the other hand, on 29% of lots there was an increase in production following subdivision, generally because of a change from pastoral use to more intensive land uses. These more productive lots tended to be between 3 and 8 ha in size.
The results from the Western Bay of Plenty surveys, and evidence from other surveys, indicate an important distinction between two groups—smallholders and lifestylers. A clear delineation between these two groups would be impossible, because the attributes that distinguish them are not discrete. Conceptually we can consider a subset of more productive landowners and another of less productive landowners. It is unfortunate that no national dataset exists that would permit a richer spatial analysis of these two groups.
Fairweather and Robertson (Citation2000) reported that 46% of respondents in peri-urban Christchurch identified themselves as ‘lifestylers’. Isnard (Citation2009) obtained a similar figure from a survey in Kāpiti Coast District, with 45% of respondents identifying themselves as ‘lifestyler’. Other common terms used include ‘smallholder’, ‘hobbyfarmer’, ‘rural resident’, ‘small farmer’, ‘farmer’ and ‘horticulturalist’. While these terms could identify motivations of landowners, they do not necessarily indicate productivity—some ‘lifestylers’ might have very high food production from their properties, while some ‘farmers’ might have none.
Two further factors affect rural productivity. One is the ‘impermanence syndrome’, whereby rural landowners reduce investment in their properties in the expectation of eventual sale for residential purposes (Daniels Citation1986). Another is ‘reverse sensitivity’, whereby the sensitivities of new rural residents can impinge on the production activities of neighbouring properties (Pardy & Kerr Citation1999). These include sensitivities to the use of sprayed chemicals and odours from farming operations. This can affect productivity of agricultural and horticultural operations, and there have been cases where permission has been granted for further subdivision as a result of this lost productivity. That is, a farm's productivity may decline because of reverse sensitivity, contributing to a later decision to subdivide that farm, so leading to further subdivision.
Conclusions
Lifestyle blocks occupy 873,000 ha, or about 5% of New Zealand's non-reserved land. One-sixth (17%) of these are located on high-class land, which is approximately 10% of all high-class land (with similar proportions in each main island). In comparison, while 29% of new urban development since 1990 has occurred on high-class land, this represents only 0.5% of all high-class land. There are two important conclusions from these figures. First, loss of high-class land to lifestyle-block development has far outstripped loss to urbanisation in recent years. Second, fully one-tenth of New Zealand's most productive agricultural land has already been converted to lifestyle sections, and this has increased rapidly in the last 10 years. In some regions the rate of subdivision of high-class land is very high, with 35% of the best agricultural land in the Auckland region already occupied by lifestyle blocks.
As New Zealand continues to look to agriculture to generate economic value for the country, a significant proportion of its best agricultural land—a valuable, limited and non-renewable resource—is being used, in many cases, for consumptive purposes. With a growing population alongside a burgeoning desire for space and other benefits of rural living, there is no reason to expect the trend for rural subdivisions to subside. Therefore, we suggest two responses are urgently required: (1) national monitoring of rural land fragmentation; and (2) a national policy statement prioritising New Zealand's best agricultural lands for productive uses. This is one case where short-term market conditions favour outcomes that are unlikely to be in the nation's long-term interest, and action is well overdue.
Acknowledgements
This research was funded by the Ministry of Science and Innovation under the Ecosystem Services for Multiple Outcomes program (contract C09X0912). We thank an anonymous reviewer for valuable comments.
Notes
1Our review has been limited to English-language literature.
References
- Andrew R , Fitt H , Harper C 2010 . Assessment of rural productive potential in the Greater Ōtaki area: scenarios and options for a sustainable food future . Final report. Contract Report LC92 prepared for Kāpiti Coast District Council . Palmerston North New Zealand Landcare Research . 118 .
- Ballingall , J and Lattimore , R . 2004 . Farming in New Zealand: the state of play and key issues for the backbone of the New Zealand economy . Farm Policy Journal , 1 : 48 – 58 .
- Baumgart , IL and Howitt , PA . 1979 . Trends in law related to conservation and preservation of natural resources . New Zealand Journal of Ecology , 2 : 67 – 70 .
- Bloomer D 2011 . Versatile soils—productive land . Report prepared for Hawke's Bay Regional Council , Page Bloomer Associates Ltd 32 .
- Bunce , M . 1998 . Thirty years of farmland preservation in North America: discourses and ideologies of a movement . Journal of Rural Studies , 14 : 233 – 247 . doi: 10.1016/S0743-0167(97)00035-1
- Butt A 2011 . Functional change and farming in the peri-metropolis: what does it really mean for agriculture and food systems? Fifth State of Australian Cities Conference , Melbourne , 29 November–2 December 2011 .
- Daniels , TL . 1986 . Hobby farming in America: rural development or threat to commercial agriculture? . Journal of Rural Studies , 2 : 31 – 40 . doi: 10.1016/0743-0167(86)90071-9
- Davis , JS , Nelson , AC and Dueker , KJ . 1994 . The new 'burbs: the exurbs and their implications for planning policy . Journal of the American Planning Association , 60 : 45 – 59 . doi: 10.1080/01944369408975551
- De Luca R 2009 . District plan review planner's report: section 16—rural—general strategy . Report prepared for Western Bay of Plenty District Council , Russell De Luca Consultancy 20
- Evening Post 1916 , 21 June 1916 . Ōtaki .
- Fairweather J 1985 . Land policy and land settlement in New Zealand: an analysis of land policy goals and an evaluation of their effect . Lincoln University , New Zealand , Agribusiness and Economics Research Unit (AERU) . 40 .
- Fairweather , JR . 1996 . We don't want to see our neighbours’ washing . New Zealand Geographer , 52 : 76 – 83 . doi: 10.1111/j.1745-7939.1996.tb02069.x
- Fairweather JR , Robertson NJ 2000 . Smallholders in Canterbury: characteristics, motivations, land use and intentions to move . Research Report No. 245 . Lincoln University , New Zealand , Agribusiness and Economics Research Unit . 55 .
- FAO (United Nations Food and Agriculture Organization) 2010 . Food balance sheet 2007: New Zealand . Rome , , Italy , FAO . http://faostat.fao.org (accessed 2 July 2010).
- FAO (United Nations Food and Agriculture Organization) 2011 . Global information and early warning system (GIEWS): global food price monitor . Rome , , Italy , FAO . http://www.fao.org/giews/english/index.htm (accessed 4 August 2011).
- Gouin D-M 2006 . Agricultural sector adjustment following removal of government subsidies in New Zealand . Research Report No. 284 . Lincoln University , New Zealand , Agribusiness and Economics Research Unit . 82 .
- HM Revenue & Customs 2012 . Agricultural relief . http://www.hmrc.gov.uk/inheritancetax/pass-money-property/agricultural-relief.htm (accessed 7 August 2012) .
- Holloway , L . 2000 . ‘Hell on earth and paradise all at the same time’: the production of smallholding space in the British countryside . Area , 32 : 307 – 315 . doi: 10.1111/j.1475-4762.2000.tb00143.x
- Horticulture New Zealand 2009 . Oral evidence submitted during hearings on the proposed one plan—management of production soils . Wellington Horticulture New Zealand
- Houston , P . 2005 . Re-valuing the fringe: some findings on the value of agricultural production in Australia's peri-urban regions . Geographical Research , 32 : 209 – 223 . doi: 10.1111/j.1745-5871.2005.00314.x
- Isnard L 2009 . Rural residential living in the Kapiti Coast District . Paraparaumu , , New Zealand , Kāpiti Coast District Council . 59
- Johnstone P , Wallace D , Arnold N , Bloomer D 2011 . Holding it together—soils for sustainable vegetable production . Report prepared for Horticulture New Zealand . Auckland , Plant & Food Research and LandWISE .
- Jones D , Kwiecinski A 2010 . Policy responses in emerging economies to international agricultural commodity price surges . OECD Food, Agriculture and Fisheries Working Paper No. 34 . Paris , OECD Publishing . 89 p.
- LINZ (Land Information New Zealand) 2010 . Rating valuations rules 2008 . Office of the Valuer-General. LINZS30300 . Wellington , Land Information New Zealand .
- Lynn I , Manderson A , Page M , Harmsworth G , Eyles G , Douglas G , Mackay A , Newsome P 2009 . Land use capability survey handbook—a New Zealand handbook for the classification of land , 3rd edition . Hamilton , AgResearch; Lincoln, Landcare Research; Lower Hutt, GNS Science . 163
- Maassen JW 2009 . Report pursuant to s.42a resource management act concerning the inclusion of provisions in part I pop regarding versatile soils . Report prepared for Horizons Regional Council . Palmerston North , , New Zealand , Cooper Rapley Lawyers . 16
- Mackay , AD . 2008 . Impacts of intensification of pastoral agriculture on soils: current and emerging challenges and implications for future land uses . New Zealand Veterinary Journal , 56 : 281 – 288 . doi: 10.1080/00480169.2008.36848
- Mackay , A , Stokes , S , Penrose , M , Clothier , BE , Goldson , S and Rowarth , J . 2011 . Land: competition for future use . New Zealand Science Review , 68 : 67 – 71 .
- McAloon J 2009 . Land ownership: land ownership from the 1950s . In : Te ara: the encyclopedia of New Zealand . Wellington , Ministry for Culture and Heritage . http://www.teara.govt.nz/en/land-ownership/7 (accessed 9 May 2011).
- MAF (Ministry of Agriculture and Forestry) 2011 . International trade: agricultural and forestry exports from New Zealand . Wellington , , New Zealand , MAF .
- MfE (Ministry for the Environment) 2009 . The New Zealand land cover database . http://www.mfe.govt.nz/issues/land/land-cover-dbase/ (accessed 27 March 2012).
- MfE (Ministry for the Environment) 2012 . Land use and carbon analysis system . Wellington , , New Zealand , MfE .
- National Bank 2011 . Big themes of 2011 . New Zealand Economics: National Bank Rural Focus, 30 January .
- Nelson , AC . 1992 . Preserving prime farmland in the face of urbanization: lessons from Oregon . Journal of the American Planning Association , 58 : 467 – 488 . doi: 10.1080/01944369208975830
- Palmer A 2008 . The issue of protection of class I and class II soils in the One Plan . Expert evidence submission to the general hearing of the One Plan. http://www.horizons.govt.nz/assets/new-uploads/about-us/one-plan/submitters-expert-evidence-2/general-hearing/One-Plan-Versatile-SoilsStandard.pdf (accessed 2 December 2010).
- Pardy , B and Kerr , J . 1999 . Reverse sensitivity—the common law giveth, and the RMA taketh away . New Zealand Journal of Environmental Law , 3 : 93 – 107 .
- Pool I 2011 . Population change—Pākehā geographic distribution and labour force . In : Te ara: the encyclopedia of New Zealand . Wellington , Ministry for Culture and Heritage . http://www.TeAra.govt.nz/en/population-change/5 (accessed 25 August 2011) .
- Property Economics 2009 . Rodney district rural economy & lifestyle block trend study . Report for Rodney District Council. Auckland, New Zealand, Property Economics. 38 p.
- Rutledge , DT , Price , R , Ross , C , Hewitt , A , Webb , T and Briggs , C . 2010 . Thought for food: impacts of urbanisation trends on soil resource availability in New Zealand . Proceedings of the New Zealand Grassland Association , 72 : 241 – 246 .
- Sanson R , Cook A , Fairweather J 2004 . A study of smallholdings and their owners . Wellington , , New Zealand , MAF Policy .
- Shepherd J , Newsome P 2009 . Establishing New Zealand's Kyoto land use and land use-change and forestry 2008 map . Contract Report LC0809/133 prepared for the Ministry for the Environment . Lincoln , , New Zealand , Landcare Research .
- Statistics New Zealand 2010 . Overseas trade (import & export) statistics . Wellington , Statistics New Zealand .
- Stillman S 2005 . Examining changes in the value of rural land in New Zealand between 1989 and 2003 . Working Paper 05–07 . Wellington , , New Zealand , Motu Economic and Public Policy Research .
- Treadwell 1996 . Canterbury Regional Council v. Selwyn District Council. Environment Court. W142/96 .
- Webb T , Jessen M , McLeod M , Wilde R 1995 . Identification of high class land . Broadsheet November 1995 : 109 – 114 .
- Webb TH , Wilson AD 1995 . A manual of land characteristics for evaluation of rural land . Science Series No.10 , Lincoln , , New Zealand , Landcare Research .
- Wilson , GA . 2001 . From productivism to post-productivism … and back again? Exploring the (un)changed natural and mental landscapes of European agriculture . Transactions of the Institute of British Geographers , 26 : 77 – 102 . doi: 10.1111/1475-5661.00007
- World Bank 2012 . World development indicators: July 2012 update . Washington , DC , World Bank .