
Abstract
Introduced pest mammals impact widely on New Zealand invertebrates, but community-level responses to mammal removal are largely unmeasured. Beetles were pitfall-trapped for 7–10 years to examine how their communities responded to near eradication of all mammals except mice (Mus musculus) within a fenced sanctuary (Zealandia), and to sustained mammal control at an unfenced sanctuary (Otari-Wilton's Bush). In Zealandia, beetle abundance unexpectedly declined for 6 years after mammal eradication before stabilising. Beetle community composition changed, perhaps due to increased predation by birds and mice, but species richness, size distribution and trophic composition did not. At Otari-Wilton's Bush, beetle abundance also declined, in the presence of few but diverse mammals. Identifying causes of invertebrate community changes will be improved with study replication, more ‘before’ data, and targeted measurement of possible explanatory factors. Five recommendations are made for future insect community monitoring, including reconstructing fossil invertebrate communities to sharpen restoration objectives.
Introduction
The faunas of isolated islands that evolved in the absence of mammals are often unusual (James Citation1995; Blackburn & Gaston Citation2005; Gibbs Citation2009), with high levels of endemism, expanded niches, gigantism, extended life histories, flightlessness and ground-dwelling habits. Such attributes make taxa vulnerable to human disturbance (Daugherty et al. Citation1993; Gibbs Citation2010) and to predation by the introduced mammals and especially rodents that accompany human settlement. In New Zealand, most evidence of the effects of mammals on invertebrates has come from invertebrate responses to rodent eradications on islands (Green Citation2002; Rufaut & Gibbs Citation2003; Sinclair et al. Citation2005) and to rat control on the mainland (Spurr Citation1996; Hunt et al. Citation1998; King Citation2007). Eradications of mammals (particularly rodents) have resulted in altered invertebrate abundance (Green Citation2002; Watts et al. Citation2011), species richness (Sinclair et al. Citation2005), diversity (Hutcheson Citation1999) and behaviour with increased adult activity (Rufaut & Gibbs Citation2003; Watts et al. Citation2011). However, some invertebrate groups have shown no response to rodent control (Craddock Citation1997; van Aarde et al. Citation2004; Sinclair et al. Citation2005; Rate Citation2009).
Small introduced mammals, particularly rats (Rattus spp.), mice (Mus musculus) and hedgehogs (Erinaceus europaeus), are important predators of invertebrates in New Zealand forests (King Citation2005). For example, Innes et al. (Citation2010) suggested that ship rats (Rattus rattus) probably consumed a mean of 39 g ha−1 night−1 of invertebrates in North Island podocarp-broadleaved forests, and hedgehogs probably consumed 660 g ha−1 night−1. Pest mammals could limit abundances of their primary prey items in mainland forests, perhaps due to the naivety of prey to introduced mammals. In addition, they may prey selectively on large invertebrates that are more rewarding food items (Pyke et al. Citation1977; Bremner et al. Citation1984; Craddock Citation1997). Recently, Watts et al. (Citation2011) reported very large increases in weta captures, weta footprint tracking rates, and the incidence of weta footprints per tracking card within 2 years of all mammals being eradicated from Maungatautari, showing that some large mainland invertebrates do respond numerically or behaviourally to mammal removal. Invertebrate taxa driven to local extinction by rodents tended to be larger-bodied than those that were merely suppressed, and rodent-suppressed taxa were more than twice the average body length of unaffected taxa (St Clair Citation2011). The effects of predation on insect communities in New Zealand forests remain unknown and it is unclear whether the different levels of mammal control typically used on the New Zealand mainland are sufficient to allow recovery.
The advent of predator-proof fences (Aviss & Roberts Citation1994; Fuller & Gorman Citation1997; Day & MacGibbon Citation2007), accompanied by advanced techniques for eradication and subsequent surveillance (Speedy et al. Citation2007), has enabled multi-species eradication of mammals over areas up to 3400 ha (Maungatautari Ecological Island) on the New Zealand mainland, with very low levels of pest reinvasion. However, mice have proved difficult to eradicate, and temporary reinvasion of several other species is probably inevitable over time if fence integrity deteriorates (Innes & Saunders Citation2011). Between 1999 and 2009, a total of 8396 ha were enclosed by 113 km of fence in 28 fenced conservation areas ranging from 1 to 3400 ha (Burns et al. Citation2012). The first fenced sanctuary created in New Zealand was Zealandia (Karori Wildlife Sanctuary) in Wellington in 1999. This was established by a community-led organisation with the 500-year vision ‘to restore a corner of mainland New Zealand as closely as possible to the way it was the day before humans arrived’ (Zealandia Trust website www.visitzealandia.com). Biodiversity sanctuaries are experimentally restoring ecosystems to indigenous dominance (indigenous taxa dominate composition, biomass and key ecological processes; Lee et al. Citation2005) and full native species complement, typically by control or eradication of introduced mammals and the reintroduction of locally extinct native species (Innes et al. Citation2012). In September 2012, there were 63 biodiversity sanctuaries covering 55,480 ha throughout New Zealand (unpublished data, www.sanctuariesnz.org). These restorations may result in substantial changes in ecosystem structure, and provide opportunities to observe how ecosystems respond to mammal removal or control and to subsequent reintroductions of native species.
Despite the high conservation value and important functional roles of invertebrates, they are frequently overlooked in conservation management and research, where the priority is for charismatic vertebrate species (Clark & May Citation2002; New Citation2012). In New Zealand, some sanctuaries have collected insects after pest mammal control or removal but these samples are frequently unanalysed. This paper investigates how ground-dwelling beetle communities responded to two typical pest mammal control regimes (Gillies et al. Citation2003; Burns et al. Citation2012): 1) eradication or ‘near eradication’ of mammals within a fenced sanctuary; and 2) sustained trapping and poisoning of introduced mammals within an unfenced sanctuary. However, common to many conservation projects in New Zealand, our study was limited by factors beyond our control. First, we had the opportunity to take only two pre-treatment samples from Zealandia before mammal eradication. Second, a ‘non-treatment’ area for use in a Before–After-Control-Impact (BACI)-designed experiment was not possible as all forest reserves greater than 30 ha within the Wellington region already had some level of multi-species pest mammal control (Miskelly et al. Citation2005). Therefore, we chose a nearby forest reserve, Otari-Wilton's Bush, as a comparison site as it has similar vegetation types to Zealandia and has a mammal control regime different to Zealandia but typical of many other sites on the New Zealand mainland. This research primarily describes outcomes after pest management, although our ability to allocate their causes is limited.
At Zealandia, 13 species of mammals were eliminated over 7 months leaving only mice; insignificant reinvasion by other mammals has been controlled quickly. In contrast, since 1993, Otari-Wilton's Bush has had sustained control of introduced mammals typical of a New Zealand forest with constant reinvasion, which has resulted in a diverse but low-density mammal guild. We expected that eradication at Zealandia would result in an increase in beetle abundance and species richness relative to sites where mammals were present. We further hypothesized that large-bodied beetle taxa within the two sanctuaries would show a greater response than smaller-bodied taxa. In addition, Towns et al. (Citation2009) reported that trophic groups varied in their responses to the invasion of rats on islands and so we expected some change in the trophic composition of the beetle community following mammal eradication and control. Beetles (Insecta: Coleoptera) were selected for study because they: 1) represent a large component of the invertebrate biodiversity; 2) are an important component in the diet of introduced mammals; 3) have a range of body sizes; 4) can be sampled efficiently; 5) have relatively well-known taxonomy; 6) have representatives in multiple trophic groups; and 7) have diverse habitat preferences (Klimaszewski & Watt Citation1997; Sinclair et al. Citation2005).
Methods
Study sites
Zealandia (225 ha) is located 2.3 km from Wellington city at the southern end of New Zealand's North Island. It is situated in a steep-sided valley dominated by regenerating native coastal forest with common trees including mahoe (Melicytus ramiflorus), five finger (Pseudopanax arboreus), pate (Schefflera digitata), kohekohe (Dysoxylum spectabile), treefern (Cyathea spp.) and kawakawa (Macropiper excelsum) (Blick et al. Citation2008). Exotic radiata pine (Pinus radiata) occupies large areas of Zealandia; many trees emerge well beyond the canopy of the regenerating native forest (Moles & Drake Citation1999).
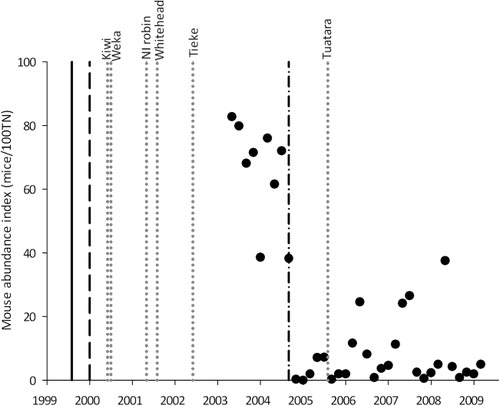
In August 1999, an 8.6 km predator-proof fence around Zealandia was completed. It was designed to exclude introduced mammals, in particular: ship rat, Norway rat (R. norvegicus), house mouse, feral cat (Felis catus), stoat (Mustela erminea), weasel (M. nivalis), hedgehog, rabbit (Oryctolagus cuniculus), hare (Lepus europaeus), brushtail possum (Trichosurus vulpecula), fallow deer (Dama dama), feral goat (Capra hircus), feral pig (Sus scrofa) and feral cattle (Bos taurus). Between July 1999 and January 2000, these mammals were eliminated from within the sanctuary. Since then, a few reinvasions of mammals (five weasels and two rats) have been successfully controlled (Karori Sanctuary Trust Citation2008). A few house mice (0.2 mice/100 corrected trap nights [CTN]) were detected during pre-eradication surveys and after the eradication of other mammals, their detection rates increased within Zealandia; they are thought to have breached imperfections in the fence (Raewyn Empson, Zealandia, pers. comm. 2011). In the absence of mammalian predators and competitors, mice have reached high densities (38.2–82.7 mice/100 CTN) in Zealandia. Since May 2003, mouse abundance has been monitored and in September 2004 annual control began (R. Empson, Zealandia, pers. comm. 2011). The Karori Sanctuary Trust is attempting, as far as possible, to reconstruct the original biotic community (that of the lower North Island before the arrival of humans) by reintroducing species that had become locally extinct. Since 2000, a number of native species have been released into Zealandia: 12 birds, including ground-feeding, insectivorous birds such as North Island robin (Petroica longipes), saddleback (Philesturnus carunculatus), little spotted kiwi (Apteryx oweni) and weka [Gallirallus australis]), plus tuatara (Sphenodon punctatus), Maud Island frog (Leiopelma pakeka), Cook Strait giant weta (Deinacrida rugosa) and 26 plants (R. Empson, Zealandia, pers. comm. 2012).
Otari-Wilson's Bush (96 ha) is situated 2.4 km from Zealandia, and has few but diverse mammals and similar vegetation. The reserve is dominated by original and regenerating conifer–broadleaf forest, including mahoe, kohekohe, treefern (Cyathea spp.), rimu (Dacrydium cupressinum), tawa (Beilschmiedia tawa) and rewarewa (Knightia excelsa). An area of emergent exotic radiata pine with an understorey of mahoe and five-finger is present. Since 1993, possums have been controlled in Otari-Wilson's Bush using brodifacoum in bait stations at 150 m intervals, which resulted in some rodent by-kill. The control of mustelids using DOC 200 traps began in 2007 with Norway rats, ship rats and hedgehogs recorded as by-kill (Rewi Elliot, Wellington City Council, pers. comm. 2011). Targeted control of goats and rabbits is done periodically. Starting in 2007, quarterly monitoring conducted at Otari-Wilton's Bush indicated that rat (mean percentage of ink footprint tunnels tracked = 9%), mice (12%) and mustelid (8%) densities appeared ‘low’. However, as procedures for monitoring mammal species at Otari-Wilton's Bush differed from standard protocols, these indices are problematic to interpret. No possum and hedgehog density indices are available. No bird translocations have occurred at Otari-Wilton's Bush.
Sampling design
We sampled the beetle assemblages from 10 permanent vegetation–invertebrate sampling plots located throughout Zealandia (Berndt & Berry Citation1998; Berndt Citation1999): three plots in exotic radiata pine forest with an understorey of mahoe, five-finger and kawakawa; two plots in kohekohe forest with scattered mahoe and kawakawa; three plots in low mahoe forest; one plot in mixed five-finger and mahoe forest; and one plot in low exotic dogwood (Cornus capitata) forest. The pre-eradication samples (November–December 1998 and March 1999; ) were collected by Zealandia volunteers. From March 2002, Landcare Research carried out the ground-dwelling beetle community sampling at Zealandia and the project was extended to include a ‘non-treatment’ site at Otari-Wilton's Bush (). Four vegetation types (exotic radiata pine forest with broadleaf understorey, kohekohe forest, treefern forest and low mahoe forest) similar to those sampled at Zealandia were chosen for study at Otari-Wilton's Bush. At both sites, vegetation sampling plots were 35 × 15 m, divided into 21 seedling plots measuring 5 × 5 m. From November–December 2004, sampling was extended to 4 months over the summer (November–December, December–January, January–February and March) and occurred every 2 years ().
Table 1 Number of trap days at each sampling period at two biodiversity sanctuaries in Wellington (Zealandia and Otari-Wilton's Bush).
Our data are inevitably constrained by limited replication, and pre-treatment sampling, and the absence of suitable non-treatment sites, as is typical of such studies (Sinclair et al. Citation2005). We have 8 years' worth of beetle community data from another mammal-free sanctuary in the Waikato (Maungatautari) which will replicate this study in time. Only two samples were taken (November–December 1998 and March 1999) from Zealandia before mammal eradication, and no pre-control beetle data were taken at Otari-Wilton's Bush. No comparable Wellington forest areas lacking pest mammal control were available as non-treatment sites in this study.
Beetle sampling, sorting and identification
Beetles were sampled using pitfall traps consisting of a 100 mm-deep plastic cup containing 100 mL of 50% monopropylene glycol. Pitfall traps have been used extensively to monitor the abundance and activity of epigeic invertebrates, especially beetles (Topping & Sunderland Citation1992). However, they have been criticised and a review by Southwood (Citation1978) cautioned their use due to pseudoreplication within sites and that their catch was dependent on other factors (i.e. activity and susceptibility of capture) in addition to abundance. We acknowledge these limitations but they are inexpensive, convenient, allow comparison among many sites and gather a range of beetles. At each sampling plot, a pitfall trap was located at the south-west corner of 10 randomly selected 5 × 5 m seedling plots. In total, 100 traps (10 traps × 10 plots) were placed in Zealandia and 40 traps (10 traps × 4 plots) in Otari-Wilton's Bush.
Beetles were preserved in 70% alcohol until identified and counted. They were first sorted on the basis of external morphology to morphospecies or recognised taxonomic units (hereafter referred to as species) and where possible given generic and species-level identifications by a taxonomic expert (Stephen Thorpe, honorary research associate, School of Biological Sciences, University of Auckland). Beetle species were assigned to three trophic groups according to Klimaszewski & Watt (Citation1997) (see Appendix): predators, herbivores (includes xylophages) and detritivores (includes fungivores, saprophages and scavengers), based on known feeding biology of the species, genus or family. Each species was measured and classified as very small (<5 mm), small (5–10 mm), medium (10–30 mm) or large (>30 mm), based on mean lengths of at least 10 individuals, where available. If fewer than 10 individuals were collected, the average of those was used.
Mouse monitoring and control within Zealandia
In May 2003, three monitoring trap-lines were established in different habitats in Zealandia to monitor mouse abundance, at least 80 m away from any of the beetle sampling plots. Each line had 40 traps, placed at 25 m intervals and baited with rolled oats and peanut butter. Traps were set for three consecutive nights bimonthly starting in January each year. For each sampling occasion, the mouse abundance index was expressed as the number of mice captured in traps per 100 trap nights corrected for sprung traps (CTN) (Nelson & Clark Citation1973). Annual control of mice using Pestoff™ (brodifacoum 20 ppm) commenced in September 2004. The bait was placed in bait stations on a 50 × 25 m grid across Zealandia for approximately 1 month (R. Empson, Zealandia, pers. comm. 2013).
Data analysis
For every beetle species caught, their abundance at a biodiversity sanctuary (s), in a year (t) and during a visit (v) was recorded. For species i, this count is denoted by cistv.
At the two biodiversity sanctuaries, sampling effort at each seasonal visit was standardised among many years. As a different number of traps were employed at Zealandia and Otari-Wilton's Bush (see ), this precludes directly comparing species counts between the two sanctuaries, as with reduced sampling effort it is likely that fewer rare species will be detected and fewer beetles will be caught. However, the data can be used to compare annual trends between the two sanctuaries.
We expected species detectability and probability of capture to vary between sanctuaries and visits during a year. However, for a particular sanctuary, sampling effort at any given visit is assumed to be constant between years. In addition to sampling effort, differences in beetle counts between visits are expected due to inherent seasonal variation.
Model for species richness and abundance
For biodiversity sanctuary s, in year t, at visit v, the number of unique beetle species caught (Nstv), the total number of beetles caught (Tstv) and the geometric mean abundance of beetles in each species (Astv) was calculated as follows:
Cubic smoothing splines provide a very flexible method of modelling curvilinear trends in longitudinal data while enabling treatment and systematic effects to be readily incorporated (Orchard et al. Citation2000). As the measures of species richness (N) and abundance (T, A) were expected to be sanctuary-dependent, to exhibit consistent seasonal (visit) effects and to vary smoothly with time (years), each variable was modelled using a cubic smoothing spline approach formulated as a linear mixed-effects model (Verbyla et al. Citation1999). This was fitted using restricted maximum likelihood (REML). provides a summary of the terms in the full linear mixed effects model, whether they were fitted as fixed or random effects, and the component (linear or non-linear) of the model they represent. Likelihood ratio tests were used to assess the importance of the random effects (Verbyla et al. Citation1999). The statistical significance of the fixed effects was examined using F-tests. To select the final model, statistically insignificant random and fixed effects at the 5% level were sequentially dropped. To normalise the data, N, T and A were natural log-transformed before analysis. The validity of the normal assumption was assessed through inspection of the residual plots. All analyses were conducted in GenStat 13 (Payne et al. Citation2010).
Table 2 A summary of the terms in the full model for beetle species richness (ln[N]), the total number of beetles caught (ln[T]) and the geometric mean abundance of beetles caught (ln[A]).
Model for species size distribution
To assess whether the size class distribution of species changed over time, the number of species caught at each sanctuary s, in year t, at visit v (Nstv) was partitioned into counts for each size class. Only the proportion of 1) very small and 2) very small and small species in Nstv was modelled as these were the majority of beetles caught. As with analysis of species richness and abundance, a smoothing spline approach was employed. The observed proportions were arcsine square root-transformed before analysis to stabilise the variance of the (binomial) data. The importance of the spline terms and visit random effects were assessed individually using likelihood ratio tests. If none of the random components was statistically significant at the 5% level, a logistic regression model was fitted and the statistical significance of the fixed terms (Year, Sanctuary and Sanctuary by Year) assessed using analysis of deviance.
Model for species trophic composition
To assess how the trophic composition of species changed over time at each site, Nstv was partitioned into counts for each trophic group. A log-linear model with main effects of Sanctuary, Year, Visit and Group was fitted to the resulting contingency table data. The statistical significance of the interaction terms, which indicate associations between variables, was assessed with analysis of deviance.
Multivariate analyses
Variation in beetle species composition and abundance caught per trap day (no. traps × no. days set) between Zealandia and Otari-Wilton's Bush over the various visits were analysed using classification (cluster analysis) and ordination techniques within the PATN multivariate analysis package (Belbin Citation1995). Rare species, defined as having only one specimen in the total dataset, were omitted. The procedures used within PATN were FUSE (agglomerative hierarchical fusion) and SSH (semi-strong hybrid multidimensional scaling). The SSH hybrid scaling ordination technique implements an improved version of hybrid scaling that combines metric and non-metric criteria (Faith et al. Citation1987). It is a robust technique for measuring ecological distance because it is flexible and fits output distances to input distances without squaring these distances (Minchin Citation1987; Belbin Citation1995). In all analyses we used the flexible unweighted pair-group method using arithmetic averages (UPGMA) clustering method (with β = −0.1) where equal weight is given to objects, not groups, and the Bray-Curtis association measure, which consistently performed well in data testing (Faith et al. Citation1987). A two-dimensional ordination with a relatively high stress value of 0.2076 was considered to summarise the data adequately (see Belbin Citation1995), as solutions of other dimensions (e.g. 3D, stress value = 0.1846) did not markedly improve ecological interpretability.
Results
A total of 14,413 beetles from 282 species were captured over the 10.5 years of sampling at Zealandia and Otari-Wilton's Bush. The most species-rich families in the samples were Curculionidae (80 species), Staphylinidae (28 species) and Carabidae (25 species). The commonest beetle sampled was Saphobius edwardsi (Scarabaeidae) accounting for 39% of the total catch (2.6 individuals per trap night). Only three exotic species (Sericoderus sp. 1 [Corylphidae], Hylastes ater [Curculionidae] and Hylurgus ligniperda [Curculionidae]) were collected, and these were represented by six, eight and one individuals, respectively.
Species richness and abundance
Cubic smoothing spline modelling of beetle species richness (N), the total abundance of beetles present (T) and the geometric mean abundance of beetles in each species (A) provided evidence of differing annual trends between Zealandia and Otari-Wilton's Bush. Summaries of the model selection process for these variables are given in (tests of random effects) and (tests of fixed effects). The estimated sanctuary-specific slopes of the underlying fixed linear regressions are given in .
Table 3 P values from the likelihood ratio tests of the random effects in the analysis of beetle species richness (ln[N]), the total number of beetles caught (ln[T]) and the geometric mean abundance of beetles caught (ln[A]).
Table 4 P values from the sequential F-tests of the fixed effects under the chosen random effects models for beetle species richness (ln[N]), the total number of beetles caught (ln[T]) and the geometric mean abundance of beetles caught (ln[A]).
Table 5 Estimated slope (standard error of the estimate) of the linear component for Zealandia and Otari-Wilton's Bush under the final model, and the standard error of difference (SED) between the two slopes.
The analysis of beetle species richness, ln(N), provided evidence of differing annual trends between Zealandia and Otari-Wilton's Bush, but no evidence of an underlying linear increase or decrease in species richness at either sanctuary. Including sanctuary-dependent splines (i.e. smooth deviations from the fixed linear component) in the analysis of ln(N) improved the model (P value = 0.024). The observed values, and the sanctuary-specific predicted smooth trend under the final model, are shown in . Although a decline in beetle species richness is evident for Otari-Wilton's Bush in , the fixed effects of Year and Sanctuary.Year, which represent the slope of the underlying linear regression, were not significant (P values > 0.05, ).
![Figure 1 Changes in: A, beetle species richness (ln[N]); B, total number of beetles caught (ln[T]); and C, geometric mean of abundance of beetles caught (ln[A]) at two biodiversity sanctuaries in Wellington. Black circles = beetles caught at Zealandia; grey circles = beetles caught at Otari-Wilton's Bush. Solid lines show the predicted smooth trends under the final model and the dashed lines show 95% confidence intervals for the predicted values. Zealandia was fenced in September 1999 and the vertical line indicates when it became mostly mammal free in January 2000.](/cms/asset/3cd79db2-47b4-4bb8-afe8-98ae138a7f00/tnzr_a_875478_f0001_b.jpg)
The analysis of the total abundance of beetles present, ln(T) indicated a general decline in total abundance over time which was greater at Otari-Wilton's Bush than at Zealandia. There was evidence of smooth deviations from the underlying linear regression (P < 0.001) but there was no evidence that these differed between the two sanctuaries (P = 0.229). The fixed effects of Year and Sanctuary.Year indicated that there was a significant, sanctuary-dependent, underlying linear trend in total abundance over time (P < 0.001). The estimated slopes of these linear trends were negative for both Zealandia and Otari-Wilton's Bush (), but the estimated decline in total abundance was significantly greater at Otari-Wilton's Bush (P < 0.05). The observed values, and the sanctuary-specific predicted smooth trend under the final model, are shown in .
The analysis of geometric mean abundance, ln(A), also provided evidence of a decline in abundance over time that was greater at Otari-Wilton's Bush than at Zealandia. There was no evidence of smooth deviations from the fixed model (P > 0.05), although there was evidence of sanctuary-dependent linear trends across time (P < 0.001). The estimated slope for Otari-Wilton's Bush was significantly different from Zealandia (). The observed values, and the sanctuary-specific predicted smooth trend under the final model, are shown in .
In all cases, including seasonal variation (visit) improved the model (P < 0.001), but there was no evidence that this variation differed between sites (P > 0.05).
Species size distribution
Of the 282 beetle species caught, 183 species were very small, 48 were small, 49 were medium sized, and three (Mimopeus opaculus (Tenebrionidae), Oemona hirta (Cerambycidae) and Plocamostethus planiusculus [Carabidae]) were large (Appendix).
There was no evidence of temporal or sanctuary differences in beetle size distribution. Summaries of the model selection process for the arcsine square root-transformed proportion of very small and very small/small combined species in the total catch are given in (tests of random effects) and (tests of fixed effects). The logistic regression model approach was adopted because the inclusion of spline or visit terms did not significantly improve the model (P > 0.05, ). The logistic regression analysis found no evidence that the proportion of very small (mean = 0.68, SEM = 0.11), or very small and small combined (mean = 0.79, SEM = 0.01), beetle species changed over time or differed between Zealandia and Otari-Wilton's Bush (P > 0.05, ).
Table 6 P values from the likelihood ratio tests of the random effects in the analysis of the arc sine-square root transformed proportion of very small (<5 mm) and very small or small (5–10 mm) species in the catch.
Table 7 P values from the analysis of deviance for the logistic regression models of the proportion of very small (<5 mm) or the proportion of very small and small (5–10 mm) species in the catch.
Trophic composition
Of the beetle species caught, 118 species were detritivores, 121 species were herbivores and 44 species were predators (Appendix). There was no evidence that trophic composition differed between years, between visits within years, or between sites (P > 0.05).
Beetle community composition
An ordination based on species composition and abundance showed that the beetle communities at Zealandia and Otari-Wilton's Bush were different and that within these there were variations between years (). Six groups with differing beetle species composition were identified by the FUSE clustering analysis, and these groupings were overlaid on to the SSH ordination to identify trends in beetle community composition within the study (). The beetle communities sampled from the two sites were separated along Axis 2 indicating differences (). Beetles collected from Zealandia between November–December 1998 and March 2007 (Group I) had a common composition and were distinct from samples collected between November–December 2008 and March 2009 (Group II; ). The beetle communities collected from Otari-Wilton's Bush formed four groups of similar assemblages collected in March and November–December 2002 (Group III), November–December 2004 to February 2007 (Group IV), March 2007 (Group V) and November–December 2008 to March 2009 (Group VI; ).
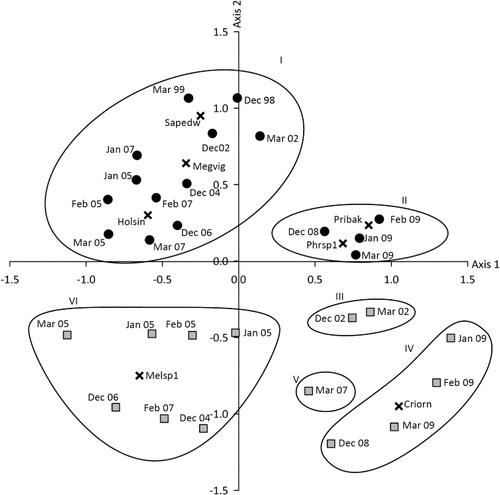
The abundances of only 14 of 146 species varied significantly between the two sanctuaries and were ordered along SSH axes (). Species that were common at Zealandia between November–December 1998 and March 2007 included Saphobius edwardsi (Scarabaeidae), Megadromus vigil (Carabidae) and Holcaspis sinuiventris (Carabidae). Pristoderus bakewellii (Zopheridae) and Phrynixus sp. 1 (Curculionidae) were predominantly associated with samples collected at Zealandia between November–December 2008 and March 2009. Melanophthalma sp. 1 (Latridiidae) was associated with Otari-Wilton's Bush plots in Group IV, while the weevil, Crisius ornatus, was predominantly associated with Otari-Wilton's Bush plots between November–December 2008 to March 2009.
Mouse monitoring within Zealandia
Until mouse control began in September 2004, the density of mice within Zealandia was high (38.2–82.7 mice/100 CTN). Since then, mouse density has remained relatively low (<11.6 mice/100 CTN) except for seasonal autumn outbreaks (24.1–37.5 mice/100 CTN) in most years ().
Discussion
Contrary to our expectations, beetles did not dramatically increase in abundance or species richness after intensive mammal control at the two biodiversity sanctuaries. In fact, there was a general decline in abundance over the 10.5 years of sampling, greater at Otari-Wilton's Bush with a few but diverse mammals, than at Zealandia where only mice remained. The lesser decline at Zealandia suggests that the removal of all mammals except mice possibly benefited the beetle communities. Moreover, during recent years, the total number of beetles caught at Zealandia appears to be constant.
There was no evidence of change in beetle species size distribution or trophic distribution over time at Zealandia, nor do these trends differ from those in Otari-Wilton's Bush. However, ordination analyses indicated that beetle community composition did differ between the two sites over the study. The magnitude of change in the beetle communities sampled prior to and during the summer of 2008–09 was similar at the two sites. At times, high densities of mice occurred within Zealandia after eradication of other mammals. This, together with high densities of ground feeding insectivorous birds (including translocated weka, saddleback, North Island robin and kiwi), could account for the lack of increase in the beetle density.
Some beetle species were ‘winners’ and others were ‘losers’ at Zealandia. These perhaps arose from different beetle feeding strategies and changes in predation pressures from all introduced mammals to only mice and birds. For example, the carabid, Holcaspis sinuiventris, was a ‘loser’ as it was common (mean = 0.20 individuals per trap night) in samples between November–December 1998 and March 2007, but none was collected since then. Conversely, the false darkling beetle, Pristoderus bakewellii, was a ‘winner’, with few specimens (0.009 individuals per trap night) collected between November–December 1998 and March 2007, but many in summer 2008–09 (mean = 0.77 individuals per trap night).
Lacking data from ‘non-treatment’ sites, and with few pre-eradication samples at Zealandia and none at Otari-Wilton's Bush, we cannot conclude that the different mammal control regimes are the cause of the observed sanctuary differences. However, these are the first insect community data published from a mammal-free mainland location and it is by far the longest study of its type from anywhere in New Zealand.
We suggest five possible reasons for insubstantial change in beetle diversity in ecosystems released from mammal predation.
Pest mammal species may not regulate extant indigenous beetle populations
For more than 700 years, kiore (Rattus exulans) was the only rodent in New Zealand and its impact on naive small ground birds, seabird nesting colonies, and frog and reptile populations is documented from the Holocene fossil record (Holdaway Citation1999; Wilson Citation2004). The evidence is much less clear for invertebrates but some taxa would have been more susceptible than others, and it was the larger, flightless, ground-dwelling nocturnal species that suffered most (Ramsay Citation1978; Campbell et al. Citation1984). With the introduction of a diverse mammal guild over the past 150 years, only invertebrate taxa with resistant characteristics (e.g. high fecundity, small body size) would have survived on the New Zealand mainland. Therefore, the beetle community sampled in the present study is presumably a non-random subset of the North Island's original (pre-mammal) beetle fauna that is resistant to mammal predation. The species that we would expect to be most affected by mammals, and which would contribute most to community-level changes following mammal eradication, may already be extinct at these two sanctuaries and even on mainland New Zealand generally. This was the case with the threatened Cook Strait giant weta which was translocated into Zealandia in 2007–08 after becoming extinct on the mainland more than 100 years ago (Watts et al. Citation2012). This is also consistent with finding only three large (>3 cm) beetle species in Zealandia during this study.
It is widely recognised that invertebrates are an important high-protein component in the diets of mammals, but it is possible that they may not limit invertebrate populations.
Mice may continue to affect the beetle communities
Mice, the only remaining mammal species within Zealandia, are now at low densities (<11.6 mice/100 CTN) except for outbreaks (24.1–37.5 mice/100 CTN) during the autumn and winter of most years. The frequent occurrence of invertebrates, especially caterpillars, spiders and beetles, in the diet of mice in various habitats indicates that these are important foods (see Ruscoe & Murphy Citation2005). Mice have been implicated in the decline of invertebrate populations in New Zealand (Bull Citation1967; Ramsay Citation1978; Brignall-Theyer Citation1998), with litter-dwelling caterpillars, beetles and ground weta (Hemiandrus spp.) at particular risk from predation (Ruscoe & Murphy Citation2005). Mice can consume large numbers of invertebrates on sand dunes, but Miller & Webb (Citation2001) did not suggest mice could regulate invertebrate populations. In addition, Van Aarde et al. (Citation2004) constructed mouse-free exclosures on Marion Island and found that mice had no significant effect on any of the eight invertebrate prey groups' (includes weevil adults) abundance or biomass, or on community structure (diversity and composition). However, B. M. Fitzgerald et al. (unpubl. data) observed an increase in the abundance of eight common invertebrate species (including five beetles) after mice were eradicated from Allports Island in 1989, while another beetle that was absent in 1986, was abundant in 1997–98. Thus mice may limit invertebrates directly by predation (Ramsay Citation1978) or indirectly by competition for food such as seeds, fruits and other invertebrates.
Increasing native insectivorous birds suppress beetle communities
Insectivorous birds have thrived in Zealandia since mammal eradication and could have replaced the previous mammalian predator pressure on beetle populations. On Kapiti Island, the significant decrease in invertebrate catch frequency and diversity 3 years after the eradication of Norway rats and kiore, was accompanied by a four-fold increase in counts of some insectivorous birds, including saddleback, North Island robin, weka and blackbirds (Turdus merula) (Sinclair et al. Citation2005). Bird counts at Zealandia during 2002–05 revealed that few resident birds other than tui showed any measurable change after mammal eradication and before translocated species were well established (Colin Miskelly, pers. comm. 2012). By 2008–09, bird density within Zealandia had increased with many translocated native bird species, including North Island robin, saddleback, kiwi and whitehead being common (R. Empson, Zealandia, pers. comm. 2012). For example, robin density increased from 0.7 robins per ha in 2003 to 2.5 robins per ha in 2008, higher than at other mainland sites (McGavin Citation2009), and robins are the most common translocated insectivorous bird in Zealandia. Robins forage for invertebrates, including beetles, in soil, among leaf litter, on rotten logs and in any low vegetation they can reach from the forest floor (Powlesland Citation1981; Higgins & Peter Citation2002) and are likely to have the greatest effect on ground-dwelling invertebrates.
There may have been insufficient time for changes to develop
It is possible that the 10 years since mammal suppression were insufficient for the recovery of longer-lived beetle species that were previously kept at low densities by mammalian predators. Responses of beetles, and invertebrates generally, to mammal eradication may not be rapid and immediate (Rufaut & Clearwater Citation1997). Invertebrate responses to mammal eradication are not uniform, and species appear to respond to reduced predation pressure at different rates from each other (Rufaut & Clearwater Citation1997). Furthermore, invertebrate behaviour may change following mammal control and could affect catch rates, either positively or negatively (Rufaut & Gibbs Citation2003).
Information on life history is generally lacking for New Zealand invertebrates. For example, the life cycle of stag beetles (four species of Lucanidae were caught at Zealandia) has been estimated to be at least several years (Hudson Citation1934). Van Aarde et al. (Citation2004) suggested that the effect of eradicating mammals on insects with similar long life histories might become apparent only after ≥10 years.
Complex interactions with habitat quality may limit beetle communities
The indirect effects of removing mammals (e.g. increased canopy density in the absence of possums and increased litter depth due to increased leaf fall) and other environmental factors may be important to beetles. On northern New Zealand offshore islands, invasion by ship rats and Norway rats significantly reduced burrowing procellariid seabird abundance by predation, which consequently increased litter depth and reduced soil fertility by disrupting the transport of nutrients from sea to land by seabirds. This resulted in reduced abundance of below-ground invertebrates and changes to the ecological processes they mediated (Fukami et al. Citation2006; Towns et al. Citation2009). Rats significantly reduced nitrogen concentrations of foliage and litter (Wardle et al. Citation2009) and indirectly enhanced total ecosystem carbon storage (Wardle et al. Citation2007). These studies show the subtle ecosystem changes that invading species can bring about and potential outcomes of mammal invasion. The outcomes from these studies informed restoration objectives on islands by showing that restoring below-ground and litter-dwelling invertebrates and associated nutrient cycling after rat eradication required successful seabird recolonisation, which may take substantial time (Towns et al. Citation2009). Future research in sanctuaries should include measuring important environmental variables, such as canopy density and litter depth, and processes such as pollination and decomposition, to better explore causes and outcomes of invertebrate community changes.
Repercussions for managers and researchers for restoration and monitoring of insect communities following mammal control
In the biodiversity monitoring framework suggested by Lee et al. (Citation2005), the ecological goal of mammal eradication or control of exotic species is to restore ecological integrity, which includes indigenous dominance (indigenous taxa dominate composition, biomass and key ecological processes) and species occupancy (species that should naturally occur there are present; Lee et al. Citation2005). This powerful framework is useful for managers when assessing how successful restoration has been in their biodiversity sanctuary. Surprisingly, only three exotic beetle species (1.1% of 262 total) were caught at Zealandia, despite its urban location and the presence of large areas of modified vegetation. In comparison, Kuschel (Citation1990) found that 228 (23.3%) of 982 beetle species were exotic in a survey of forest reserves and gardens in urban Auckland. Therefore, the indigenous dominance of the beetle fauna at Zealandia did not change during the study. In addition, the potential (original) invertebrate fauna remains unknown. Recently, Marra (Citation2007) began reconstructing Quaternary fossil beetle communities from five mainland New Zealand sites and found that although small beetles dominated the samples, she concluded that introduced predators played a role in extinctions. For example, the loss of South Island populations of the Pseudopanax weevil, Ectopsis ferrugalis, within the past 2000 years, is attributed to introduced mammals (Marra Citation2007). The large native beetle species, Mimopeus opaculus, is common on mammal-free Wellington islands, and was only found after mammal eradication in Zealandia and was present at Otari-Wilton's Bush.
Our study suggests that managers should not necessarily expect substantial change in insect communities after mammal control or eradication, although some species—especially larger ones—will benefit (Watts et al. Citation2011). Monitoring insect responses following mammal control is expensive and time-consuming. It is relatively easy to collect insect samples using many different techniques but identifying specimens is laborious and depends on expert knowledge. Interpreting changes in the invertebrate community after mammal eradication is difficult, as both the abiotic and biotic factors affecting the invertebrate fauna are complex and such interactions within ecosystems are poorly understood.
If researchers and stakeholders are to learn anything about invertebrate responses to mammal eradications on mainland New Zealand they need specific objectives in mind when designing monitoring programmes in biodiversity sanctuaries. We recommend that conservation managers and researchers attempting to quantify the benefits of mammal removal or control on the insect communities: 1) use consistent protocols for monitoring invertebrates and other fauna at both treatment and associated non-treatment sites; 2) plan in advance to allow for sufficient monitoring of insect communities before mammal eradication starts; 3) simultaneously measure environmental variables, such as bird and mouse abundance, vegetation and climate, that could contribute to changes in the invertebrate community; 4) monitor over a long time scale (10+ years) to account for lagged invertebrate responses and seasonal and climatic variation; and 5) reconstruct the fossil invertebrate community to sharpen restoration objectives.
Acknowledgements
This research was supported by CoRE funding for Crown Research Institutes from the Ministry of Business, Innovation and Employment's Science and Innovation Group, under CO9X0503. Sincere thanks to Raewyn Empson (Zealandia), Rewi Elliot (Wellington City Council) and Colin Miskelly (OSNZ) for their assistance. Thank you to Michelle Howard, Andrew Martin, Emma Bancroft, Laura Keenan, Debra Wotton and Zealandia staff who assisted with fieldwork. Raewyn Empson provided the unpublished mouse data presented in this paper which was greatly appreciated. Bev Clarkson provided technical support with the ordination analysis. Maureen Marra provided useful discussion regarding fossil beetles. We thank David Hunter for the graphics. We are indebted to Stephen Thorpe who identified the beetles. Ian Stringer, Deb Wilson, Bill Lee, Anne Austin, Neil Cox, Ian Jamieson, Kelly Hare and two anonymous reviewers provided invaluable comments on the draft manuscript.
References
- Aviss M, Roberts A 1994. Pest fences: notes and comments. Threatened Species Occasional Publication No. 5. Wellington, Department of Conservation. 42 p.
- Belbin L 1995. PATN: pattern analysis package. Technical reference. Canberra, CSIRO Division of Wildlife and Ecology.
- Berndt L 1999. Karori wildlife sanctuary – permanent invertebrate sampling and rodent collection. Unpublished report. Wellington, Karori Sanctuary. 24 p.
- Berndt L, Berry C 1998. Karori Wildlife Sanctuary vegetation survey report. Unpublished report. Wellington, Karori Sanctuary. 72 p.
- Blackburn TM, Gaston K 2005. Biological invasions and bird losses on islands. In: Sax DF, Stachowicz JJ, Gaines SD eds. Species invasions: insights into ecology, evolution and biogeography. Sunderland, MA, Sinauer Associates. Pp. 84–110.
- Blick R, Bartholomew R, Burrell T, Burns KC 2008. Successional dynamics after pest eradication in the Karori Wildlife Sanctuary. New Zealand Natural Sciences 33: 3–14.
- Bremner AG, Butcher CF, Patterson GB 1984. The density of indigenous invertebrates on three islands in Breaksea Sound, Fiordland, in relation to the distribution of introduced mammals. Journal of the Royal Society of New Zealand 14: 379–386. 10.1080/03036758.1984.10421738
- Brignall-Theyer ME 1998. Potential vertebrate predators of the Cromwell chafer beetle, Prodontria lewisi. Unpublished MSc thesis. Dunedin, New Zealand, University of Otago. 112 p.
- Bull RM 1967. A study of the large New Zealand weevil, Lyperobius huttoni Pascoe, 1876 (Coleoptera: Curculionidae, Molytinae). Unpublished MSc thesis. Wellington, New Zealand, Victoria University. 125 p.
- Burns B, Innes J, Day T 2012. The use and potential of pest-proof fencing for ecosystem restoration and fauna conservation in New Zealand. In: Hayward MW, Somers MJ eds. Fencing for conservation. New York, Springer. Pp. 65–90.
- Campbell DJ, Moller H, Ramsay GW, Watt JC 1984. Observations of foods of kiore (Rattus exulans) found in husking stations on northern offshore islands of New Zealand. New Zealand Journal of Ecology 7: 131–138.
- Clark JA, May RM 2002. Taxonomic bias in conservation research. Science 297: 191–192. 10.1126/science.297.5579.191b
- Craddock P 1997. The effect of rodent control on invertebrate communities in coastal forest near Auckland. Unpublished MSc thesis. Auckland, New Zealand, The University of Auckland. 132 p.
- Daugherty CH, Gibbs GW, Hitchmough RA 1993. Mega-island or micro-continent? New Zealand and its fauna. TREE 8: 437–442.
- Day T, MacGibbon R 2007. Multiple-species exclusion fencing and technology for mainland sites. In: Witmer GW, Pitt WC, Fagerstone KA eds. Managing vertebrate invasive species. Proceedings of an International Symposium, USDA/APHIS/WS, National Wildlife Research Centre, Fort Collins, CO. Pp. 418–433.
- Faith DP, Minchin PR, Belbin L 1987. Compositional dissimilarity as a robust measure of ecological distance. Vegetatio 69: 57–68. 10.1007/BF00038687
- Fukami T, Wardle DA, Bellingham PJ, Mulder CPH, Towns DR, Yeates GW et al. 2006. Above- and below-ground impacts of introduced predators in seabird-dominated island ecosystems. Ecology Letters 9: 1299–1307. 10.1111/j.1461-0248.2006.00983.x
- Fuller S, Gorman N 1997. Karori wildlife sanctuary trust fence trials. National predator management workshop 1997. Wellington, New Zealand, Department of Conservation. Pp. 37–44.
- Gibbs GW 2009. The end of an 80-million year experiment: a review of evidence describing the impact of introduced rodents on New Zealand's ‘mammal-free’ invertebrate fauna. Biological Invasions 11: 1587–1593. 10.1007/s10530-008-9408-x
- Gibbs GW 2010. Do New Zealand invertebrates reflect the dominance of birds in their evolutionary history? New Zealand Journal of Ecology 34: 152–157.
- Gillies CA, Leach MR, Coad NB, Theobald SW, Campbell J, Herbert T et al. 2003. Six years of intensive pest mammal control at Trouson Kauri Park, a Department of Conservation ‘mainland island’, June 1996–July 2002. New Zealand Journal of Zoology 30: 399–420. 10.1080/03014223.2003.9518349
- Green CJ 2002. Recovery of invertebrate populations on Tiritiri Matangi Island, New Zealand following eradication of Pacific rats (Rattus exculans) (Abstract). In: Veitch CR, Clout MN eds. Turning the tide: the eradication of invasive species. IUCN SSC Invasive Species Specialist Group. Gland, Switzerland and Cambridge, IUCNP. 407 p.
- Higgins PJ, Peter JM 2002. Handbook of Australian, New Zealand and Antarctic birds, Vol. 6, Pardalotes to Shrike thrushes. Melbourne, Australia, Oxford University Press.
- Holdaway RN 1999. Introduced predators and avifaunal extinctions in New Zealand. In: MacPhee RDE ed. Extinctions in near time. Dordrecht, Kluwer Academic/Plenum Publishers. Pp. 189–238.
- Hudson GV 1934. New Zealand beetles and their larvae. An elementary introduction to the study of our native Coleoptera. Wellington, Ferguson and Osburn. 236 p.
- Hunt M, Sherley G, Wakelin M 1998. Results of a pilot study to detect benefits to large-bodied invertebrates from sustained regular poisoning of rodents and possums at Karioi, Ohakune. Science for Conservation 102. Wellington, Department of Conservation. 18 p.
- Hutcheson J 1999. Characteristics of Mapara insect communities as depicted by Malaise trapped beetles: changes with time and animal control. Science for Conservation 135. Wellington, Department of Conservation. 21 p.
- Innes J, Kelly D, Overton JM, Gillies C 2010. Predation and other factors currently limiting New Zealand forest birds. New Zealand Journal of Ecology 34: 86–114.
- Innes J, Lee WG, Burns B, Campbell-Hunt C, Watts C, Phipps H et al. 2012. Role of predator-proof fences in restoring New Zealand's biodiversity: a response to Scofield et al. (2001). New Zealand Journal of Ecology 36: 232–238.
- Innes J, Saunders A 2011. Eradicating multiple pests: an overview. In: Veitch CR, Clout MN, Towns DR eds. Island invasives: eradication and management. IUCN SSC Invasive Species Specialist Group. Gland, Switzerland and Cambridge, IUCNP. Pp. 177–188.
- James HF 1995. Prehistoric extinctions and ecological changes on oceanic islands. In: Vitousek PM, Loope LL, Andersen H eds. Islands – biodiversity and ecosystem function. Berlin, Springer-Verlag. Pp. 87–102.
- Karori Sanctuary Trust 2008. Annual Report July 2007–June 2008. Wellington, New Zealand, Karori Sanctuary Trust.
- King CM. 2005. The handbook of New Zealand mammals. Melbourne, Oxford University Press. 610 p.
- King PA 2007. The effects of rodents on ground-dwelling arthropods in the Waitakere Ranges. Unpublished MSc thesis. Auckland, New Zealand, Auckland University of Technology. 179 p.
- Klimaszewski J, Watt JC 1997. Coleoptera: family-group review and keys to identification. Fauna of New Zealand 37. Lincoln, NZ, Manaaki Whenua Press, 199 p.
- Kuschel G. 1990. Beetles in a suburban environment: a New Zealand case study. Wellington, NZ, Department of Scientific and Industrial Research.
- Lee W, McGlone M, Wright E 2005. Biodiversity inventory and monitoring. A review of national and international systems and a proposed framework for future biodiversity monitoring by the Department of Conservation. Landcare Research Contract Report: LC0405/122.
- Marra MJ 2007. Beetle records – late Pleistocene of New Zealand. In: Elias SA ed. Encyclopedia of Quaternary science. Elsevier, Amsterdam. Pp. 236–246.
- McGavin S 2009. Density and pair fidelity in a translocated population of North Island robin (Petroica longipes). Notornis 56: 206–212.
- Miller AP, Webb PI 2001. Diet of house mice (Mus musculus L.) on coastal sand dunes, Otago, New Zealand. New Zealand Journal of Zoology 28: 49–55. 10.1080/03014223.2001.9518256
- Minchin PR 1987. An evaluation of the robustness of techniques for ecological ordination. Vegetatio 69: 89–107. 10.1007/BF00038690
- Miskelly C, Empson R, Wright K 2005. Forest birds recolonising Wellington. Notornis 52: 21–26. 10.1007/BF00038690
- Moles AT, Drake DR 1999. Potential contributions of the seed rain and seed bank to regeneration of native forest under pine plantation in New Zealand. New Zealand Journal of Botany 37: 83–93. 10.1080/0028825X.1999.9512615
- Nelson L, Clark FW 1973. Correction for sprung traps in catch/effort calculations of trapping results. Journal of Mammalogy 54: 295–298. 10.2307/1378903
- New TR 2012. Insect conservation: past, present and prospects. London, Springer. 435 p.
- Orchard BA, Cullis BR, Coombes NE, Virgona JM, Klein T 2000. Grazing management studies within the Temperate Pasture Sustainability Key Program: experimental design and statistical analysis. Australian Journal of Experimental Agriculture 40: 143–154. 10.1071/EA98005
- Payne RW, Murray DA, Harding SA, Baird DB, Soutar DM 2010. An introduction to GenStat for windows. 13th edition. Hemel Hempstead, UK, VSN International.
- Powlesland RG 1981. The foraging behaviour of the South Island robin. Notornis 28: 89–102.
- Pyke GH, Pulliam HR, Charnov EL. 1977. Optimal foraging – a selective review of theory and tests. Quarterly Review of Biology 52: 137–154. 10.1086/409852
- Ramsay GW 1978. A review of the effect of rodents on the New Zealand invertebrate fauna. In: Dingwall PR, Atkinson IAE, Hay C eds. The ecology and control of rodents in New Zealand Nature Reserves. Department of Lands and Survey Information Series 4. Wellington, Department of Lands and Survey. Pp. 89–98.
- Rate SR 2009. Does rat control benefit forest invertebrates at Moehau, Coromandel Peninsula? DOC Research & Development Series 316. Wellington, Department of Conservation. 25 p.
- Rufaut CG, Clearwater SG 1997. The response of lizards and invertebrates following eradication of kiore and weka from the Chetwode Islands. Nelson/Marlborough Conservancy Occasional Publication No. 41. Wellington, Department of Conservation. 25 p.
- Rufaut CG, Gibbs GW 2003. Response of a tree weta population (Hemideina crassidens) after eradication of the Polynesian rat from a New Zealand island. Restoration Ecology 11: 13–19. 10.1046/j.1526-100X.2003.00058.x
- Ruscoe WA, Murphy EC 2005. House mouse. In: King CM ed. The handbook of New Zealand mammals. Melbourne, Oxford University Press. Pp. 204–221.
- Sinclair L, McCartney J, Godfrey J, Pledger S, Wakelin M, Sherley G 2005. How did invertebrates respond to eradication of rats from Kapiti Island, New Zealand? New Zealand Journal of Zoology 32: 293–315. 10.1080/03014223.2005.9518421
- Southwood TRE 1978. Ecological methods. 2nd edition. London, Chapman & Hall. 575 p.
- Speedy C, Day T, Innes J 2007. Pest eradication technology—the critical partner to pest exclusion technology: the Maungatautari experience. In: Witmer GW, Pitt WC, Fagerstone KA eds. Managing vertebrate invasive species: proceedings of an international symposium. Fort Collins, CO, USDA/APHIS/WS, National Wildlife Research Center. Pp. 115–126.
- Spurr EB 1996. Environmental effects of rodent Talon® baiting. Part 2: impacts on invertebrate populations. Science for Conservation 38. Wellington, Department of Conservation. Pp. 12–27.
- St Clair JJH 2011. The impacts of invasive rodents on island invertebrates. Biological Conservation 144: 68–81. 10.1016/j.biocon.2010.10.006
- Topping CJ, Sunderland KD 1992. Limitations to the use of pitfall traps in ecological studies exemplified by a study of spiders in a field of winter wheat. Journal of Applied Ecology 29: 485–491. 10.2307/2404516
- Towns DR, Wardle DA, Mulder CPH, Yeates GW, Fitzgerald BM, Parrish GR et al. 2009. Predation of seabirds by invasive rats: multiple indirect consequences for invertebrate communities. Oikos 118: 420–430. 10.1111/j.1600-0706.2008.17186.x
- Van Aarde RJ, Ferreira SM, Wassenaar TD 2004. Do feral house mice have an impact on invertebrate communities on sub Antarctic Marion Island? Austral Ecology 29: 215–224. 10.1111/j.1442-9993.2004.01341.x
- Verbyla AP, Cullis BR, Kenward MG, Welham SJ 1999. The analysis of designed experiments and longitudinal data by using smoothing splines. Journal of the Royal Statistical Society: Series C (Applied Statistics) 48: 269–311. 10.1111/1467-9876.00154
- Wardle DA, Bellingham PJ, Bonner KI, Mulder CPH 2009. Indirect effects of invasive predators on litter decomposition and nutrient resorption on seabird-dominated islands. Ecology 90: 452–464. 10.1890/08-0097.1
- Wardle DA, Bellingham PJ, Fukami T, Mulder CPH 2007. Promotion of ecosystem carbon sequestration by invasive predators. Biology Letters 3: 479–482. 10.1098/rsbl.2007.0163
- Watts CH, Armstrong DP, Innes J, Thornburrow D 2011. Dramatic increases in weta (Orthoptera) following mammal eradication on Maungatautari – evidence from pitfalls and tracking tunnels. New Zealand Journal of Ecology 35: 261–272.
- Watts C, Empson R, Thornburrow D, Rohan M 2012. Movements, behaviour and survival of adult Cook Strait giant weta (Deinacrida rugosa; Anostostomatidae: Orthoptera) immediately after translocation as revealed by radiotracking. Journal of Insect Conservation 16: 763–776. 10.1007/s10841-012-9461-8
- Wilson KJ 2004. Flight of the huia: ecology and conservation of New Zealand's frogs, reptiles, birds and mammals. Christchurch, Canterbury University Press.