
ABSTRACT
We undertook stratified random sampling of vegetation, soil chemical fertility and subsurface soil temperature at 38 sites on 15 geothermal fields in the Taupō Volcanic Zone, central North Island, New Zealand, to develop a quantitative classification of geothermal vegetation types and to identify the main environmental drivers of vegetation composition. We implemented this with the fuzzy classification framework of noise clustering. Gradients in composition were derived using Detrended Correspondence Analysis ordination and related to soil physical and chemical parameters using correlation. Of 166 plant species recorded, only seven native species were present in > 20% of plots and only four adventive species in > 5% of plots. Subsurface soil temperatures ranged from ambient (7 °C) to near-boiling (98.5 °C). Classification identified 16 vegetation associations, almost all dominated by indigenous species and unique to geothermal fields. Subsurface soil temperature was the main factor controlling vegetation composition; soil chemistry was less important.
Introduction
Geothermal areas throughout the world provide unique habitats for biota through their distinctive combinations of unusual microclimatic and edaphic environments. The former includes elevated air temperatures and humidity, the latter elevated soil temperatures, extremes of acidity and alkalinity, and unusually high—even toxic—concentrations of some metals such as aluminium. The high environmental stresses of these extreme environments exclude most vascular plant species and lead to plant communities very different from those of the surrounding matrix (e.g. Burns Citation1997; Convey et al. Citation2000; Stout & El-Niemi Citation2002). Thus geothermal vegetation— despite its frequent occurrence within forested bioclimatic zones—is generally dominated by bryophytes (e.g. Iceland: Elmarsdottir et al. Citation2003; Japan: Glime & Iwatsuki Citation1994; Antarctica: Convey et al. Citation2000) which are favoured by the warm, moist environments that prevail, or by grasses and herbs (e.g. Yellowstone National Park, USA; Stout & Al-Niemi Citation2002). In New Zealand, however, geothermal vegetation is unusual in that it is mostly dominated by woody vegetation (Houghton et al. Citation1989; Wardle Citation1991; Cody Citation2007; Boothroyd Citation2009).
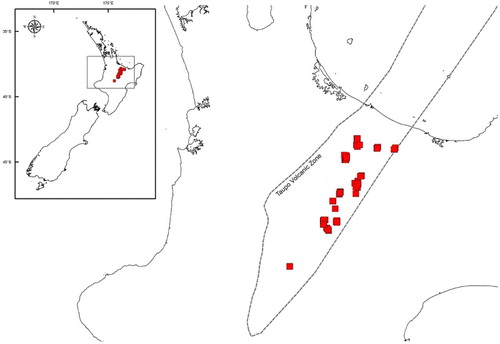
The Taupō Volcanic Zone in the centre of New Zealand’s North Island (Wilson et al. Citation1995) embraces most of New Zealand’s surface geothermal features and most of its geothermally-influenced vegetation, with some 1047 ha of vegetation occurring at 105 sites on 25 geothermal fields (Fitzgerald & Smale Citation2010; Wildland Consultants Ltd Citation2011; Burns et al. Citation2013). The physical limitations and dangers inherent in active geothermal sites appear to have deterred rigorous quantitative sampling of their vegetation with the exception of Te Kopia Geothermal Field (Burns Citation1997). A global classification is needed to provide an overview of the geothermal vegetation of the zone and to allow ready comparisons to be drawn between the vegetation on different geothermal fields in different parts of the zone. This is necessary for priorities to be set for conservation and for allocation of management resources among geothermal sites.
Methods
Recent mapping of geothermal vegetation in the Taupō Volcanic Zone (Fitzgerald & Smale Citation2010; Wildland Consultants Ltd Citation2011) was used as the basis of stratification into nine structural classes: soilfield; mossfield; grassland; fernland; shrubland; scrub; treefernland; treeland; and forest (Atkinson Citation1985). Within mapped areas of each structural class, random locations were generated for potential plot sampling. Sampling aimed to place 20 plots in each of the nine classes ().
Figure 1. Taupō Volcanic Zone, North Island, New Zealand, with sampling locations in red.
Data collection
We used a GPS to locate the pre-selected locations. If it was not safe to sample the vegetation at this point, vegetation was sampled at the nearest safe location using randomly allocated cardinal bearings and fixed distances of multiples of 5 m. After random plot sampling was completed at a site, any under-sampled rare vegetation types (e.g. mossfield) were sampled. Across all sites, 14 such subjectively located plots were sampled. Varying plot sizes were used, reflecting varying vegetation stature, and ranging from 2 × 2 m in short shrubland and scrub to 5 × 5 m in taller shrubland and scrub to 10 × 10 m in forest. Within each plot we recorded (Hurst & Allen Citation2007):
Observed structural class
Whether it occurred in an urban (i.e. within an urban area), peri-urban (i.e. on the edge of an urban area) or rural area
Plant and lichen species abundance in seven fixed height tiers (0–30 cm; > 30 cm–2 m; > 2 m–5 m; > 5 m–12 m; > 12 m–25 m; > 25 m; epiphyte) using a modified Braun-Blanquet cover-abundance scale (1 = < 1%, 2 = 1%–5%, 3 = 6%–25%, 4 = 26%–50%, 5 = 51%–75%, 6 = 76%–100%)
All vascular plant species present, including invasive weeds and bryophytes. Lichens were not identified to species.
Topographic position, elevation, slope, aspect and drainage
Cover of boulders and litter using a cover-abundance scale (1 = < 1%, 2 = 1%–5%, 3 = 6%–25%, 4 = 26%–50%, 5 = 51%–75%, 6 = 76%–100%)
Subsurface soil temperature was recorded at 10 cm depth at 10 systematically placed locations within each plot during sampling in autumn. In a small number of instances, for example silica terraces, substrates were too impenetrable for soil temperatures to be measured. Subsurface (10 cm depth) soil temperatures were averaged for each plot and the means compared with ambient long-term soil temperatures (10 cm depth) for the same month from the nearest climate station (New Zealand Meteorological Service Citation1973).
Soil samples to 10 cm depth were collected at the same 10 systematic locations within each plot and bulked for later analysis. Soil samples were analysed for pH, electrical conductivity, cation exchange capacity (CEC), organic carbon, total nitrogen, Olsen phosphorus, exchangeable bases (calcium, magnesium, sodium, potassium) and water-soluble sulphate following Blakemore et al. (Citation1987) and calcium chloride extractable aluminum following Hoyt & Nyborg (Citation1972). Parameter values were rated according to Blakemore et al. (Citation1987).
Data analysis
Before classification and ordination, cover scores within each height tier were converted to the midpoint of the percentage cover range for that cover class and summed across tiers (e.g. Wiser et al. Citation2002). This generated an importance value reflecting the volume occupied by each species rather than its projected cover.
We used the approach of semi-supervised clustering (De Cáceres et al. Citation2010; Tichý et al. Citation2014) to allow these new data to be incorporated into a pre-existing classification framework of New Zealand’s woody vegetation (Wiser & De Cáceres Citation2013). We implemented this with the fuzzy classification framework of noise clustering. This framework has two distinct advantages. First, it allows plot records that are compositional outliers to be recognised using quantitative criteria (De Cáceres et al. Citation2010). Second, it allows plots that are transitional in composition between defined types (e.g. those occurring on ecotones) to be recognised.
Resemblance between plots was defined using the Chord distance (Orlóci Citation1967). As a first step, we used this framework to determine whether any of the geothermal vegetation plots were sufficiently similar to woody vegetation associations defined by Wiser et al. (Citation2011) to be classed as such. We then classified all plots that could not be assigned to the previously defined vegetation types with the constraint that the newly defined types would be as distinct as possible from these. We required a minimum of two plots to define a vegetation type. Plots too dissimilar from others in the datasets to be included in a set that defined a vegetation type were designated as ‘outliers’.
Once vegetation types (termed ‘associations’) were defined, we named them based on their dominant species. We defined dominant species for inclusion in the name by ranking the species in the association according to their relative constancy (% frequency in the type) and relative cover. Species were only listed in name if constancy was more than 85%: if there were more than five species with constancy over 85%, only the top six were listed. A ‘/’ indicates the species that occur in different tiers (working from the top tier down); ‘–’ indicates they occur in the same tier. Within a tier species are ordered by decreasing constancy. The letters ‘GEO’ before number below means it is a new association that has been defined only for geothermal areas. An ‘a’ means the association has been defined at the national level by Wiser & De Cáceres (Citation2013). Vegetation types were allocated to structural classes following Atkinson (Citation1985).
To understand how vegetation composition related to environment, we derived gradients in composition using Detrended Correspondence Analysis ordination. We then used Spearman rank correlation to determine whether plot positions along these gradients were related to soil physical (temperature, surface substrate texture) and chemical (fertility) characteristics. ANOVA was performed on soil parameters to test for differences in them between sites with more than two replicates, and Tukey tests to elucidate those differences.
Results
Soil chemistry
Soil chemistry varied considerably among plots and sites. On average, soils were strongly acidic (mean pH 4.3) with moderate levels of organic carbon (7.2%) and Olsen phosphorus (25 mg/kg) and moderate CEC (19.9 cmol/kg) but low base saturation (24.3%) and low levels of total nitrogen (0.3%), calcium (2.5 cmol/kg), magnesium (0.6 cmol/kg), potassium (0.5 cmol/kg) and sodium (0.3 cmol/kg). They also had, on average, extremely high levels of aluminium (77 mg/kg) and sulphur (2347 mg/kg). All of these parameters varied significantly (P < 0.01) between at least some sites.
Soil subsurface temperature
Mean soil temperatures in plots ranged from ambient (lowest, 7 °C) to near-boiling (highest, 98.5 °C). Most fell in the ambient to slightly heated range of < 20 °C () and, on average, were 17.8 °C above ambient temperatures.
Table 1. Soil temperature classes in 165 random plots in geothermal vegetation across the Taupō Volcanic Zone.
Flora
A total of 138 vascular plant species were recorded in plots, comprising 80 native and 58 adventive species (Appendix 1). A total of 28 bryophyte species were recorded, comprising 19 moss and nine liverwort species (Appendix 2). Only seven native species were widespread, occurring in more than 20% of plots (), of which the three shrubby species, Kunzea tenuicaulis (prostrate kānuka), Leucopogon fasciculatus (mingimingi), and Leptospermum scoparium (mānuka), are all sclerophyllous and typical of heathlands on infertile soils across the country (Burrows et al. Citation1979). Only four adventive species—Rubus fruticosus (blackberry), Axonopus fissifolius (narrow-leaved carpet grass), Prunus serrulata (flowering cherry) and Agrostis capillaris (browntop)—occurred in more than 5% of plots.
Table 2. Most widespread native species (occurring in more than 20% of plots) in geothermal vegetation in the Taupō Volcanic Zone.
Vegetation classification
Stratification using existing mapping proved problematic because the structural classes observed at sampling points were not necessarily the same as those indicated by mapping. Over one-third of plots fell in the shrubland class, a reflection of the discord between mapped and actual vegetation classes, and the overwhelming predominance (80% in existing mapping) of shrubland in geothermal vegetation.
Classification of the 155 plots (random and systematic) with both vegetation and soil samples identified 16 vegetation types (associations) in seven structural classes (), all but one of them—Axonopus fissifolius grassland—dominated by native species. The definitions of the associations were based on 118 plots; four plots were transitional between two or more defined associations. The associations comprise two mossfield associations dominated by Campylopus species, three fernland associations dominated by Hypolepis species or Lycopodiella cernua (arching clubmoss), one grassland association dominated by adventive Axonopus fissifolius, one treefernland association dominated by Dicksonia squarrosa (whekī), four shrubland associations dominated by Leptospermum scoparium and Kunzea tenuicaulis, three scrub associations dominated by Kunzea tenuicaulis, Leptospermum scoparium or Leucopogon fasciculatus, one treeland associated dominated by Kunzea robusta (kānuka), and one forest association dominated by Weinmannia racemosa (kāmahi). Of these, two—Leptospermum scoparium shrubland (termed ‘successional shrubland’ in Wiser et al. Citation2011) and Kunzea robusta/(Coprosma–Leucopogon–Leptecophylla) treeland (termed ‘shrubland’ in Wiser et al. Citation2011)—are sufficiently widespread in non-geothermal habitats to have been described in the national-scale plot-based classification of woody vegetation of Wiser et al. (Citation2011).
Table 3. Vegetation associations of the Taupō Volcanic Zone. Codes beginning with ‘GEO’ are for associations defined in this project only. Those beginning with ‘a’ have been defined at the national level in the shrubland classification of Wiser & De Cáceres (Citation2013) and follow the presentation at http://www.landcareresearch.co.nz/publications/factsheets/woody-types/shrublands/list-alliances.
A substantial number (33) of plots did not fall within any association, and a further substantial number (four) were transitional in composition between two or more defined associations. All unclassified plots were on slightly warm to warm ground (mean = 21°C), cooler on average than that of classified plots (32 °C). A higher proportion of unclassified (38%) than of classified (24%) plots were in urban or peri-urban areas. Most associations appear to be of relatively restricted occurrence, over half recorded on only one or two geothermal fields in the Taupō Volcanic Zone and none on all of them.
Full descriptions in order of stature are as follows:
Campylopus introflexus mossfield
Structure and composition: Very short (mean 3 cm, range 3–4 cm) mossfield dominated by Campylopus introflexus. No other species are consistently present (i.e. in at least half the samples).
Habitat: Hot (mean temperature at 10 cm depth 44 °C) ground on geothermal sites.
Campylopus pyriformis mossfield
Structure and composition: Very short mossfield (mean height 5 cm) dominated entirely by Campylopus pyriformis. A floristically poor association with no other species present.
Habitat: Very hot (72 °C) ground on geothermal sites.
Kunzea tenuicaulis/Campylopus pyriformis shrubland ()
Figure 2. Kunzea tenuicaulis/Campylopus pyriformis shrubland on hot soils at Craters of the Moon/Karapiti on the Wairakei Geothermal Field, November 2008.
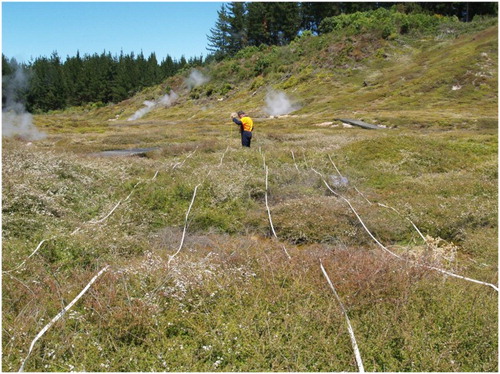
Structure and composition: Short (mean 0.4 m, range 0.2–1 m) shrubland dominated by Kunzea tenuicaulis with a Campylopus pyriformis ground layer. No other species are consistently present, although Lycopodiella cernua is moderately widespread in the ground layer. Habitat: Hot (50 °C) ground on geothermal sites.
Axonopus fissifolius grassland
Structure and composition: Short (mean 0.5 m, range 0.3–0.7 m) grassland dominated by adventive Axonopus fissifolius, with adventive Agrostis capillaris and the moss Campylopus introflexus also consistently present. This is the only association dominated by an adventive species.
Habitat: Warm (26 °C) ground on the margins of geothermal sites.
Kunzea tenuicaulis/Lycopodiella cernua fernland
Composition: Short (mean 0.6 m, range 0.2–1.3 m) fernland dominated by Lycopodiella cernua, with scattered Kunzea tenuicaulis above it. No other species are consistently present.
Habitat: Very hot (68 °C) ground on geothermal sites.
Kunzea tenuicaulis scrub
Composition: Short (mean 1 m, range 0.6–2.3 m) scrub dominated almost entirely by Kunzea tenuicaulis. No other species are consistently present, although a range of bryophytes (Chiloscyphus novae-zelandiae, Telaranea praenitens, Isopterygium species) commonly occur.
Habitat: Hot (39 °C) ground on geothermal sites.
Hypolepis ambigua fernland
Structure and composition: Tall (mean 2.1 m, range 1.4–6 m) fernland dominated almost entirely by Hypolepis ambigua. No other species are consistently present, although Histiopteris incisa (water fern) and Pteridium esculentum (bracken) occur commonly.
Habitat: Warm (21 °C) ground on the margins of geothermal sites.
Hypolepis distans fernland
Structure and composition: Tall (mean 2.8 m, range 1–9 m) fernland dominated almost entirely by Hypolepis distans. Histiopteris incisa and Pteridium esculentum are also consistently present.
Habitat: Warm (21 °C) ground on the margins of geothermal sites.
Leucopogon fasciculatus scrub
Composition: Moderately tall (mean 3 m, range 1–10 m) scrub and shrubland dominated by Leucopogon fasciculatus. No other species are consistently present.
Habitat: Slightly heated (17 °C) ground on the margins of geothermal sites.
Leptospermum scoparium successional shrubland
Structure and composition: Moderately tall (mean 3 m, range 0.3–6 m) shrubland dominated by Leptospermum scoparium. Kunzea tenuicaulis, Leucopogon fasciculatus and Histiopteris incisa are consistently present.
Habitat: Warm (24 °C) ground on the margins of geothermal sites.
Kunzea tenuicaulis–Leucopogon fasciculatus shrubland
Composition: A variable association of widely varying height (mean 5 m, range 1–12 m) and structure (mostly shrubland, with some scrub, forest and treeland), dominated by Kunzea tenuicaulis and Leucopogon fasciculatus. Dianella nigra (inkberry/tūrutu) is also consistently present in the ground layer.
Habitat: Warm (25 °C) ground on the margins of geothermal sites.
Leucopogon fasciculatus–Kunzea tenuicaulis/Dianella nigra scrub
Composition: Tall (mean 5.5 m, range 2–9 m) scrub dominated by Leucopogon fasciculatus and Kunzea tenuicaulis, with a ground layer dominated by Dianella nigra. Weinmannia racemosa, Myrsine australis (māpou) and Leptecophylla juniperina (prickly heath) are also consistently present, along with bryophytes (Chiloscyphus novae-zelandiae, Lepidozia species, Telaranea species and Dicranoloma robustum).
Habitat: Warm (24 °C) ground on the margins of geothermal sites.
Leptospermum scoparium–Leucopogon fasciculatus–Kunzea tenuicaulis/Pteridium esculentum–Dianella nigra–Paesia scaberula shrubland
Structure and composition: Tall (mean 9 m, range 6–19 m) shrubland dominated by Leptospermum scoparium, Leucopogon fasciculatus, Kunzea tenuicaulis and Pteridium esculentum, over a ground layer dominated by Dianella nigra and Paesia scaberula (ring fern). Adventive Cytisus scoparius (broom) is also consistently present.
Habitat: Slightly heated (17 °C) ground on the margins of geothermal sites.
Dicksonia squarrosa/Dianella nigra treefernland
Structure and composition: Short (mean 9 m, range 7–12 m) treefernland dominated almost entirely by Dicksonia squarrosa, with a ground layer dominated by Dianella nigra. Weinmannia racemosa, Pseudopanax arboreus (fivefinger), Myrsine australis and Leucopogon fasciculatus are also consistently present.
Habitat: Slightly heated (19 °C) ground on the margins of geothermal sites.
Kunzea robusta/(Coprosma rhamnoides–Leucopogon fasciculatus–Leptecophylla juniperina) treeland
Structure and composition: Short (mean 9 m, range 8–9 m) treeland dominated by Kunzea robusta with an understorey dominated by Coprosma rhamnoides, Leucopogon fasciculatus and Leptecophylla juniperina. Knightia excelsa (rewarewa), Myrsine australis, Coprosma lucida (karamū), Dianella nigra and Ptychomnion aciculare, along with adventive Cotoneaster glaucophyllus and Prunus serrulata, are consistently present.
Habitat: Warm (22 °C) ground on the margins of geothermal sites.
Weinmannia racemosa/Leucopogon fasciculatus–Pteridium esculentum–Leptecophylla juniperina/Telaranea praenitens–Leucobryum javense forest
Structure and composition: Short (mean 9 m, range 5–16 m) forest dominated by Weinmannia racemosa, with an understorey dominated by Leucopogon fasciculatus, Leptecophylla juniperina and Pteridium esculentum, and a ground layer dominated by bryophytes (especially Telaranea praenitens and Leucobryum javense). A range of other trees and shrubs—Pseudopanax arboreus, Myrsine australis, Leptospermum scoparium, Coprosma lucida), megaherb (Astelia solandri), fern (Dicranopteris linearis, Lycopodium deuterodensum) and bryophyte (Chiloscyphus novae-zelandiae, Ptychomnion aciculare) species—are also consistently present.
Habitat: Slightly heated (18 °C) ground on the margins of geothermal sites.
Relationships between vegetation and environment
The DCA ordination showed that compositional patterns largely reflect a single dominant vegetation gradient () that is strongly related to a complex gradient reflecting changes in both soil temperature () and soil chemistry (). Soil temperature, pH and base saturation decrease and aluminium, CEC, total nitrogen and organic carbon increase from left to right along the compositional gradient. Boulders are more prevalent on cooler soils as well. A secondary compositional gradient shows a relationship to the amount of litter present. Species such as lichens, Lycopodiella cernua, Campylopus pyriformis, Kunzea tenuicaulis and Campylopus introflexus tend to occur at the warmer end of the primary gradient, whereas species such as Pteridium esculentum, Histiopteris incisa, Dicksonia squarrosa, Pseudopanax arboreus, Rubus fruitcosus, Coprosma lucida and Kunzea robusta tend to occur at the cooler end (). Overlying the association identities with the ordination shows how each association is restricted to a relatively small portion of this gradient (). The degree to which this reflects soil temperature is illustrated in . Shorter associations dominated by mosses and by geothermal endemics (Campylopus pyriformis, Kunzea tenuicaulis) occur on the left side of the plot ordination () and taller associations dominated by mesic species such as Weinmannia racemosa and Dicksonia squarrosa on the right side. The exceptions to this stature pattern are short fernland associations dominated by Hypolepis ambigua and H. distans on the right side of the ordination. Associations in which Leucopogon fasciculatus is prominent occur in the centre of the ordination. Adventive species occur across the entire compositional gradient, but are most diverse on the end of the compositional gradient on cooler sites with more fertile soils (i.e. higher total nitrogen and organic carbon; ).
Figure 3. Species by environment biplot displaying results of DCA ordination of 155 plots with both vegetation and soil data in the Taupō Volcanic Zone. To simplify interpretation, only the most influential species and environmental variables are displayed. For environmental variables, those having R2 with one or more axes > 0.18 are shown. For species, those 34 having a weight in the ordination > 4 are displayed. Species codes (* denotes adventive): CAMINT Campylopus introflexus; CAMPYR Campylopus pyriformis; CHILOS Chiloscyphus spp.; COPLUC Coprosma lucida; DIANIG Dianella nigra; DICLIN Dicranopteris linearis; DICRAN Dicranoloma spp.; DICSQU Dicksonia squarrosa; GLEMIC Gleichenia microphylla; HISINC Histiopteris incisa; HYPAMB Hypolepis ambigua; HYPDIS Hypolepis distans; ISOPTE Isopterygium spp.; KUNERI Kunzea robusta; KUNEVM Kunzea tenuicaulis; LEPBIS Lepidozia bisbifida; LEPCON Lepidozia concinna; LEPJUN Leptecophylla juniperina; LEPSCO Leptospermum scoparium; LEUFAS Leucopogon fasciculatus; LEUJAV Leucobryum javense; LYCCER Lycopodiella cernua; MYRAUS Myrsine australis; PARMEL Parmelia spp; PSEARB Pseudopanax arboreus; PTEESC Pteridium esculentum; PTYACI Ptychomnion aciculare; RUBFRU *Rubus fruticosus; TELARA Telaranea spp.; WEIRAC Weinmannia racemosa.
Figure 4. Plot by environment biplot displaying results of DCA ordination of 155 plots with both vegetation and soil data in the Taupō Volcanic Zone. To simplify interpretation, only the most influential environmental variables are displayed (i.e. those having R2 with one or more axes > 0.18). Plots are coded by association with codes as in . The shapes of the association symbols reflect vegetation structure.
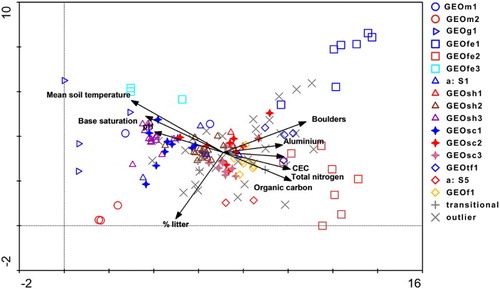
Figure 5. Box plot of soil temperature (10 cm depth) by vegetation association, ordered by descending median temperature. Horizontal bars represent median temperature; the top and bottom of the boxes represent the 75th and 25th quartile respectively; the dashed vertical lines show the maximum and minimum values. Association codes as in .
Figure 6. Adventive species by plot biplot displaying results of DCA ordination of 155 plots with both vegetation and soil data in the Taupō Volcanic Zone. Species occurring on three or more plots are shown. Plots are coded by association as in . The shapes of the association symbols reflect vegetation structure. ACADEA Acacia dealbata; AGRCAP Agrostis capillaris; AXOFIS Axonopus fissifolius; BETPEN Betula pendula; CORSEL Cortaderia selloana; COTGLA Cotoneaster glaucophyllus; CYNDAC Cynosurus dactylis; CYPERA Cyperus eragrostis; CYTSCO Cytisus scoparius; DACGLO Dactylis glomerata; ERILUS Erica lusitanica; EUCBOT Eucalyptus botryoides; HEDHEL Hedera helix; LIGSIN Ligustrum sinense; OXACOR Oxalis corniculata; PASURV Paspalum urvillei; PINPIN Pinus pinaster; PINRAD Pinus radiata; PRUSER Prunus serrulata; PSEJAP Pseudosasa japonica; ULEEUR Ulex europaeus; RUBFRU Rubus fruticosus.
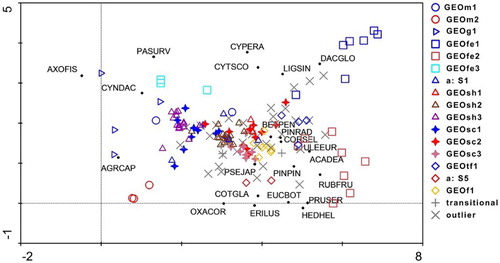
Table 4. Correlations of DCA axes with environmental parameters in geothermal vegetation associations of the Taupō Volcanic Zone.
Vegetation height is strongly inversely correlated (r2 = −0.4, P < 0.01) with soil temperature, with mean association height reducing dramatically at mean subsurface temperatures above 30 °C. Although varying plot size precludes analysis of species richness here, a similar trend appears likely.
Discussion
Geothermal vegetation in the Taupō Volcanic Zone is floristically very simple, dominated by a small suite of tree (Weinmannia racemosa), shrub (Kunzea tenuicaulis, Leucopogon fasciculatus, Leptospermum scoparium, Leptecophylla juniperina, Coprosma rhamnoides), liane (adventive Rubus fruticosus), herb (Dianella nigra), grass (adventive Axonopus fissifolius), fern (Dicksonia squarrosa, Hypolepis ambigua, H. distans, Pteridium esculentum, Paesia scaberula), lycophyte (Lycopodiella cernua) and bryophyte (Campylopus pyriformis, C. introflexus, Chiloscyphus novae-zelandiae, Telaranea praenitens, Leucobryum javense) species. Of these, only native species (Kunzea tenuicaulis, Leptospermum scoparium, Leucopogon fasciculatus, Dianella nigra, Pteridium esculentum, Campylopus pyriformis, Chiloscyphus novae-zelandiae) and one adventive (Rubus fruticosus) are widespread (). Apart from one species, Kunzea tenuicaulis, endemic to geothermal sites (de Lange Citation2014), and another, Campylopus pyriformis that also occurs in geothermal areas elsewhere in the world (e.g. Skotnicki et al. Citation2001; Bonini et al. Citation2005), the dominant species are all widespread in other mesic habitats (e.g. http://www.nzpcn.org.nz/flora). A small number of other tree (Pseudopanax arboreus, Myrsine australis, Knightia excelsa), shrubs (Leptecophylla juniperina, Coprosma lucida), megaherb (Astelia solandri), and fern (Histiopteris incisa, Dicranopteris linearis) species are consistently or commonly present in some associations, along with a very small suite of weedy adventives (Prunus serrulata, Cotoneaster glaucophyllus, Cytisus scoparius, Agrostis capillaris). This floristic poverty reflects the highly stressed edaphic environment of geothermal sites.
Our study generalises specific results from three sites on two geothermal fields—Wairakei (Given Citation1980; van Manen & Reeves Citation2012) and Te Kopia (Burns Citation1997)—in the Taupō Volcanic Zone. Geothermally-influenced vegetation and geothermally-influenced soils extend well beyond surface geothermal expression (). A range of communities mostly unique to geothermal fields occurs across the spectrum of soil temperatures and chemistries present, most of them—including two that are widespread beyond them—on the extensive slightly heated soils surrounding geothermal surface features, with a small number on the smaller areas of markedly heated soils (). Soil chemical fertility is generally low (), with high acidity and high levels of sulphur and aluminium, the latter at levels that are normally toxic for plants.
Vegetation pattern appears to be controlled by a complex stress gradient reflecting variation in both soil temperature () and soil chemistry (). Other features of the stress gradient at Te Kopia—decreasing canopy height, plant stature, leaf size, litter ground cover and, probably, species richness (although our methodology precludes analysis of this) with increasing soil temperature—also apply generally to vegetation on geothermal fields across the Taupō Volcanic Zone. There appear to be distinct regional patterns, with some associations—for example, Leucopogon fasciculatus scrub in the northern part of the zone—more common or apparently restricted to parts of the Taupō Volcanic Zone, and others—for example, Kunzea tenuicaulis/Campylopus pyriformis shrubland at Wairakei—apparently more or less restricted to one geothermal field.
Soil temperature is the main factor controlling vegetation pattern on geothermal fields elsewhere in the world, for example Ponponyama, Japan (Glime & Iwatsuki Citation1994), Iceland (Elmarsdottir et al. Citation2003), Yellowstone National Park, USA (Sheppard Citation1971), Mt Melbourne, Antarctica (Broady et al. Citation1987) and the South Sandwich Islands, Antarctica (Convey et al. Citation2000). Vascular floras are universally depauperate at geothermal sites, as here. In Iceland, as here, bryophytes dominate hotter soils and vascular plants cooler ones (Elmarsdottir et al. Citation2003).
Geothermal vegetation presents particular difficulties for classification and mapping because of the highly dynamic nature of the environment in both space and time. This is reflected in the substantial amount of discord between mapped and actual structural classes at sampling locations, and in the relatively large number of samples that were so dissimilar from all other samples that they did not conform to any defined association. However, a higher proportion of unclassified (38%) than classified (24%) samples were in urban or peri-urban areas, and generally had higher proportions of adventive species, reflecting the greater weed ‘pressure’ on them (Timmins & Williams Citation1991) and the apparently unpredictable successional trajectories of the mixed communities of indigenous and adventive species that are becoming ever more common in New Zealand. The one association dominated by an adventive species, Axonopus fissifolius grassland, seems likely to become more widespread in future.
Acknowledgements
We thank Katherine Luketina (Waikato Regional Council) and Nancy Willems (Bay of Plenty Regional Council) for arranging Regional Council funding and for support and encouragement, Dr David and Susan Bergin (Tikitere) for accommodation, Christopher Floyd (Warkworth) and Dr Bruce Burns (University of Auckland) for field assistance, Robert Price (Landcare Research, Hamilton) for generating sampling points, Brian Daly and Ngaire Foster (Landcare Research, Palmerston North) for advice on and soil analysis, Dr Allan Fife and Dr David Glenny (Landcare Research, Lincoln) for bryophyte identification, Kerry Ford (Landcare Research, Lincoln) for monocot identification, Dr Norman Mason (Landcare Research, Hamilton) for statistical analyses, and numerous individuals and organisations for access permission. Two anonymous referees provided invaluable comments on the draft manuscript.
Disclosure statement
No potential conflict of interest was reported by the authors.
Additional information
Funding
References
- Atkinson IAE. 1985. Derivation of vegetation mapping units for an ecological survey of Tongariro National Park, North Island, New Zealand. New Zealand Journal of Botany. 23:361–378. doi: 10.1080/0028825X.1985.10425343
- Blakemore LC, Searle PL, Daly BK. 1987. Methods for chemical analyses of soils. NZ Soil Bureau Scientific Report 80. Lower Hutt: DSIR.
- Bonini I, Casini F, Chiarucci A, De Dominicis V. 2005. The bryophyte flora of the geothermal field of Sasso Pisano (Pisa, Italy). Cryptogamie, Bryologie. 26:291–299.
- Boothroyd IKG. 2009. Ecological characteristics and management of geothermal systems of the Taupo Volcanic Zone, New Zealand. Geothermics. 38:200–209. doi: 10.1016/j.geothermics.2008.12.010
- Broady P, Given DR, Greenfield L, Thompson K. 1987. The biota and environment of fumaroles on Mt Melbourne, northern Victoria Land. Polar Biology. 7: 797–113.
- Burns BR. 1997. Vegetation change along a geothermal stress gradient at the Te Kopia steamfield. Journal of the Royal Society of New Zealand. 27:279–293. doi: 10.1080/03014223.1997.9517539
- Burns BR, Ward J, Downs TM. 2013. Trampling impacts on thermotolerant vegetation of geothermal areas in New Zealand. Environmental Management. 52:1463–1473. doi: 10.1007/s00267-013-0187-5
- Burrows CJ, McQueen DR, Esler AE, Wardle P. 1979. New Zealand heathlands. In: Specht RL, editor. Heathlands and related shrublands: descriptive studies. Ecosystems of the World 9A, Amsterdam: Elsevier; p. 339–364.
- Cody AD. 2007. Geodiversity of geothermal fields in the Taupo Volcanic Zone. DOC Research and Development Series 281. Wellington, New Zealand: Department of Conservation. pp. 1–70.
- Convey P, Lewis-Smith RI, Hodgson DA, Peat, HJ. 2000. The flora of the South Sandwich Islands, with particular reference to the influence of geothermal heating. Journal of Biogeography. 27:1279–1295. doi: 10.1046/j.1365-2699.2000.00512.x
- De Cáceres M, Font X, Oliva F. 2010. The management of numerical vegetation classification with fuzzy clustering methods. Journal of Vegetation Science. 21:1138–1151. doi: 10.1111/j.1654-1103.2010.01211.x
- de Lange PJ. 2014. A revision of the New Zealand Kunzea ericoides (Myrtaceae) complex. PhytoKeys. 40:1–185. doi: 10.3897/phytokeys.40.7973
- Elmarsdottir A, Ingimarsdottir M, Hansen I, Olafsson JS, Olafsson E. 2003. Vegetation and invertebrates in three geothermal areas in Iceland. Proceedings of the International Geothermal Conference. 12:49–55.
- Fitzgerald NB, Smale MC. 2010. An updated assessment of geothermal vegetation in the Bay of Plenty Region based on 2007 aerial photography. Landcare Research Contract Report LC0016.
- Given DR. 1980. Vegetation on heated soils at Karapiti, central North Island, New Zealand, and its relation to ground temperature. New Zealand Journal of Botany. 18:1–13. doi: 10.1080/0028825X.1980.10427227
- Glime JM, Iwatzuki Z. 1994. Geothermal communities of Ponponyama, Japan. Journal of the Hattori Botanical Laboratory. 75:133–147.
- Houghton BF, Lloyd EF, Keam RF, Johnston DM. 1989. Inventory of New Zealand geothermal fields and features. Wellington: Geological Society of New Zealand Miscellaneous Publication MP044. 54 pp.
- Hoyt DB, Nyborg M. 1972. Use of dilute calcium chloride for the extraction of plant available aluminium and manganese from acid soil. Canadian Journal of Soil Science. 52:163–167. doi: 10.4141/cjss72-020
- Hurst JM, Allen RB. 2007. The RECCE method for describing New Zealand vegetation. Version 4. Lincoln: Manaaki Whenua—Landcare Research.
- New Zealand Meteorological Service. 1973. Summary of climatological observations to 1973. Wellington: New Zealand Meteorological Service.
- Orlóci L. 1967. An agglomerative method for classification of plant communities. Journal of Ecology. 55:193–206. doi: 10.2307/2257725
- Sheppard JS. 1971. The influence of geothermal temperature gradients upon vegetative patterns in Yellowstone National Park [PhD Thesis]. Fort Collins (CO): Colorado State University.
- Skotnicki ML, Selkirk PM, Broady P, Adam KD, Ninham JA. 2001. Dispersal of the moss Campylopus pyriformis on geothermal ground near the summits of Mount Erebus and Mount Melbourne, Victoria Land, Antarctica. Antarctic Science. 13:280–285. doi: 10.1017/S0954102001000396
- Stout RG, Al-Niemi TS. 2002. Heat-tolerant flowering plants of active geothermal areas in Yellowstone National Park. Annals of Botany. 90:259–267. doi: 10.1093/aob/mcf174
- Tichý L, Chytrý M, Botta-Dukát Z, Podani J. 2014. Semi-supervised classification of vegetation: preserving the good old units and searching for new ones. Journal of Vegetation Science. 25:1504–1512. doi: 10.1111/jvs.12193
- Timmins SM, Williams PA. 1991. Weed numbers in New Zealand’s forest and scrub reserves. New Zealand Journal of Ecology. 15:153–162.
- van Manen SM, Reeves R. 2012. An assessment of changes in Kunzea ericoides var. microflora and other hydrothermal vegetation at the Wairakei–Tauhara geothermal field, New Zealand. Environmental Management. 50:766–786. doi: 10.1007/s00267-012-9899-1
- Wardle P. 1991. Vegetation of New Zealand. Cambridge: Cambridge University Press.
- Wildland Consultants Ltd. 2011. Geothermal vegetation of the Waikato Region—an update based on 2007 aerial photographs. Waikato Regional Council Technical Report 2011/29.
- Wilson CJN, Houghton BF, McWilliams MO, Lanphere MA, Weaver SD, Briggs RM. 1995. Volcanic and structural evolution of Taupō Volcanic Zone, New Zealand: a review. Journal of Volcanology and Geothermal Research. 68:1–28. doi: 10.1016/0377-0273(95)00006-G
- Wiser SK, De Cáceres M. 2013. Updating vegetation classifications: an example with New Zealand’s woody vegetation. Journal of Vegetation Science. 24:80–93. doi: 10.1111/j.1654-1103.2012.01450.x
- Wiser SK, Drake DR, Burrows LE, Sykes WR. 2002. The potential for long-term persistence of forest fragments on Tongatapu, a large island in western Polynesia. Journal of Biogeography. 29:767–787. doi: 10.1046/j.1365-2699.2002.00723.x
- Wiser SK, Hurst JM, Allen RB, Wright EF. 2011. New Zealand’s forest and shrubland communities: a quantitative classification based on a nationally representative plot network. Applied Vegetation Science. 14:506–523. doi: 10.1111/j.1654-109X.2011.01146.x