
 ?Mathematical formulae have been encoded as MathML and are displayed in this HTML version using MathJax in order to improve their display. Uncheck the box to turn MathJax off. This feature requires Javascript. Click on a formula to zoom.
ABSTRACT
The enrichment of phosphorus (P) in streams and rivers can impair water quality, but concentrations have decreased. We found little evidence that this improvement was caused by a decrease in soil Olsen P concentrations or imported P (e.g. fertiliser), a change to low water-soluble P fertilisers, or that greater nitrate loads were assimilating P from groundwater or sediments. Possible causes of improvement were that land use change had decreased erosion, more nitrogen fertiliser use was assimilating soil P, and a greater awareness of P as an environmental issue. However, the most probable causes were that strategies were mitigating P loss from land, guidelines were directing where to best use strategies, and policy instruments were including P management. These findings support the development and implementation of mitigations, supported by voluntary guidelines and regulation. However, our findings can be strengthened if data are referenced to equivalent, and finer spatial and temporal scales.
Introduction
Water quality in New Zealand receives considerable scholarly and public attention (Hughey et al. Citation2016). Much of this attention has drawn a link between declining water quality and the proportion of high-intensity land uses in a catchment such as intensively grazed pasture (Wilcock Citation1986; Wilcock, Monaghan, Quinn, et al. Citation2013; Snelder et al. Citation2017). The enrichment of surface freshwaters with P can stimulate algal growth (some species are toxic) leading to the loss of oxygen when algae die, fish kills, and impairment of water for recreation, drinking, and industrial and agricultural uses (Carpenter et al. Citation1998). Previous analyses of water quality data in New Zealand has shown the majority of sites examined by regional authorities and science providers have P concentrations that are likely to limit periphyton growth (McDowell et al. Citation2009). Recent national policy has set an objective that limits chlorophyll-a concentrations to <200 mg m−2 (Ministry for the Environment Citation2017). Chlorophyll-a is a measure of periphyton growth, which is in turn driven by the concentration of the limiting (or co-limiting) nutrient, nitrogen (N) or P.
Trends in the concentrations of various water quality indicators including filterable reactive phosphorus (FRP, also called dissolved reactive P) and total P (TP) are developed as part of regional and national reporting requirements (Ministry for the Environment and Statistics New Zealand Citation2017a). The analysis of data from 1994 to 2013 showed that for 145 monitoring sites in catchments dominated by intensively grazed pasture, median FRP concentrations were decreasing at 46% of locations, increasing at 21% of locations and had showed no change elsewhere (Ministry for the Environment and Statistics New Zealand Citation2017a, Citation2017b). However, when examined at 277 sites between 2004 and 2013 (more had subsequently been established), median FRP concentrations were decreasing at 57% of locations, and increasing at 15% of locations; 29% remained unchanged. For the 159 sites dominated by intensively grazed pasture monitored for TP between 1994 and 2013, 41% of sites were improving (21% were worsening), while for the 304 sites monitored between 2004 and 2013, 65% were improving. This increase in sites exhibiting an improvement in water quality occurred despite an increase in national dairy cow numbers by 26%, and the continued expansion of dairying into new areas commonly used for sheep farming; sheep numbers decreased by 22% over the same period (Statistics New Zealand Citation2018).
Reasons for increases or decreases in P concentrations can be implied, but the strength of any reasoning is dependent on factors such as flow-paths, land use practices and the quality and amount of information over spatial and temporal scales (Álvarez et al. Citation2017). For example, at a small or sub-catchment scale, streamflow may be dominated by surface flows that move quickly from the land into the stream (Woodward et al. Citation2016). However, at a large catchment or regional scale, more streamflow is sourced from deeper and potentially older water (Morgenstern and Daughney Citation2012). This means that while regular sampling for P at a small scale may help pin-point the effect of certain land use practices on streamflow P concentrations (Monaghan et al. Citation2009). At a larger scale the ability to ascribe P concentration trends to land use practices is compromised by our ability to monitor those practices at enough sites and water that is sourced from a range of flow-paths and ages.
Despite these challenges, an ever-increasing amount of data is available. We are now at a stage where we can provide some guidance on the strength of factors (e.g. land use practices) put forward in the scientific and public literature as likely causes of P trends in streamflow (Larned et al. Citation2016; McDowell et al. Citation2016; Ministry for the Environment and Statistics New Zealand Citation2017a). Such factors include, but are not limited to: (1) land use change; (2) a decrease in imported P as fertilisers and feed; (3) a change in P fertiliser form; (4) a decrease in soil Olsen P concentrations; (5) greater assimilation of P in soils; (6) greater assimilation of P in groundwaters and in-stream; (7) an increase in the use of P mitigations; (8) better awareness and education of rural professionals of P; and (9) the use of policy instruments. This paper is a review of the evidence for each factor. In this examination we note a couple of caveats. Firstly, owing to the unique nature of our farming systems and catchments, the majority of this evidence comes from New Zealand studies, but is augmented where applicable by international findings. Secondly, while the trends in P concentrations are spatially referenced to a catchment, unlike some other studies (Santos et al. Citation2017), the majority of available data is not. We were therefore unable to use complex statistical analyses to show why trends were occurring, but have provided a semi-quantitative estimate of the strength of each factor classified as: unlikely, possible but unclear, or probably causing a decrease FRP and TP concentrations across New Zealand streams and rivers.
Materials and methods
In our national study a large number of spatial and temporal databases were used. The coverage and limitations of these databases are outlined below. Given the format of the paper as a review, supported by semi-quantitative data, and the limitations of many of the databases, the majority of methods used either descriptive statistics or used spatially- or temporally-referenced correlations of log-transformed data (where appropriate) at the finest possible scale. Owing to the simplicity of these methods, we have not provided a lengthy, and likely repetitive, statement of how they were used to test each of the factors (1–9). Instead, we provide a brief summary here and when discussing each factor.
The datasets and associated methods used to examine the likely strength of each factor (1–9) are listed below.
(1) Land use change: data from a variety of datasets () was used to derive land cover, land use and stocking rates within each of the catchments. Flow-weighted trends in FRP and TP concentrations were extracted for the periods between 1994 and 2013 and 2004 to 2013 (Larned, Scarsbrook, et al. Citation2004; Ministry for the Environment and Statistics New Zealand Citation2017a). Trends were also extracted for clarity as a likely indicator of sediment and potentially particulate-P loss (Davies-Colley and Smith Citation2001; Ekholm and Krogerus Citation2003). Data for sediment or turbidity were not available. Coverage for land use and stocking rates was better for 2004–2013 than 1994–2003. To improve the reporting of land use data and avoid large areas where there were no data, the Land Cover Database was intersected with AgriBase, a national spatial database of more detailed land use (e.g. farm type, size, animal numbers, plated areas for orchards, crops, forestry, etc.). AgriBase data were used in the first instance, but reported as ‘high-producing exotic grassland’, as per the LCDB, where no data existed. A similar approach was used by Daigneault and Elliott (Citation2017) in correlating national scale water quality contaminant loads with land use. We had access to data from AgriBase for 1999, 2002, 2006 and 2013. Data were not available to exactly match the 1994–2003 and 2004–2013 years.
Table 1. Summary of the types, sources, temporal and spatial scales of biophysical data used in the study.
Data for the change in catchment areas (in ha and percentage changes) between 1999–2013 and 2006 and 2013 in different land uses (dairy, deer, forestry, native bush, and sheep and beef) were compared to the percentage magnitude change in significant FRP, TP and clarity trends in corresponding catchments using ArcGIS v10.6 and Pearson correlation coefficients via Genstat v17 (Genstat Committee Citation2015). Percentages were used to normalise data in place of absolute magnitude differences which were skewed. Significant trends for flow-weighted FRP, and TP concentrations were calculated as a significant increase or decrease in median FRP or TP concentration divided by the commensurate median FRP or TP concentration for a site. Analysis involved deriving correlations between trends for P concentrations and trends for land use changes (e.g. stock numbers and coverage) at a catchment scale.
(2) A decrease in imported P as fertilisers and feed: data were sourced for P fertiliser sales from Ballance Agri-Nutrients and Ravensdown fertiliser cooperatives at a regional level, and compared via Pearson correlation analysis to area-weighted trends in P concentrations. These companies together account for about 98% of fertiliser sales in New Zealand (Fertiliser Association of New Zealand Citation2018). Additional data for the quantity of P imported in animal feed was obtained from the DairyNZ Economics Group (Citation2016).
(3) A change in P fertiliser form: data were sourced from Ballance Agri-Nutrients and Ravensdown fertiliser cooperatives at a regional level for the sales of superphosphate and reactive phosphate rock (RPR) and compared via Pearson correlation analysis to area-weighted trends in P concentrations.
(4) A decrease in soil Olsen P concentrations: data were sourced from all the major commercial soil testing labs in New Zealand (). Data were linked to a region, and sometimes to the sub-region or catchment scale. However, for consistency, we assigned data from all sources to regions. Data were presented as a significant change in the slope of a regression between log-transformed Olsen P concentrations and time (year) by region and also as the percentage of sites exceeding an agronomic optimum for pasture production (Morton and Roberts Citation1999; Roberts and Morton Citation2009) in Sedimentary, Volcanic, Pumice and Peat soils (20, 35, 45 and 45 mg P L−1, respectively). Pastoral land is by far the dominant land use in New Zealand, covering approximately three-quarters of farm land (Statistics New Zealand Citation2018).
(5) Greater assimilation of P in soils: data for N fertiliser applied at a regional scale were sourced from the Agricultural Census for 2002 and 2012 (Statistics New Zealand Citation2018) and compared via Pearson correlation analysis to area-weighted trends in P concentrations.
(6) Greater assimilation of P in groundwaters and in-stream: data were sourced from the National Groundwater Monitoring Programme for 540 sites around the country. This dataset was initially compiled by Daughney and Reeves (Citation2006) and Daughney et al. (Citation2012), but subsequently updated to 2015 by the Ministry for the Environment and GNS Science. The analysis involved determining if there was a significant correlation (Pearson) between a trend in FRP concentrations in surface waters and the nearest groundwater sites within a 5 km radius.
(7) An increase in the use of P mitigations: data were sourced from the 2013–2017 surveys of Rural Decision Makers who canvassed 1500 (2013)–4500 (2017) farmers nationally (Manaaki Whenua: Landcare Research Citation2018), and the Clean Streams Dairy Accord and the Sustainable Dairying Water Accord to gauge the use of mitigations on dairy farms (Sanson and Baxter Citation2011; Dairy Environment Leadership Group Citation2013; Ministry for Primary Industries Citation2013; DairyNZ Citation2018). These data were compared via Pearson correlation analysis to area-weighted trends in P concentrations
(8) Better awareness and education of rural professionals: demographic data were sourced from Massey University’s professional development courses in nutrient management. These courses are required of all staff at Ballance Agri-Nutrients and Ravensdown fertiliser cooperatives, and are well attended by Regional Council staff and rural advisors. We compared the number of rural professionals to frequency of improving trends by region.
(9) An increased use of policy instruments: data were sourced from internet search engines, correspondence with the primary sector, and government agencies on the timing and geographic coverage of national and regional scale policy documents. A narrative is given of their likely impact assuming effective compliance by land owners and users to policy.
Results and discussion
Processes involved in P loss from land to water
The loss of P from land to streams and rivers is a function of the availability of P to loss, a transport pathway to get P to streams and rivers, and intervening attenuation processes along the transport pathway that may decrease P losses. All three processes can be influenced by landuse and land management practices. However, of the land available for primary production in New Zealand (52% of total area), three-quarters is used for grazed pastoral agriculture (Ministry for the Environment and Statistics New Zealand Citation2018). Hence, the following outline of processes focuses on pastoral agriculture, but soil- and fertiliser-P losses are also relevant to other land uses.
Sources of P loss from land to water include: the soil, fertiliser, plant residues and animal dung deposited directly or as farm dairy shed effluent (FDE) (Mundy et al. Citation2003; Curran-Cournane et al. Citation2011). As P surpluses increase, it is likely that soil P concentrations increase. Soil P-enrichment increases the availability of P to loss, especially in soils with low anion storage capacity (ASC) that have few Al- and Fe-oxides to sorb and retain P (McDowell and Condron Citation2004). The erosion of particulate-associated P can be enhanced by soil compaction and pugging following treading by grazing animals (Bilotta et al. Citation2007). Direct loss of P can also occur via animal dung (not urine) and fertiliser, although the availability of P in fertiliser is proportional to the fertiliser’s water solubility (Hart et al. Citation2004). Plant residues can be a source of P for a short time after forage is grazed by ruminants. The availability of P for loss by dung deposition decline exponentially with time as a crust forms on the dung, thus impairing interaction with rainfall (Smith et al. Citation2001).
Transport pathways include runoff, encapsulating surface runoff and subsurface flow (viz. interflow), and drainage to groundwater. For surface runoff, P losses can occur via infiltration-excess and saturation-excess mechanisms. Under infiltration-excess conditions, the infiltration capacity of the soil is exceeded resulting in surface runoff. In New Zealand, this usually occurs under high-intensity rainfall or hydrophobic soil conditions at any time of year (Bretherton et al. Citation2011; Müller et al. Citation2018), whereas saturation-excess surface runoff only occurs when soils are saturated (largely in winter and spring) resulting in any excess rainfall running-off. Due to the energy of high-intensity rainfall events, infiltration-excess surface runoff can contain more particulate-P than saturation-excess surface runoff (Buda et al. Citation2009). Due to topography, areas affected by saturation-excess surface runoff are generally located near the stream channel and expand and contract in response to rainfall events and evapotranspiration. Timing wise, most surface runoff and P loss occurs in large events in winter and spring due to saturation-excess surface runoff (Sharpley et al. Citation2008). However, losses at this time are less likely to cause algal growth (unless not flushed from the system) compared to losses in summer when low flows and higher temperatures facilitate growth.
Attenuation (i.e. removal) of P in surface runoff can occur along the flow path as heavy particulates settle-out, but can also occur when filtered out by plants, for example, at the point where runoff from an arable field intersects with a buffer strip. Note however that such filtration will not occur if the runoff originates in pasture where few coarse particles would be produced and likely filtered out by the sward before flow reaches the buffer strip (Thomas et al. Citation2018). The leaching of P through interflow and to groundwater is generally greatly attenuated by sorption and filtration in the vadose zone. An exception is P that is transported by artificial drainage. Here, macropores can provide a rapid conduit between surface P and streams via subsurface drains, although some filtration can occur resulting in a greater proportion of P being lost dissolved over particulate forms than likely in surface runoff (Monaghan et al. Citation2016). Another exception occurs where moderate amounts of P are applied to low P sorption capacity soils (measured as ASC) and leached by regular rainfall or irrigation. If draining into an aquifer of low ASC (e.g. sand and gravel), groundwater can become P-enriched and enriched baseflow in nearby streams (McDowell et al. Citation2015).
(1) Land use change
A wealth of literature indicates that the loss of P to water is correlated to the presence and magnitude of intensive land uses (Julian et al. Citation2017; Meyfroidt Citation2017). However, our data yielded few significant correlations between the percentage changes in either stock numbers or the area within a catchment of a stock class and the percentage change of FRP or TP trends (). This result doesn’t exclude the possibility that some sites may show a strong association with a change in stock numbers or the catchment percentage area occupied by a stock class, but does suggest that other factors such as climate, slope, land management (see the section ‘Process involved in P loss to water’) likely play a stronger role in influencing P concentrations.
Table 2. Mean percentage change (and standard deviation) in catchment stock numbers and area for different stock classes for the periods 1999–2013 and 2006–2013 and their respective comparison (Pearson correlation coefficient) to trends between 1994–2013 and 2004–2013 for either in the percentage change in median annual FRP or TP concentrations and clarity.
Some, weak, correlations were found between a decrease in sheep numbers and TP (1999–2013) or the area occupied by sheep and the percentage change in FRP concentrations. Interestingly, an increase in the area occupied by dairy was also weakly correlated to an increase in TP between 2006 and 2013 (). Due to their weak association it is difficult to draw substantive conclusions on the effect of land use change on P losses. However, as the P loss from sheep-farmed land is usually less than from dairy-farmed land (McDowell and Wilcock Citation2008), it is sensible that an increase in sheep numbers, at the expense of other stock classes, could result in a decrease in either FRP or TP if there is little carry-over (or legacy) or past land uses. Similarly, an increase in the area under dairying is expected to result in an increase in TP losses, especially since the number of dairy cattle increased more in the 2006–2013 period (3.9–4.9M = 143,000 cows p.a.) than over the 1999–2013 period (3.2–4.9M = 121,000 cows p.a.) (DairyNZ Citation2014). Indeed, using the National River Water Quality network of 77 large scale catchments Julian et al. (Citation2017) was able to show weak associations with changing nutrient concentrations and stock numbers, but found other factors such as soil type were equally important in many of the catchments.
Due to the variability of soil type and factors important in erosion processes (e.g. climate and slope), clarity cannot be used to accurately predict suspended sediment loads (Davies-Colley and Smith Citation2001), but can be helpful in isolating trends at a site where landforms and erosion processes don’t change, but management does. We isolated sites that showed decreases in FRP or TP concentrations and increases in clarity (). More sites, and a greater percentage of these sites, exhibited this phenomenon in 2004–2013 than from 1994 to 2013 (). The phenomenon was more frequent for FRP than TP (). This could reflect the fact that clarity is sensitive to the presence of fine particles, which have a greater affinity for sorbing P than coarse particles (Brennan et al. Citation2017). However, the geographic distribution of sites exhibiting this phenomenon also changed between 1994–2013 and 2003–2013. In general, the areas exhibiting the phenomenon over 1994–2013 were more likely to be associated with upland drystock or forestry than in 2004–2013 ().
Figure 1. Co-location of trends for decreasing FRP or TP and increasing clarity for 1994–2013 and 2004–2013 and land use in each catchment for 2013. Blank areas within a catchment are most likely to be native forest or mountains.
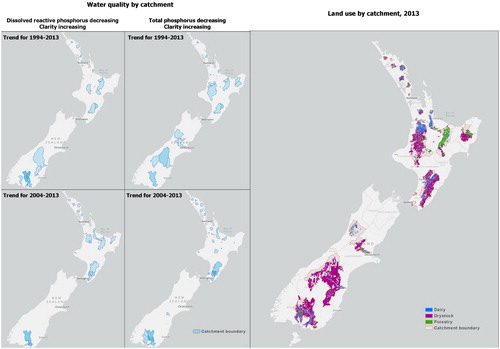
Table 3. Count of sites for the 1994–2013 and 2004–2013 periods showing an increasing or decreasing trend in FRP or TP concentrations, and the count of sites for the same periods exhibiting a decreasing trend in FRP or TP concentrations and increasing clarity at the same site. Sites showing indeterminate trends were not considered.
The incidence and increasing percentage of sites exhibiting improving trends in clarity and P concentrations would suggest that efforts to promote practices that prevent erosion may have also decreased P losses. Weak associations between changing P concentrations and changes in catchment land use suggest that a greater influence of P concentrations has been land practices, not the magnitude of land use change. Using ‘trees on farms’ (e.g. spaced – poplar planting) has been highly successful in preventing soil erosion on hill country sheep and beef farms (McIvor et al. Citation2011) without changing land use designation and will be discussed in Section 7. It is therefore possible, but unclear if changes in land use caused decreases in P concentrations.
(2) A decrease in imported P as fertilisers and feed
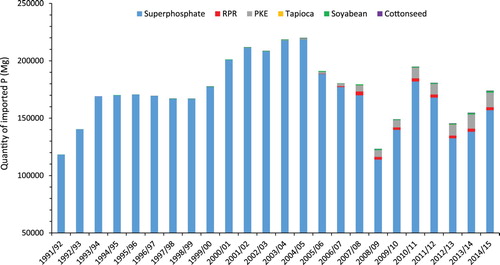
The potential for P loss parallels the magnitude of soil P enrichment (Heckrath et al. Citation1995). The enrichment and maintenance of soil P concentrations is achieved through the application of P (Roberts and Morton Citation2009). In grazed pastoral systems, most of this P comes from fertiliser with a small amount coming via the dung of animals eating imported feed; feed-P has increased since 2007 () due to the use of palm kernel extract on dairy farms (Robertson Citation2010; DairyNZ Economics Group Citation2016). The mean annual sales volumes of P (as superphosphate plus RPR) and of imported feed for the period 2004–2013 was on average 15% less than in the period 1995–2004. However, this difference was not significant (t-test, P > .05). It is therefore unlikely that a decrease in imported P contributed to decreases in in-stream P concentrations (). However, the power of our analysis could be improved if imported P data were available at a finer (e.g. catchment) scale.
Figure 2. Annual quantity (Mg) of imported P given as sales of superphosphate and RPR and imported feed (PKE = Palm Kernel Extract) using their average per cent P concentrations (DairyNZ Citation2018).
(3) A change in P fertiliser form
The contribution of fertiliser to total farm P losses from grazed pastoral agriculture is estimated to be around 10% if good practices are followed such as applying in summer when runoff is less likely (McDowell, Nash, et al. Citation2007). However, there is increasing evidence that this proportion is greater under normal practice, and can be up to 90% if poor practice is followed (Hart et al. Citation2004). Poor practice includes the application of soluble P just prior to flood irrigation or a rainfall event where runoff is expected. Under normal practice where P is applied in summer, fertiliser-P can be lost via short, intense storms that produce runoff via infiltration-excess processes which may be exacerbated by hydrophobicity (Doerr et al. Citation2003; Müller et al. Citation2018). In addition, where P is applied in high rainfall environments, where runoff cannot be avoided, fertiliser P losses can be 3–5 kg P ha−1 yr−1 (McDowell Citation2010).
The availability of P for loss is dependent on the water solubility of P applied. Soluble P, derived from superphosphate (90–97% water soluble), is available for loss in large amounts for around 7–14 days after application, and significantly greater than background concentrations for 60 days after application (McDowell et al. Citation2003). Serpentine superphosphate and dicalcic superphosphate contain around 10–15% water-soluble P. However, RPR only contains around 1–2% water-soluble P with its remaining P slowly solubilising into the soil solution over several years. This slow-release characteristic greatly reduces the availability of P from RPR, and to a lesser extend serpentine superphosphate and dicalcic superphosphate, to runoff events soon after application (McDowell and Catto Citation2005). Hart et al. (Citation2004) reviewed the literature and hypothesised that P losses would be lower from plots and farms with RPR applied than those with superphosphate applied due to a lower water solubility. Research at a catchment scale has subsequently showed that in two catchments receiving the same rate of P the RPR treated catchment lost on average 38% less FRP than the superphosphate treated catchment (McDowell et al. Citation2010). Although, applied in June, when the loss of P from P-applied would likely be greatest, this data suggested that the application of a lower water-soluble P product is effective at decreasing P losses.
Sales of RPR sit at between 1% and 2% of P sold in New Zealand. Similar levels of serpentine superphosphate are sold, although the data are unclear, while sales of dicalcic superphosphate are consistently <1% annually. Low sales may be due to poor recognition of its environmental benefit, associated with reduced P losses compared to superphosphate, but is more likely due to the unreliable availability of good quality RPR and climate and soil conditions that constrain its use. For RPR to maintain pasture production at the same rate as superphosphate rainfall should be >800 mm per year and soil pH < 6.0 (Sinclair et al. Citation1993). Furthermore, due to poor solubility transitioning from superphosphate requires RPR to be gradually introduced, replacing 33% of superphosphate in the first year, 66% of superphosphate in year 2 and all superphosphate from thereon in (Sinclair et al. Citation1990). Slow reactivity also means that RPR is also not suitable for capital applications of P (Sinclair et al. Citation1990). Low sales from 2004 to 2013 suggest a change to RPR is unlikely to be a reason for decreased P losses.
(4) Soil Olsen P concentrations have decreased
Soil Olsen P data from 2002 to 2014 (N ∼ 500,000 samples) were collected from Analytical Research Laboratories, Eurofins, Hill Laboratories, and the Soil Fertility Service (which ceased business in the mid-1990s). The potential for P loss increases with soil Olsen P concentrations, and where soil P sorption capacity is limited: capacity is inversely proportional to ASC (McDowell and Condron Citation2004). In the absence of ASC data, the ‘rule of thumb’ is that the potential for P losses increases markedly when Olsen P concentrations exceed their agronomic optimum (Morton et al. Citation2003). Using data from Eurofins, Hill Laboratories and the Soil Fertility Service, who recorded samples by their soil grouping as Volcanic, Pumice, Sedimentary and Peat, Wheeler et al. (Citation2004) showed that the proportion of sites in excess of the agronomic optimum (Olsen P) increased from 1988–1996 to 1997–2001. Data from 2002 to 2014 showed a decrease in the national proportion of samples in excess of the agronomic optimum for Volcanic and Pumice soils, but enrichment for Sedimentary and Peat soils (). However, additional regression analysis (also including the ARL data) showed a small increase in annual mean Olsen P concentrations for most regions from 2002 to 2014 (). This suggests that although there were fewer samples in excess of an agronomic optimum, there was a general increase in Olsen P concentrations both above and below the agronomic optimum. Olsen P concentrations have not decreased and is therefore unlikely to be a cause of declining P concentrations in-stream.
Figure 3. The relative percentage of samples in excess of the agronomic optimum in Olsen P concentration for pasture production (20, 35, 45 and 45 mg P L−1 for Sedimentary, Volcanic, Pumice and Peat soils, respectively) submitted to Eurofins and Hills laboratories (n ∼ 500,000) between 1988–1996, 1997–2001 and 2002–2014. Data for 1988–1996 and 1997–2001 is from Wheeler et al. (Citation2004).
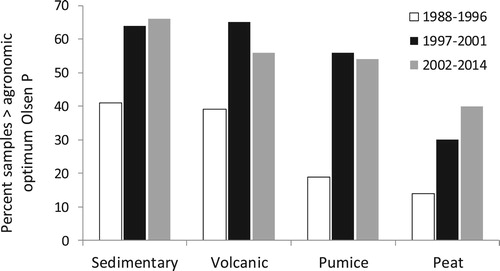
Table 4. Trends in topsoil Olsen P concentrations (mg L−1) between 2002 and 2014 and submitted to ARL, Eurofins and Hill Laboratories.
(5) The greater assimilation of P in soils and aquifers
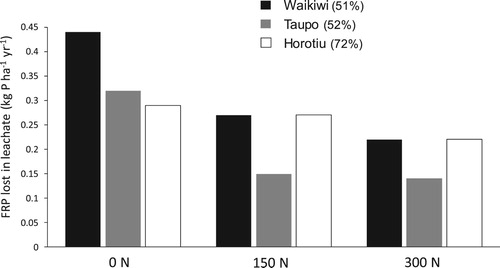
The addition of N fertiliser to soils boosts pasture yield, requiring more P which the plant obtains from the soil (Haynes and Williams Citation1993). As the soil solution is the conduit through which P must be sequestered, reduced concentrations of P in the soil solution also results in lower leaching losses. In a two-year trial on three intact pasture soils of varying ASC, Dodd et al. (Citation2014) found that the application of 150–300 kg N ha−1 yr−1 resulted in a decrease in annual FRP load in leachate by 53–76% in two soils of moderate ASC (51–53%) compared to a control receiving no N (). No decrease was found in the higher ASC soil (72%), whose greater sorption led to more P in the solid phase and less leached.
Figure 4. Mean annual load of FRP lost in leachate from the top 30-cm of three pasture soils of varying ASC (51–72%) receiving either no N or 150 or 300 kg N ha−1 yr−1 as urea (Dodd et al. Citation2014).
Agricultural censuses data for the regional use of N fertiliser in 2002 and 2012 are given in . Although the proportional mass of N fertiliser applied has increased, especially in some regions, the growth in use doesn’t correlate well with the frequency of decreasing trends in P concentrations (). For example, some regions like Canterbury exhibited a strong increase in N applied (93%) and had a large number of sites showing decreases in FRP (31) or TP (22), but Auckland also had many sites showing decreases in FRP (17) or TP (19), but N applied decreased. It is therefore possible but unclear if an increase in N sales contributed to decreases in P concentrations.
Table 5. Data for the regional tonnage of N fertiliser applied in New Zealand in 2002 and the percentage change in tonnes applied by 2012.
(6) The greater assimilation of P in aquifers and in-stream
Nitrate (NO3) is widely recognised as a powerful oxidant (Galloway et al. Citation2003). Increasing loads of NO3 can therefore drive a shift in the redox status of soils, aquifer and river sediments. Greater and more sustained NO3 loading could lower FRP concentrations in groundwater and in-streams via two key mechanisms, buffering and oxidation. Some evidence shows that greater NO3 loads can buffer (viz. limit) the microbially-mediated reductive dissolution of the oxides/oxy hydroxides of Mn and Fe in anaerobic sediments thereby maintaining their P sorption capacity (Surridge et al. Citation2007). In addition, as a strong oxidant, greater NO3 loadings can increase the direct oxidation of ferrous (FeII) to P-sorbing ferric (FeIII) iron in aquifers (Uhlmann and Paul Citation1994).
shows the relative percentage of increasing and decreasing trends for NO3 and FRP, respectively for streams and rivers, and in groundwater – taken in this instance as an important contributor of flow and P to streamflow. Increasing concentrations in groundwater or streams and rivers was only mirrored by a decrease in FRP concentrations at 1% and 4% of sites, respectively. It is possible that NO3 concentrations in groundwater or streams and rivers were insufficient to decrease FRP concentrations due to poor connectivity to NO3-rich topsoils. However, the scarcity of sites does not support the hypothesis that the enrichment of NO3 concentrations in groundwaters or streams and rivers increased the removal of FRP via sorption to Fe and Mn oxides.
Table 6. The relative percentage of sites exhibiting increasing trends in nitrate (NO3), decreasing trends in FRP and their co-location in streams and rivers or groundwater for data for 2004–2013.
In addition to influencing chemical processes, NO3 is also a stimulant of periphyton growth (Dodds and Smith Citation2016). The frequency of periphyton outbreaks and biomass has been increasing in New Zealand streams and rivers (Snelder et al. Citation2013), and have paralleled an increase of NO3 losses to streams and rivers over the last 20 years (Ministry for the Environment and Statistics New Zealand Citation2017a). This could increase the demand for P by periphyton. An increased demand would be seen as a decrease in FRP, which is more bioavailable than particulate and organic P forms (Ekholm and Krogerus Citation2003). However, research has shown that during the growing season and under period of stable flow, periphyton growth in New Zealand streams and rivers is more often limited by P than by N (Larned, Nikora, et al. Citation2004; McDowell et al. Citation2009). Moreover, the data in did not support the hypothesis that increasing trends in NO3 were responsible for decreased FRP concentrations in streams and rivers. However, this hypothesis should not be discounted as concentrations and trends in nutrient concentrations could also be masked by whether or not periphyton are actively growing and taking up N or P or are sourcing P from sediments (Wood et al. Citation2015).
(7) An increase in the number and use of P mitigations
shows when strategies to mitigate P losses from New Zealand enterprises, and their cost-effectiveness, were published. The majority of these strategies were developed and assessed in 2000–2010. General advice on these strategies is that a user should only consider those strategies that are applicable to their enterprise, implement the most cost-effective first, and use them in critical source areas to improve cost-effectiveness (Bailey et al. Citation2013; Gooday et al. Citation2014; McDowell Citation2014; Vinten et al. Citation2017). Critical source areas are small areas of a farm or catchment that account for disproportionately large amounts of contaminant (e.g. P) losses because they are hydrologically active and are P-rich. Modelling showed that across 14 New Zealand catchments applying strategies to critical source areas improved the cost-effectiveness of mitigations by 6–7 times compared to an untargeted blanket application (McDowell Citation2014).
Table 7. Range of strategies used in management, as an amendment or at the edge of the field to decrease P losses to water, their effectiveness, cost and citation noting the year that their cost-effectiveness was assessed.
The use of these strategies is also influenced by co-benefits. For example, if only focusing on cost-effectiveness, in field management strategies would be conducted before those that rely on mopping up P once it has been lost from the system (e.g. amendments or edge of field strategies). However, strategies such as wetlands are often advocated because they have co-benefits such as decreasing sediment or N losses from the farm and improving biodiversity. Co-benefits have been taken into account in voluntary approaches to implementing strategies such as the Dairying Clean Streams accord and Sustainable Dairying Accord, and proposed regulation such as the mandatory fencing of large streams (Ministry for Primary Industries Citation2017).
Data for the implementation of the Dairy Clean Streams Accord recorded the uptake of practices such as the: fencing-off of permanent streams (wider than 1 m and deeper than 30 cm), installation of bridges as stock crossings, development of a nutrient budget, and use of good FDE practices preventing ponding and runoff of effluent. The first year of the Accord was 2003. Farmers’ self-reported implementation of fencing, stock crossings, nutrient budgets and improved effluent practices in 2003 were 54, 92, 17, and due to inconsistent reporting – 0% of farms, respectively across New Zealand (Ministry of Agriculture and Forestry Citation2005). By 2007 this was 78%, 98%, 98% and 64%, respectively, and 87%, 99%, 99% and 73%, respectively by 2012 (Ministry for Primary Industries Citation2013). Subsequent auditing of self-reported data indicated that the quantity and quality of implementation was lower than reported, but that differences in quality when averaged across a region (or nationally) would not likely influence trends over time (Sanson and Baxter Citation2011). Furthermore, independent statistics from the Regional Authorities showed that the percentage of dairy farms complying with region-specific effluent rules increased, while the percentage of significant non-compliance decreased (). Independent surveys of 4500 farmers across New Zealand also found an increase in the use of fencing between 2013 and 2017 with 82% and 92% of respondents now indicating that small (one to three order streams; Strahler classification) and large (fourth order and higher) streams were fenced, respectively (Manaaki Whenua: Landcare Research Citation2018).
Table 8. The percentage by region of dairy farms in full compliance (after comma = significant non-compliance) with effluent regulations at the beginning (2003/2004), middle (2007/2008) and end (2011/2012) of the Clean Streams Accord.
Once implemented there is often a lag time before strategies or decreases associated with a change in land use (e.g. factor 1) to become fully effective. Furthermore, the phasing in or inconsistent implementation of strategies across different farms often means that it is difficult to establish what strategy worked at a catchment level. Inconsistencies can be alleviated by planning at a farm and catchment level to place and time the implementation of cost-effective strategies. Several catchment studies have provided advice and recorded the effect of implementing farm-scale strategies at the catchment scale. For instance, for three predominantly dairy-farmed catchments in Taranaki (Waiokura), South Canterbury (Waikakahi) and the West Coast (Inchbonnie), mean P concentrations decreased over a 10-year period by about 15%, 30% and 60%, respectively. In the Waiokura this decrease was attributed to less P fertiliser use (to lower enriched soil Olsen P concentrations) and the use of fencing and good FDE practice (Wilcock, Monaghan, Quinn, et al. Citation2013). In the Waikakahi the decrease was attributed to decreasing soil Olsen P concentrations and improved irrigation practices (Monaghan et al. Citation2009). In the Inchbonnie catchment this was attributed to better effluent practices and the use of lower amounts and less soluble P fertilisers (Wilcock, Monaghan, McDowel, et al. Citation2013; Wilcock, Monaghan, Quinn, et al. Citation2013). The Inchbonnie case was also supported by a change in policy (see factor 9).
At a large catchment to regional scale, evidence is emerging of the efficacy of sustained efforts to implement strategies. For instance, Snelder (Citation2018) found a weak but significant positive associations between decreasing suspended sediment concentrations, or greater clarity, and the proportion of catchment area involved in the sustainable land use initiative (SLUI) that developed and implemented farm plans across the Manawatu-Wanganui region (Horizons Regional Council). The decrease in sediment load and increase in water clarity is entirely consistent with the predictions in the efficacy of the implementation of farm plans within the Manawatu catchment (Dymond et al. Citation2010). A healthy 14–17-year-old poplar will protect 8.4 m2 of ground from slip and or gully erosion (Hawley and Dymond Citation1988) and similar results occurred with space-planted eucalypts and willows (Douglas et al. Citation2013). Dymond et al. (Citation2010) used these and other similar observations to build sediment yield models for farms prior to and after implementing a farm plan. Each plan involved a range of targeted conservation tree plantings including production forest, space-planted poplars to control landslides and large gully erosion, and willows on streambanks to control bank erosion. Dymond et al. (Citation2010) predicted the mean sediment discharge of the Manawatu River would reduce from 3.1 to 1.6 million tonnes per when the soil conservation plantings reached maturity on 500 farms. Horizons Regional Council have recently announced that ‘SLUI has completed 683 Farm Plans, with 14 million trees planted covering 500,000 hectares and over 570,000 metres of waterways fenced off’ (http://www.horizons.govt.nz/news/improved-water-quality-in-horizons-region-shows-mo). Overall stream and river sediment loads are expected to decrease and cause a concurrent reduction the total particulate-P load carried by the river. However, the P concentration of sediment carried by a river may not decrease by the same amount because the SLUI farm plans focus the farmers’ attention on developing the soil fertility on lower slope (<25°) class land (rolling and easy hill) to maintain or increase farm productivity. In addition, the slow movement of sediment through a catchment and the dissolution of P from sediment can delay observable improvements in P concentrations (Rogers et al. Citation2012; Rickson Citation2014; Zafar et al. Citation2017).
These intensively monitored catchments together with data from self-reported surveys, independent auditing or self-reporting and national surveys suggest that more strategies are being used and is a probable cause of decreasing stream P concentrations.
(8) Better awareness and education of rural professionals
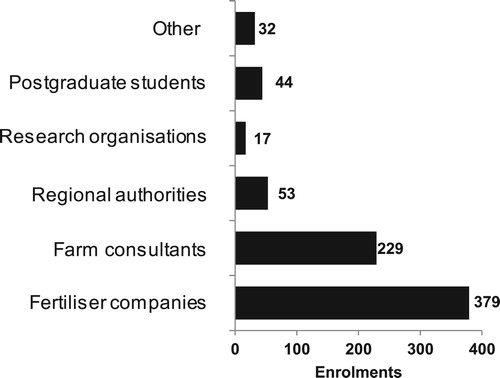
In 2002, the Fertilizer and Lime Research Centre at Massey University was sponsored by NZ Fertiliser Manufacturers’ Research Association to develop a course in Sustainable Nutrient Management in New Zealand Agriculture. The course, which also provides an introduction to nutrient budgeting using the nutrient budgeting software – Overseer (AgResearch Citation2016), was targeted at rural professionals: fertiliser company field officers, farm consultants and regional council officers. Each year since, between 100 and 180 students have taken this course. In 2005 an Advanced Course in Sustainable Nutrient Management was also added to train students how to undertake farm scenario simulation in Overseer in order to develop farm environment plans. At the end of 2018, 2093 students will have taken the first course () and 856 the advanced course ().
Figure 5. The employment characteristics of the 2093 rural professionals who will have completed a Sustainable Nutrient Management course in New Zealand Agriculture.
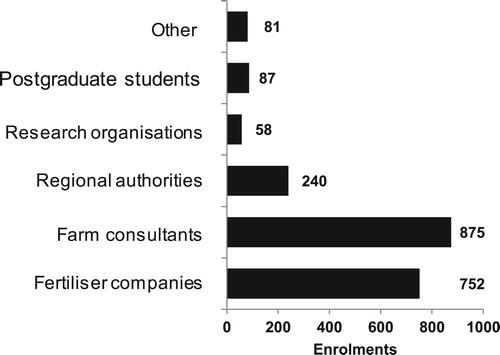
Figure 6. The employment characteristics of the 856 rural professionals who will have completed an Advanced Sustainable Nutrient Management course.
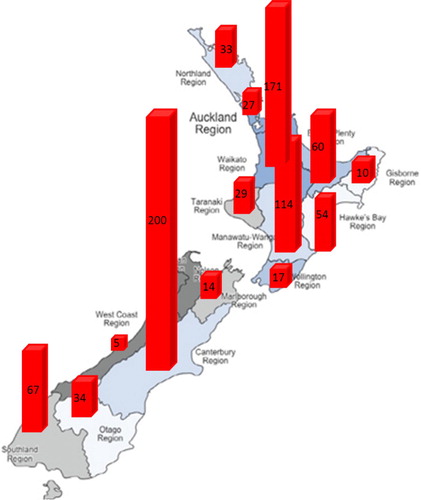
Among the 856 rural professionals completing the Advanced Sustainable Nutrient Management course the majority of those were from Canterbury, Waikato, and Manawatu-Wanganui regions (). This reflects the size and magnitude of primary production in these regions. Although these courses were not available prior to 2002, it is possible but unclear if the number of ‘trained’ rural professionals has caused stream and river P concentrations to decrease. However, we can say that there is both greater awareness and capability across New Zealand to create and refresh farm environmental plans, which are seen as a key mechanism in improving the awareness and action required to decrease P losses amongst primary producers. Farm plans are now required by many Regional Authorities (see factor 9) (Beef and Lamb New Zealand Citation2019).
Figure 7. The origin of the 856 rural professionals who will have completed an Advanced Sustainable Nutrient Management course.
(9) The use of policy instruments
The National Policy Statement on Freshwater Management (NPS-FM) was gazetted in 2011, and amended in 2014 and 2017 (Ministry for the Environment Citation2011, Citation2014, Citation2017). It prescribes the minimum standards and some of the steps that Regional Councils have to take to manage water quality. Standards relating specifically to the management of P were added in 2014 and 2017: lakes have numerical targets, while the management of periphyton biomass in streams and rivers requires instream P concentrations to be set.
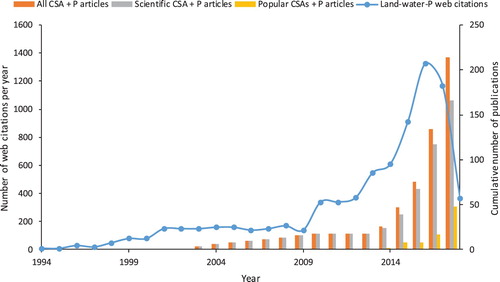
Prior to the NPS-FM, industry and regional authorities had recognised the role that P plays in water quality and embarked on a mix of voluntary and regulatory approaches to mitigate P loss from land to water. Evidence for this recognition can be seen in the number of New Zealand policy and industry guideline documents recognising P loss from land to water as an issue and identifying the loss of P via critical source areas. As of April 2018, critical source areas were mentioned in 75 policy regulations and industry guideline documents, but not mentioned in documents prior to 2007. This increase is a reflection of a greater awareness of P loss from land on water quality (see factor 8), the maturity of the critical source area concept, and the realisation that targeting mitigation strategies to critical source areas in farm plans improves the cost-effectiveness of mitigations (Liu et al. Citation2017; Vinten et al. Citation2017) ().
Figure 8. Number of web citations per year and the cumulative number of articles (popular and from scientific journals) on critical source areas (CSAs) and land–water–P interactions over time. Of the 159 scientific documents produced (as of April 2018), 47 were academic papers, 75 were from policy (central or regional), 30 were from industry, while 14 were from non-governmental organisations (Source = Google analytics).
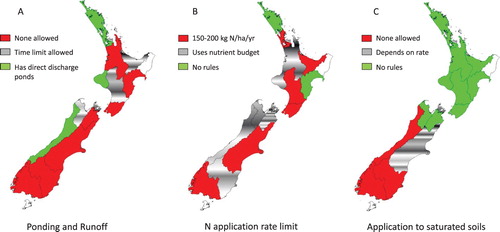
In Australia and New Zealand the time to peak adoption of practices has been measured at between 6 and 22 years: 16.5 years, on average (Botha et al. Citation2015; Kuehne et al. Citation2017). Together with catchment processes, the inconsistent implementation of practices means that there is often a lag time to water quality outcomes (Meals et al. Citation2010; Meter and Basu Citation2017). The newness of national policy direction in New Zealand such as the NPS-FM and the lead in time allowed for its implementation,Footnote1 infers that few changes will have yet occurred to manage P concentrations in streams and rivers as a result of this instrument. However, some national guidelines were introduced long ago and have been far reaching, while instances also exist of the early targeting of national guidelines and regional policy. For instance, both guidelines and policy around FDE has been in place in the early 2000s in most regions (McDowell et al. Citation2017) (). These will influence new dairy farms from their date of conversion. Since 1994, the code of practice for the spreading of fertiliser in New Zealand has advised that a buffer zone be left between the application area and waterways and wetlands (Fertiliser Quality Council Citation2018). Regional policy imposed by the West Coast Regional Council for Lake Brunner in 2010 has restricted the amount and form of P fertiliser and prohibited direct discharge or runoff of FDE (West Coast Regional Council Citation2010a, Citation2010b). Such policy has the advantage over industry guidelines that compliance ensures that practices are implemented at a faster rate and more consistently across a catchment (Wang et al. Citation2012; Kuehne et al. Citation2017). Data has shown a significant decline in TP concentrations since 2010 (West Coast Regional Council Citation2017). In Taranaki, Bedford (Citation2017) concluded that a sustained effort to fence 7000 km of waterways in the region since 2000 has helped to significantly decrease median FRP concentrations. The geographic spread and reach of these actions suggest that the increase in policy and guidelines has probably had an effect on decreasing P concentrations.
Figure 9. The management of farm dairy effluent by Regional Authorities in New Zealand to decrease N and, by inference, P losses. Management focuses on restricting effluent application to soils to prevent ponding and runoff year-round (A: none, refers to no ponding or runoff allowed at any time; time limit, allows for some ponding and runoff; and direct discharge refers to discharges from effluent settling ponds directly to streams), limiting applications over the year to not exceed a N rate for the effluent block (B: <150–200 kg N ha−1 yr−1 via direct measurement of the effluent or a nutrient budget), and restricting applications to saturated soils in winter (C: applications are either not allowed, allowed if below a certain rate, or unrestricted). Figure modified from McDowell et al. (Citation2017).
Conclusions
A semi-quantitative analysis isolated the following causes as unlikely to have caused a decrease in FRP and TP concentrations between 2004 and 2013:
a decrease in imported P as fertilisers and feed;
a change to low water-soluble P fertilisers such as RPR;
a decrease in soil Olsen P concentrations; and
the greater assimilation of FRP in groundwater and streams and rivers due to greater NO3 loading.
Although the data were unclear, possible causes of a decrease in P concentrations were:
land use change resulting in lower erosion and less P applied to sloping land;
the greater assimilation of P in New Zealand soils – associated with more use of N fertilisers; and
the better awareness of P as an environmental issue were possible.
Probable causes of decreasing P concentrations were:
the greater use of strategies to mitigate P loss from land and water;
the use of guidelines to direct the use of strategies; and
policy instruments that require better water quality outcomes and, as a result, lower P losses from land to water.
These data support an emphasis on the development and implementation of strategies to mitigate P losses, supported by a mix of voluntary guidelines and regulation to ensure water quality outcomes result. However, improvements in the strength of these findings could be achieved if the analysis was fully quantitative. This analysis would require additional data and privacy issues to be overcome to allow data to be referenced to the same spatial and temporal scales.
Acknowledgements
We are grateful Dr Ants Roberts (Ravensdown cooperative) who reviewed an early version of this manuscript and for the co-operation and data provided by commercial companies, co-operatives, industry good entities, and regional and central government.
Disclosure statement
No potential conflict of interest was reported by the authors.
Additional information
Funding
Notes
1 Regional authorities have until 31 December 2025 to implement the NPS-FM, but an authority may extend the date to 31 December 2030 if it considers that meeting the earlier date would result in lower quality planning; or it would be impracticable for it to complete the implementation of NPS-FM by that date.
References
- AgResearch. 2016. OVERSEER® nutrient budgets version 6.2.2. Hamilton: AgResearch – Fertiliser Association of New Zealand – Ministry for Primary Industries.
- Álvarez X, Valero E, Santos RMB, Varandas SGP, Sanches Fernandes LF, Pacheco FAL. 2017. Anthropogenic nutrients and eutrophication in multiple land use watersheds: best management practices and policies for the protection of water resources. Land Use Policy. 69:1–11. doi: 10.1016/j.landusepol.2017.08.028
- Bailey A, Deasy C, Quinton J, Silgram M, Jackson B, Stevens C. 2013. Determining the cost of in-field mitigation options to reduce sediment and phosphorus loss. Land Use Policy. 30(1):234–242. doi: 10.1016/j.landusepol.2012.03.027
- Ballantine DJ, Tanner CC. 2010. Substrate and filter materials to enhance phosphorus removal in constructed wetlands treating diffuse farm runoff: a review. New Zealand Journal of Agricultural Research. 53(1):71–95. doi: 10.1080/00288231003685843
- Barlow K, Nash D, Grayson RB. 2005. Phosphorus export at the paddock, farm-section, and whole farm scale on an irrigated dairy farm in south-eastern Australia. Australian Journal of Agricultural Research. 56(1):1–9. doi: 10.1071/AR04166
- Bedford G. 2017. Transforming the stream banks of Taranaki, New Zealand: voluntary regional-scale stream enhancement. In: Kovar K, Fraters D, editors. Land use and water quality 2017; June 2017; den Haag, The Netherlands. p. 32.
- Beef and Lamb New Zealand. 2019. Environment plans. Wellington: Beef and Lamb New Zealand; [accessed 2019 Jan 14]. https://beeflambnz.com/compliance/environment/environment-plans.
- Bilotta GS, Brazier RE, Haygarth PM. 2007. The impacts of grazing animals on the quality of soils, vegetation, and surface waters in intensively managed grasslands. In: Donald LS, editor. Advances in agronomy. Academic Press; p. 237–280.
- Botha N, Turner JA, Sinclair S, Brazendale R, Dirks S, Blackett P, Lambert G. 2015. Assessing the economic impact of a co-innovation approach: the case of dairy heifer rearing in New Zealand. ImpAR Conference 2015 impacts of agricultural research – towards an approach of societal; Nov 3–4; Pairs, France. p. 1–15.
- Brennan RB, Scott JT, Sharpley AN, Lally HT, Jarvie HP, Bowes MJ, Haggard BE, Gbur E. 2017. Linking soil erosion to instream dissolved phosphorus cycling and periphyton growth. Journal of the American Water Resources Association. 53(4):809–821. doi: 10.1111/1752-1688.12534
- Bretherton M, Horne DJ, Scotter DR, Hedley MJ. 2011. Water uptake by hill country pasture – more than you think. In: Currie LD, Christensen CL, editors. Adding to the knowledge base for the nutrient manager; Feb 2011; Massey University, Palmerston North, New Zealand.
- Buda AR, Kleinman PJ, Srinivasan MS, Bryant RB, Feyereisen GW. 2009. Effects of hydrology and field management on phosphorus transport in surface runoff. Journal of Environment Quality. 38(6):2273–2284. doi: 10.2134/jeq2008.0501
- Carpenter SR, Caraco NF, Correll DL, Howarth RW, Sharpley AN, Smith VH. 1998. Nonpoint pollution of surface waters with phosphorus and nitrogen. Ecological Applications. 8(3):559–568. doi: 10.1890/1051-0761(1998)008[0559:NPOSWW]2.0.CO;2
- Craggs R, Park J, Heubeck S, Sutherland D. 2014. High rate algal pond systems for low-energy wastewater treatment, nutrient recovery and energy production. New Zealand Journal of Botany. 52(1):60–73. doi: 10.1080/0028825X.2013.861855
- Curran-Cournane F, McDowell R, Littlejohn R, Condron L. 2011. Effects of cattle, sheep and deer grazing on soil physical quality and losses of phosphorus and suspended sediment losses in surface runoff. Agriculture, Ecosystems & Environment. 140(1-2):264–272. doi: 10.1016/j.agee.2010.12.013
- Daigneault A, Elliott AH. 2017. Land-use contaminant loads and mitigaiton costs. Wellington: Motu Economic and Public Policy.
- Dairy Environment Leadership Group. 2013. Sustainable dairying: water accord. A commitment to New Zealand by the dairy sector. Hamilton: DairyNZ.
- DairyNZ. 2014. New Zealand dairy Statistics 2013–14. Hamilton: LIC and DairyNZ.
- DairyNZ. 2018. Nutrition. Hamilton: DairyNZ.
- DairyNZ Economics Group. 2016. A review of feed volumes consumed by New Zealand dairy cows since 1990–91, including future estimates to 2030-31. Wellington: Ministry for Primary Industries.
- Daughney C, Raiber M, Moreau-Fournier M, Morgenstern U, van der Raaij R. 2012. Use of hierarchical cluster analysis to assess the representativeness of a baseline groundwater quality monitoring network: comparison of New Zealand’s national and regional groundwater monitoring programs. Hydrogeology Journal. 20(1):185–200. doi: 10.1007/s10040-011-0786-2
- Daughney CJ, Reeves RR. 2006. Analysis of temporal trends in New Zealand’s groundwater quality based on data from the national groundwater monitoring programme. Journal of Hydrology (New Zealand). 45(1):41–62.
- Davies-Colley RJ, Smith DG. 2001. Turbidity, suspended sediment, and water clarity: a review. Journal of the American Water Resources Association. 37(5):1085–1101. doi: 10.1111/j.1752-1688.2001.tb03624.x
- Dodd RJ, McDowell RW, Condron LM. 2014. Manipulation of fertiliser regimes in phosphorus enriched soils can reduce phosphorus loss to leachate through an increase in pasture and microbial biomass production. Agriculture, Ecosystems & Environment. 185:65–76. doi: 10.1016/j.agee.2013.12.018
- Dodds WK, Smith VH. 2016. Nitrogen, phosphorus, and eutrophication in streams. Inland Waters. 6(2):155–164. doi: 10.5268/IW-6.2.909
- Doerr SH, Ferreira AJD, Walsh RPD, Shakesby RA, Leighton-Boyce G, Coelho COA. 2003. Soil water repellency as a potential parameter in rainfall-runoff modelling: experimental evidence at point to catchment scales from Portugal. Hydrological Processes. 17(2):363–377. doi: 10.1002/hyp.1129
- Douglas GB, Mcivor IR, Manderson AK, Koolaard JP, Todd M, Braaksma S, Gray RAJ. 2013. Reducing shallow landslide occurrence in pastoral hill country using wide-spaced trees. Land Degradation & Development. 24(2):103–114. doi: 10.1002/ldr.1106
- Dymond JR, Betts HD, Schierlitz CS. 2010. An erosion model for evaluating regional land-use scenarios. Environmental Modelling & Software. 25(3):289–298. doi: 10.1016/j.envsoft.2009.09.011
- Ekholm P, Krogerus K. 2003. Determining algal-available phosphorus of differing origin: routine phosphorus analyses versus algal assays. Hydrobiologia. 492(1-3):29–42. doi: 10.1023/A:1024857626784
- Fertiliser Association of New Zealand. 2018. About the Fertiliser Association of New Zealand. Wellington: Fertiliser Association of New Zealand; [accessed 2018 Sep]. http://www.fertiliser.org.nz/Site/about/.
- Fertiliser Quality Council. 2018. Code of practice for the placement of fertiliser in New Zealand. Wellington: Fertiliser Quality Council.
- Galloway JN, Aber JD, Erisman JW, Seitzinger SP, Howarth RW, Cowling EB, Cosby BJ. 2003. The nitrogen Cascade. Bioscience. 53(4):341–356. doi: 10.1641/0006-3568(2003)053[0341:TNC]2.0.CO;2
- Genstat Committee. 2015. Genstat v17.0. Hemel Hempstead: VSNI.
- Gooday RD, Anthony SG, Chadwick DR, Newell-Price P, Harris D, Duethmann D, Fish R, Collins AL, Winter M. 2014. Modelling the cost-effectiveness of mitigation methods for multiple pollutants at farm scale. Science of The Total Environment. 468–469:1198–1209. doi: 10.1016/j.scitotenv.2013.04.078
- Hart MR, Quin BF, Nguyen ML. 2004. Phosphorus runoff from agricultural land and direct fertilizer effects. Journal of Environment Quality. 33(6):1954–1972. doi: 10.2134/jeq2004.1954
- Hawley JG, Dymond JR. 1988. How much do trees reduce landsliding? Journal of Soil and Water Conservation. 43(6):495–498.
- Haynes RJ, Williams PH. 1993. Nutrient cycling and soil fertility in the grazed pasture ecosystem. Advances in Agronomy. 49:119–199. doi: 10.1016/S0065-2113(08)60794-4
- Heckrath G, Brookes PC, Poulton PR, Goulding KWT. 1995. Phosphorus leaching from soils containing different phosphorus concentrations in the broadbalk experiment. Journal of Environment Quality. 24(5):904–910. doi: 10.2134/jeq1995.00472425002400050018x
- Hille S, Graeber D, Kronvang B, Rubæk GH, Onnen N, Molina-Navarro E, Baattrup-Pedersen A, Heckrath GJ, Stutter MI. 2018. Management Options to reduce phosphorus leaching from vegetated buffer strips. Journal of Environmental Quality.
- Houlbrooke D, Carey P, Williams R. 2008. Management practices to minimise wipe-off losses from border-dyke irrigated land. In: Currie LD, Yates LJ, editors. Carbon and nutrient management in agriculture; Feb 2008; Palmerston North, New Zealand.
- Houlbrooke DJ, Horne DJ, Hedley MJ, Hanly JA, Snow VO. 2004. A review of literature on the land treatment of farm-dairy effluent in New Zealand and its impact on water quality. New Zealand Journal of Agricultural Research. 47(4):499–511. doi: 10.1080/00288233.2004.9513617
- Hughes AO, Tanner CC, McKergow LA, Sukias JPS. 2016. Unrestricted dairy cattle grazing of a pastoral headwater wetland and its effect on water quality. Agricultural Water Management. 165:72–81. doi: 10.1016/j.agwat.2015.11.015
- Hughey KFD, Kerr GN, Cullen R. 2016. Public perceptions of New Zealand’s environment: 2016. Lincoln: Lincoln University.
- Julian JP, de Beurs KM, Owsley B, Davies-Colley RJ, Ausseil AGE. 2017. River water quality changes in New Zealand over 26 years: response to land use intensity. Hydrology and Earth System Sciences. 21(2):1149–1171. doi: 10.5194/hess-21-1149-2017
- Kuehne G, Llewellyn R, Pannell DJ, Wilkinson R, Dolling P, Ouzman J, Ewing M. 2017. Predicting farmer uptake of new agricultural practices: a tool for research, extension and policy. Agricultural Systems. 156:115–125. doi: 10.1016/j.agsy.2017.06.007
- Landcare Research. 2017. NZ land cover database. Lincoln: Landcare Research: Manaaki Whenua; [accessed 2018 Apr 11]. http://www.lcdb.scinfo.org.nz/home.
- Larned ST, Nikora VI, Biggs BJF. 2004. Mass-transfer-limited nitrogen and phosphorus uptake by stream periphyton: a conceptual model and experimental evidence. Limnology and Oceanography. 49(6):1992–2000. doi: 10.4319/lo.2004.49.6.1992
- Larned ST, Scarsbrook MR, Snelder TH, Norton NJ, Biggs BJF. 2004. Water quality in low-elevation streams and rivers of New Zealand: recent state and trends in contrasting land-cover classes. New Zealand Journal of Marine and Freshwater Research. 38(2):347–366. doi: 10.1080/00288330.2004.9517243
- Larned ST, Snelder T, Unwin MJ, McBride GB. 2016. Water quality in New Zealand rivers: current state and trends. New Zealand Journal of Marine and Freshwater Research. 50(3):389–417. doi: 10.1080/00288330.2016.1150309
- Liu Y, Engel BA, Flanagan DC, Gitau MW, McMillan SK, Chaubey I. 2017. A review on effectiveness of best management practices in improving hydrology and water quality: needs and opportunities. Science of The Total Environment. 601-602:580–593. doi: 10.1016/j.scitotenv.2017.05.212
- Manaaki Whenua: Landcare Research. 2018. Summary of results: rural decision makers survey 2017. Lincoln: Manaaki Whenua: Landcare Research; [accessed 2018 Sep]. https://www.landcareresearch.co.nz/__data/assets/pdf_file/0008/165977/SRDM2017-infographic.pdf.
- McDowell RW. 2008. Water quality of a stream recently fenced-off from deer. New Zealand Journal of Agricultural Research. 51(3):291–298. doi: 10.1080/00288230809510460
- McDowell RW. 2010. Evaluation of two management options to improve the water quality of Lake Brunner, New Zealand. New Zealand Journal of Agricultural Research. 53(1):59–69. doi: 10.1080/00288231003606351
- McDowell RW. 2014. Estimating the mitigation of anthropogenic loss of phosphorus in New Zealand grassland catchments. Science of The Total Environment. 468-469:1178–1186. doi: 10.1016/j.scitotenv.2013.03.056
- McDowell RW, Catto W. 2005. Alternative fertilisers and management to decrease incidental phosphorus loss. Environmental Chemistry Letters. 2(4):169–174. doi: 10.1007/s10311-005-0099-6
- McDowell RW, Condron LM. 2004. Estimating phosphorus loss from New Zealand grassland soils. New Zealand Journal of Agricultural Research. 47(2):137–145. doi: 10.1080/00288233.2004.9513581
- McDowell RW, Cosgrove GP, Orchiston T, Chrystal J. 2014. A cost-effective management practice to decrease phosphorus loss from dairy farms. Journal of Environment Quality. 43(6):2044–2052. doi: 10.2134/jeq2014.05.0214
- McDowell RW, Cox N, Daughney CJ, Wheeler D, Moreau M. 2015. A national assessment of the potential linkage between soil, and surface and groundwater concentrations of phosphorus. Journal of the American Water Resources Association. 51(4):992–1002. doi: 10.1111/1752-1688.12337
- McDowell RW, Dils RM, Collins AL, Flahive KA, Sharpley AN, Quinn J. 2016. A review of the policies and implementation of practices to decrease water quality impairment by phosphorus in New Zealand, the UK, and the US. Nutrient Cycling in Agroecosystems. 104(3):289–305. doi: 10.1007/s10705-015-9727-0
- McDowell RW, Drewry JJ, Muirhead RW, Paton RJ. 2005. Restricting the grazing time of cattle to decrease phosphorus, sediment and E. coli losses in overland flow from cropland. Soil Research. 43(1):61–66. doi: 10.1071/SR04041
- McDowell RW, Hawke M, McIntosh JJ. 2007. Assessment of a technique to remove phosphorus from streamflow. New Zealand Journal of Agricultural Research. 50(4):503–510. doi: 10.1080/00288230709510318
- McDowell RW, Houlbrooke DJ. 2009. Management options to decrease phosphorus and sediment losses from irrigated cropland grazed by cattle and sheep. Soil Use and Management. 25(3):224–233. doi: 10.1111/j.1475-2743.2009.00231.x
- McDowell RW, Larned ST, Houlbrooke DJ. 2009. Nitrogen and phosphorus in New Zealand streams and rivers: control and impact of eutrophication and the influence of land management. New Zealand Journal of Marine and Freshwater Research. 43(4):985–995. doi: 10.1080/00288330909510055
- McDowell RW, Littlejohn RP, Blennerhassett JD. 2010. Phosphorus fertilizer form affects phosphorus loss to waterways: a paired catchment study. Soil Use and Management. 26(3):365–373. doi: 10.1111/j.1475-2743.2010.00289.x
- McDowell RW, Monaghan RM, Carey PL. 2003. Potential phosphorus losses in overland flow from pastoral soils receiving long-term applications of either superphosphate or reactive phosphate rock. New Zealand Journal of Agricultural Research. 46(4):329–337. doi: 10.1080/00288233.2003.9513561
- McDowell RW, Monaghan RM, Dougherty WJ, Gourley CJP, Vibart R, Shepherd M. 2017. Balancing water-quality threats from nutrients and production in Australian and New Zealand dairy farms under low profit margins. Animal Production Science. 57:1419–1430. doi: 10.1071/AN16646
- McDowell RW, Nash DM, Robertson F. 2007. Sources of phosphorus lost from a grazed pasture receiving simulated rainfall. Journal of Environment Quality. 36(5):1281–1288. doi: 10.2134/jeq2006.0347
- McDowell RW, Norris M. 2014. The use of alum to decrease phosphorus losses in runoff from grassland soils. Journal of Environment Quality. 43(5):1635–1643. doi: 10.2134/jeq2013.12.0479
- McDowell RW, Sharpley AN, Bourke W. 2008. Treatment of drainage water with industrial by-products to prevent phosphorus loss from tile-drained land. Journal of Environment Quality. 37(4):1575–1582. doi: 10.2134/jeq2007.0454
- McDowell RW, Wilcock RJ. 2008. Water quality and the effects of different pastoral animals. New Zealand Veterinary Journal. 56(6):289–296. doi: 10.1080/00480169.2008.36849
- McDowell RW, Wilcock RJ, Hamilton D. 2013. Assessment of strategies to mitigate the impact or loss of Contaminants from agricultural land to Fresh waters. Wellington: Ministry for the Environment.
- McIvor IR, Douglas GB, Dymond J, Eyles G, Marden M. 2011. Pastoral hill slope erosion in New Zealand and the role of poplar and willow trees in its reduction. In: Godone D, Silva S, editors. Soil erosion in agriculture. Palmerston North: InTech – Open Access; p. 257–278.
- McKergow LA, Tanner CC, Monaghan RM, Anderson G. 2007. Stocktake of diffuse pollution attenuation tools for New Zealand pastoral farming systems. Hamilton: NIWA.
- Meals DW, Dressing SA, Davenport TE. 2010. Lag time in water quality response to best management practices: a review. Journal of Environment Quality. 39(1):85–96. doi: 10.2134/jeq2009.0108
- Meter KJV, Basu NB. 2017. Time lags in watershed-scale nutrient transport: an exploration of dominant controls. Environmental Research Letters. 12(8):084017. doi: 10.1088/1748-9326/aa7bf4
- Meyfroidt P. 2017. Trade-offs between environment and livelihoods: bridging the global land use and food security discussions. Global Food Security. 16:9–16. doi: 10.1016/j.gfs.2017.08.001
- Ministry for Primary Industries. 2013. The dairying and clean streams accord: Snapshot of progress 2011/2012. Wellington: Ministry for Primary Industries.
- Ministry for Primary Industries. 2017. Draft regulatory impact statement: stock exclusion. Wellington: Ministry for Primary Industries.
- Ministry for the Environment. 2011. National policy statement for freshwater management 2011. Wellington: Ministry for the Environment; [accessed 2016 Sep 13]. http://www.mfe.govt.nz/sites/default/files/media/Fresh%20water/nps-freshwater-mgnt-2011_0.pdf.
- Ministry for the Environment. 2014. National policy statement for freshwater management 2014. Wellington: Ministry for the Environment; [accessed 2016 Sep 13]. http://www.mfe.govt.nz/sites/default/files/media/Fresh%20water/nps-freshwater-management-jul-14.pdf.
- Ministry for the Environment. 2017. National policy statement for freshwater management 2014: updated August 2017 to incorporate amendments from the national policy statement for freshwater amendment order 2017. Wellington: Ministry for the Environment; [accessed 2018 Sep 13]. http://www.mfe.govt.nz/sites/default/files/media/Fresh%20water/nps-freshwater-ameneded-2017_0.pdf.
- Ministry for the Environment and Statistics New Zealand. 2017a. Our fresh water 2017: data to 2016. Wellington: Minstry for the Environment and Statistics New Zealand.
- Ministry for the Environment and Statistics New Zealand. 2017b. River water quality: phosphorus. Wellington: StatsNZ; [accessed 2018 Sep]. http://archive.stats.govt.nz/browse_for_stats/environment/environmental-reporting-series/environmental-indicators/Home/Fresh%20water/river-water-quality-phosphorus.aspx.
- Ministry for the Environment and Statistics New Zealand. 2018. New Zealand’s environmental reporting series: our land 2018. Wellington: Ministry for the Environment, Stats NZ.
- Ministry of Agriculture and Forestry. 2005. Dairying and the clean sreams accord: snapshot of progress 2004/2005. Wellington: Ministry of Agriculture and Forestry; [accessed 2018 Sep]. http://archive.li/3tpTH.
- Monaghan RM, Carey PL, Wilcock RJ, Drewry JJ, Houlbrooke DJ, Quinn JM, Thorrold BS. 2009. Linkages between land management activities and stream water quality in a border dyke-irrigated pastoral catchment. Agriculture, Ecosystems & Environment. 129(1–3):201–211. doi: 10.1016/j.agee.2008.08.017
- Monaghan RM, Houlbrooke DJ, Smith LC. 2010. The use of low-rate sprinkler application systems for applying farm dairy effluent to land to reduce contaminant transfers. New Zealand Journal of Agricultural Research. 53(4):389–402. doi: 10.1080/00288233.2010.505943
- Monaghan RM, Laurenson S, Dalley DE, Orchiston TS. 2017. Grazing strategies for reducing contaminant losses to water from forage crop fields grazed by cattle during winter. New Zealand Journal of Agricultural Research. 60(3):333–348. doi: 10.1080/00288233.2017.1345763
- Monaghan RM, Smith LC, Muirhead RW. 2016. Pathways of contaminant transfers to water from an artificially-drained soil under intensive grazing by dairy cows. Agriculture, Ecosystems & Environment. 220:76–88. doi: 10.1016/j.agee.2015.12.024
- Morgenstern U, Daughney CJ. 2012. Groundwater age for identification of baseline groundwater quality and impacts of land-use intensification – the national groundwater monitoring programme of New Zealand. Journal of Hydrology. 456–457:79–93. doi: 10.1016/j.jhydrol.2012.06.010
- Morton JD, McDowell RW, Monaghan RM, Roberts AHC. 2003. Balancing phosphorus requirements for milk production and water quality. Proceedings of the New Zealand Grassland Association. 65:111–115.
- Morton JD, Roberts AHC. 1999. Fertiliser use on New Zealand sheep and beef farms. Auckland: New Zealand Fertiliser Manufacturers’ Research Association.
- Müller K, Mason K, Strozzi AG, Simpson R, Komatsu T, Kawamoto K, Clothier B. 2018. Runoff and nutrient loss from a water-repellent soil. Geoderma. 322:28–37. doi: 10.1016/j.geoderma.2018.02.019
- Mundy GN, Nexhip KJ, Austin NR, Collins MD. 2003. The influence of cutting and grazing on phosphorus and nitrogen in irrigation runoff from perennial pasture. Soil Research. 41(4):675–685. doi: 10.1071/SR02087
- Olarieta JR, Besga G, Rodríguez R, Usón C A, Pinto M, Virgel S. 1999. Sediment enrichment ratios after mechanical site preparation for Pinus radiata plantation in the Basque country. Geoderma. 93(3–4):255–267. doi: 10.1016/S0016-7061(99)00063-4
- Rickson RJ. 2014. Can control of soil erosion mitigate water pollution by sediments? Science of The Total Environment. 468–469:1187–1197. doi: 10.1016/j.scitotenv.2013.05.057
- Roberts AHC, Morton JD. 2009. Fertiliser use on New Zealand dairy farms. Auckland: New Zealand Fertiliser Manufacturers’ Research Association.
- Robertson M. 2010. Agricultural productivity in Australia and New Zealand: trends, constraints and opportunities. Proceedings of the New Zealand Grassland Association. 72:LI–LXII.
- Rogers CW, Sharpley AN, Haggard BE, Scott JT. 2012. Phosphorus uptake and release from submerged sediments in a Simulated stream channel Inundated with a poultry litter source. Water, Air, & Soil Pollution. 224(1):1361. doi: 10.1007/s11270-012-1361-8
- Sanson R. 2005. The AgribaseTM farm location database. Proceedings of the New Zealand Society of Animal Production. 65:93–96.
- Sanson R, Baxter W. 2011. Stock exclusion survey. Wellington: Minstry of Agriculture and Forestry.
- Santos RMB, Sanches Fernandes LF, Cortes RMV, Varandas SGP, Jesus JJB, Pacheco FAL. 2017. Integrative assessment of river damming impacts on aquatic fauna in a Portuguese reservoir. Science of The Total Environment. 601–602:1108–1118. doi: 10.1016/j.scitotenv.2017.05.255
- Sharpley AN, Kleinman PJA, Heathwaite AL, Gburek WJ, Folmar GJ, Schmidt JP. 2008. Phosphorus loss from an agricultural watershed as a function of storm size. Journal of Environment Quality. 37(2):362–368. doi: 10.2134/jeq2007.0366
- Sinclair AG, Dyson CB, Shannon PW. 1990. The long-term effectiveness of reactive phosphate rock as a phosphate fertiliser for New Zealand pastures. Proceedings of the New Zealand Grassland Association. 51:101–104.
- Sinclair AG, Johnstone PD, Smith LC, Risk WH, O’Connor MB, Roberts AH, Morton JD, Nguyen L, Shannon PW. 1993. Effect of reactive phosphate rock on the pH of soil under pasture. New Zealand Journal of Agricultural Research. 36(3):381–384. doi: 10.1080/00288233.1993.10417736
- Smith KA, Jackson DR, Withers PJA. 2001. Nutrient losses by surface run-off following the application of organic manures to arable land. 2. Phosphorus. Environmental Pollution. 112:53–60. doi: 10.1016/S0269-7491(00)00098-1
- Snelder T, Biggs B, Kilroy C, Booker D. 2013. National objective Framework for periphyton. Wellington: National Institute for Water and Atmospheric Research.
- Snelder TH. 2018. Assessment of recent reductions in E. coli and sediment in rivers of the Manawatū-Whanganui region. Christchurch: Land, Water, People.
- Snelder TH, McDowell RW, Fraser C. 2017. Estimation of catchment nutrient loads in New Zealand using monthly water quality monitoring data. Journal of the American Water Resources Association. 53:158–178. doi: 10.1111/1752-1688.12492
- Statistics New Zealand. 2018. Agriculture, horticulture, and forestry. Wellington: Statistics New Zealand; [accessed 2018 Oct 8]. http://archive.stats.govt.nz/browse_for_stats/industry_sectors/agriculture-horticulture-forestry.aspx.
- Sukias JPS, Tanner CC, Davies-Colley RJ, Nagels JW, Wolters R. 2010. Algal abundance, organic matter, and physico-chemical characteristics of dairy farm facultative ponds: implications for treatment performance. New Zealand Journal of Agricultural Research. 44(4):279–296. doi: 10.1080/00288233.2001.9513485
- Surridge BWJ, Heathwaite AL, Baird AJ. 2007. The release of phosphorus to porewater and surface water from river Riparian sediments. Journal of Environment Quality. 36(5):1534–1544. doi: 10.2134/jeq2006.0490
- Thomas DT, Moore AD, Bell LW, Webb NP. 2018. Ground cover, erosion risk and production implications of targeted management practices in Australian mixed farming systems: lessons from the grain and graze program. Agricultural Systems. 162:123–135. doi: 10.1016/j.agsy.2018.02.001
- Uhlmann D, Paul L. 1994. Causes and effects of ‘nitrate saturation’ in phosphate-deficient water bodies. Water Science and Technology. 30(10):281–288. doi: 10.2166/wst.1994.0538
- Vinten A, Sample J, Ibiyemi A, Abdul-Salam Y, Stutter M. 2017. A tool for cost-effectiveness analysis of field scale sediment-bound phosphorus mitigation measures and application to analysis of spatial and temporal targeting in the Lunan water catchment, Scotland. Science of The Total Environment. 586:631–641. doi: 10.1016/j.scitotenv.2017.02.034
- Vlahos S, Summers KJ, Bell DT, Gilkes RJ. 1989. Reducing phosphorus leaching from sandy soils with red mud bauxite processing residues. Australian Journal of Soil Research. 27(4):651–662. doi: 10.1071/SR9890651
- Vymazal J. 2007. Removal of nutrients in various types of constructed wetlands. Science of The Total Environment. 380(1–3):48–65. doi: 10.1016/j.scitotenv.2006.09.014
- Wang J, Chen Y, Shao X, Zhang Y, Cao Y. 2012. Land-use changes and policy dimension driving forces in China: present, trend and future. Land Use Policy. 29(4):737–749. doi: 10.1016/j.landusepol.2011.11.010
- West Coast Regional Council. 2010a. RMA section 32 report on the proposed Lake Brunner catchment objectives, policies, and rules – September 2010. Graymouth: West Coast Regional Council.
- West Coast Regional Council. 2010b. Schedule 1A: 18.5 discharges to land. Greymouth: West Coast Regional Council.
- West Coast Regional Council. 2017. Lake Brunner water quality update: December 2017. Greymouth, New Zealand.
- Wheeler DM, Sparling GP, Roberts AHC. 2004. Trends in some soil test data over a 14-year period in New Zealand. New Zealand Journal of Agricultural Research. 47(2):155–166. doi: 10.1080/00288233.2004.9513583
- Wilcock RJ. 1986. Agricultural run-off: a source of water pollution in New Zealand? New Zealand Agricultural Science. 20:98–103.
- Wilcock RJ, Monaghan RM, McDowell RW, Verburg P, Horrox J, Chagué-Goff C, Duncan MJ, Rutherford A, Zemansky G, Scarsbrook MR, et al. 2013. Managing pollutant inputs from pastoral dairy farming to maintain water quality of a lake in a high-rainfall catchment. Marine and Freshwater Research. 64(5):447. doi: 10.1071/MF12296
- Wilcock RJ, Monaghan RM, Quinn JM, Srinivasan MS, Houlbrooke DJ, Duncan MJ, Wright-Stow AE, Scarsbrook MR. 2013. Trends in water quality of five dairy farming streams in response to adoption of best practice and benefits of long-term monitoring at the catchment scale. Marine and Freshwater Research. 64(5):401–412. doi: 10.1071/MF12155
- Wood SA, Depree C, Brown L, McAllister T, Hawes I. 2015. Entrapped sediments as a source of phosphorus in epilithic cyanobacterial proliferations in low nutrient rivers. PLoS One. 10(10):e0141063. doi: 10.1371/journal.pone.0141063
- Woodward SJR, Stenger R, Hill RB. 2016. Flow Stratification of river water quality data to elucidate nutrient transfer pathways in mesoscale catchments. Transactions of the ASABE. 59(2):545–551. doi: 10.13031/trans.59.11145
- Zafar M, Tiecher T, Capoane V, Troian A, dos Santos DR. 2017. Characteristics, liability and distribution of phosphorus in suspended sediment from a subtropical catchment under diverse anthropic pressure in Southern Brazil. Ecological Engineering. 100:28–45. doi: 10.1016/j.ecoleng.2016.12.008