
 ?Mathematical formulae have been encoded as MathML and are displayed in this HTML version using MathJax in order to improve their display. Uncheck the box to turn MathJax off. This feature requires Javascript. Click on a formula to zoom.
ABSTRACT
All-ceramic dental restorations are now regularly being used in clinical situations. Forces applied to ceramic dental restorations can result in failure due to cracking. Dental restorations may be subjected to significant loads in the mouth and small contact points between opposing teeth may result in markedly high stress when a high bite force is encountered. This study recorded maximum voluntary bite forces on the posterior teeth of 40 participants and inter-occlusal contact points were identified by digitally scanning the teeth and calculating the surface area by accompanying software. Bite forces from as low as 83.9 Newton (N) to the highest at 1642.8 N, with a mean of 430.4 N (sd = 279.4) were recorded. Inter-occlusal contact points as small as 0.065 mm2 were measured. The resultant stress teeth may experience has been shown to potentially exceed the flexural strength of even the strongest dental ceramic available on the market for 21.8% of the teeth tested. This study aimed to describe the stresses that teeth experience, and thus predict the stresses that future restorations on those teeth may experience. This approach may prove valuable in guiding clinicians in their material selection as well as the design of all-ceramic restorations.
Background
Numerous advancements in computer-aided design and manufacturing technologies for all-ceramic dental restorations have been made in recent decades, such as the development of intra-oral scanners, more intuitive software and improvements on marginal and internal fit of restorations. These advancements also lead to the increasing adoption of chairside systems (Spitznagel et al. Citation2018), furthering the increase in the use of ceramics in restorative dentistry. All-ceramic dental restorations are now regularly being used in clinical situations where metal and metal-supported dental restorations were once the only clinically acceptable options.
Ceramic materials are inherently brittle, and this has (and continues to be) their major drawback. Forces applied to ceramic dental restorations can result in failure due to cracking. A number of studies have investigated the physical properties of ceramic restoratives and reported the fracture loads of the tested materials, with the ranking of different ceramic materials (Kim et al. Citation2012; Shahrbaf et al. Citation2014; Sun et al. Citation2014; Baladhandayutham et al. Citation2015). Unfortunately, comparative rankings of materials are often dependent on the testing protocol that was followed (Anusavice et al. Citation2007), and studies do not take an in vivo or holistic approach to explain the failure of materials. Furthermore, strength values of materials are often reported as flexural strength expressed in Mega Pascal (MPa) by manufacturers, while researchers often test fracture strength, also commonly referred to as load strength, expressed in Newton (N). This makes an evaluation of materials to inform a treatment choice problematic as manufacturers tend to emphasise the data that supports their product and this may lead to conflicting material choices for clinical applications.
Some reports state a wide range of values of fracture strength of dental ceramic materials, most of which range well above 1000 N, with some up to 5000 N (Leevailoj et al. Citation1998; Anusavice Citation2013; Johansson et al. Citation2014; Baladhandayutham et al. Citation2015; Zhang et al. Citation2016). The highest flexural strength of all dental ceramics falls in the range of 900–1200 MPa, exhibited by Zirconia (Anusavice Citation2013; Teja and Teja Citation2015). These values exceed commonly encountered average maximum bite force loads of up to 600 N, suggesting that they should not fracture during normal service (Bakke Citation2006; Hattori et al. Citation2009; Varga et al. Citation2011). On the other hand, other studies report that the incidence of fracture of all-ceramic restorations is high (Wang et al. Citation2012; Pjetursson et al. Citation2015). Furthermore, fracture patterns induced by contact damage at loading points in laboratory tests are not necessarily comparable with those of restorations that failed in clinical use (Kelly et al. Citation1995; Scherrer et al. Citation2006; Aboushelib et al. Citation2009; Zhang et al. Citation2016).
Dental restorations may be subjected to significant loads in the mouth, particularly due to clenching forces (Bakke Citation2006; Hattori et al. Citation2009; Varga et al. Citation2011), and small contact points between two opposing teeth may dramatically increase the stress a restoration undergoes when a maximum bite force is encountered. This may be one of the reasons for the disparity between all-ceramic restoration strength values and clinical survival rates. Furthermore, testing protocols for material testing do not always follow the same methodology.
This study aimed to investigate bite forces in relation to contact points between opposing teeth, in order to describe the stresses that these teeth experience, and thus predict the stresses that future restorations on those teeth may experience. Stress, (force per surface area) as expressed in MPa, more closely relates to what materials experience in vivo and better relates to flexural strength, also expressed in MPa. This approach may prove valuable in guiding clinicians in their material selection as well as the design of all-ceramic restorations.
Methods
Bite force transducer
For the purpose of this study, it was important to measure bite forces between opposing teeth. We were not attempting to measure forces applied across the whole dental arch, or bite forces in any direction other than a straight down clench. Keeping the average buccal-lingual posterior tooth width of 10 mm in mind, the transducer must be narrow enough to record the bite force between two opposing tooth surfaces. Commonly used strain gauge transducers are typically too wide to be able to measure the loads generated between single opposing teeth (Paphangkorakit and Osborn Citation1997; Isaza et al. Citation2009; Lappin and Jones Citation2014; Shushma and Kantly Citation2016). These typical wide dimensions ensure that the construction material used, will provide enough rigidity to withstand the range of applied loads it will be subjected to. However, a typical open-ended tuning fork-style transducer with a width of 10 mm, would have to be very thick in order to prevent the ends from touching during flexure or plastic deformation at high loads. Thickness of the transducer has an influence on the recorded forces, as some studies indicated that inter-occlusal distance/jaw separation has an influence on bite force and mastication (Bakke et al. Citation1989, Citation1990; Hattori et al. Citation2009; Cabral Citation2017). Average recorded bite forces seem to increase with increasing jaw separation, reaching a plateau between 14 and 28 mm (Bakke et al. Citation1990; Bakke Citation2006; Hattori et al. Citation2009). Therefore, the dimensions of the assembled transducer needed to be compact in order to accurately record commonly generated maximum bite forces. For this study, these issues were addressed by developing a novel strain gauge transducer consisting of two heat-treated martensitic stainless steel plates with the terminal ends supported in a bridge configuration. The heat-treated steel ensured a high elastic modulus which made it possible to keep the transducer thin, while being able to withstand large bite forces without plastic deformation and keeping the elastic deformation within the limits of the strain gauges. This permitted the transducer to have central bridging plates with an ideal width-to-thickness ratio, allowing the plates to bend in the middle according to the requirements of the strain gauges whilst keeping the width at 10 mm and the total thickness at 10 mm in the bite recording zone ().
Figure 1. Bite force transducer in calibration jig on the universal testing machine.
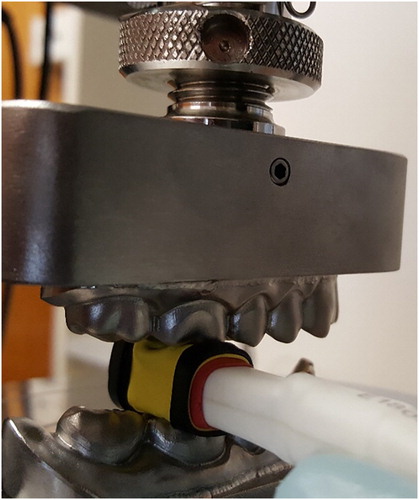
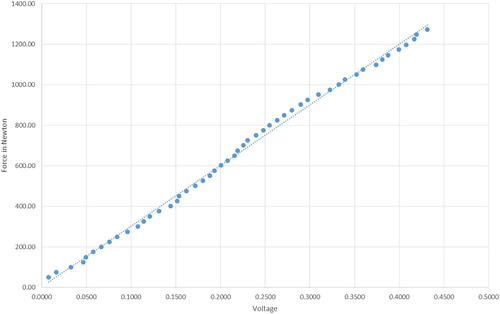
The most efficient form of load cell transducer is a bridge configuration, where all four legs of the bridge are active resistance sensors. In our configuration, each sensor was a resistance-matched strain-dependent thin film resistor of 120 ohms (RS part no. 632-180, Mfr. Part no. N11MA512023). The sensors were fixed to the parallel metal bars in such a way that a deformation of the device caused by biting would lead to expansion of the upper sensor of the bridge and compression of the lower sensor of the top beam. This would cause simultaneous compression of the upper sensor and expansion of the lower sensor on the bottom beam. This ensured maximum imbalance of the bridge with maximum voltage differential at the two mid-points of the bridge. The change in resistance of the strain gauges (expressed as a change in voltage) is proportional to the amount of their distortion. The transducer voltage output was calibrated with verified loads on an Instron® Model 3369™ universal testing machine. The Newton and voltage values obtained from calibration were used to create a linear regression formula with an R-square value of 0.9967 to convert the voltage output from the transducer to a Newton reading ().
Figure 2. Calibration conversion of transducer voltage output to Newton value.
Bite force measurements of natural teeth
Before commencement of participant recruitment, ethical approval for this study was obtained from the University of Otago Human Ethics committee (Ethics number H16/109).
For the measurement of Maximum Voluntary Bite Forces (MVBF) on natural teeth, 20 male and 20 female participants were recruited in Dunedin, New Zealand. Inclusion criteria required participants between the ages of 20–60 years, in overall good general and with good oral health. Participants had to have complete or partial permanent dentitions with natural, unrestored, opposing and occluding posterior teeth and have not undergone recent orthodontic treatment. Upon recruitment, participants were evaluated to verify that they did not have any craniofacial anomalies, malocclusions or systemic muscle or joint disorders.
The dentition of each participant was visually examined by a registered dentist. Teeth were not dried and radiographs were not taken. Teeth with restorations, caries, or other evidence of pathology were noted and were excluded from bite force testing, in order to minimise the risk of damage to a compromised tooth.
The MVBF of participants were measured on all posterior teeth by placing the bite force transducer between two opposing teeth and asking the participant to bite down with the maximum force that they feel comfortable with. The transducer outputs were recorded and converted to a Newton load value. The transducer was protected from contamination by using a nitrile rubber sheath, removed and replaced between each participant.
Inter-occlusal contact area measurement
Each participant’s teeth were scanned using a 3Shape TRIOS® scanner. The TRIOS® scanner had been shown to be one of the most accurate scanners available at the time these measurements were taken (Nedelcu et al. Citation2018). Scan data were processed using the TRIOS® system and exported to the accompanying OrthoAnalyzer™ software for analysis. The contact points between opposing teeth were identified and highlighted using the calibrated measurement tools available within OrthoAnalyzer™. The software allowed for the contact area surfaces to be marked with repeated shapes drawn inside the boundaries of the contact areas. These tessellations were then used to calculate the individual surface area of each contact as well as the combined total surface area of all occlusal contacts on each tooth.
Stress on teeth
Stress values in this project were calculated by using the standard formula of: where
is the stress, F is the force in Newton and A is the unit area in mm2, and expressed as MPa. The total contact area on a tooth was calculated as the sum of all the contact areas on that tooth. The smallest single contact area was also individually recorded.
Statistical methods
Descriptive and analytic analyses were conducted in Stata 15.1 Special Edition (Stata Corporation, College Station, TX, USA, 2003) with the level of statistical significance was set at p < .05. Measurement of bite forces were conducted by tooth, so to account for this in statistical analysis where individual participants had multiple teeth measured, multilevel mixed-effects generalised linear modelling was used to model continuous measures of stress while population-averaged binomial generalised estimating equation modelling was used to investigate the risk of encountering high bite stress (defined as ≥1200 MPa), controlling for sex, tooth position, age, number of contacts by tooth, and side of the mouth.
Results
Bite forces
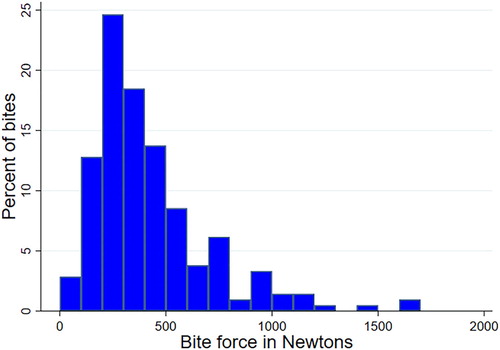
Two hundred and eleven MVBF recordings were made in total. Of these, 58 recordings from first premolars, 70 from second premolars, 67 from first molars and 16 from second molars. Bite forces from as low as 83.9 Newton (N) to the highest at 1642.8 N, with a mean of 430.4 N (sd = 279.4) were recorded. The distribution of MVBF measurements taken shows that the bite forces measured were more evenly distributed under 500 N with a much smaller percentage recorded in the higher Newton values ().
Figure 3. Maximum voluntary bite force distribution amongst all the recordings.
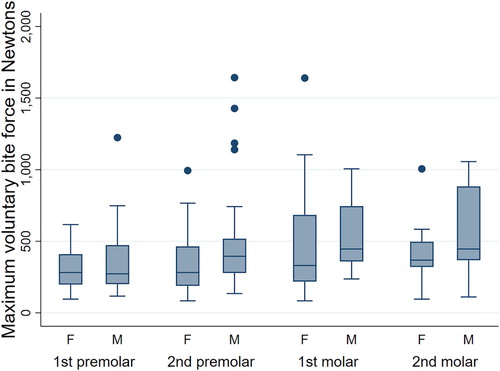
Higher MVBF values were recorded from male participants (mean 469.9, sd = 28.40) than female MVBF values (mean 384.5, sd = 25.3). Over both sexes, the molar region had higher MVBF values (493.4, sd = 32.5) than the premolar region (mean 383.3, sd = 22.8) ().
Figure 4. Maximum voluntary bite force across sex and tooth position.
Inter-occlusal contact area
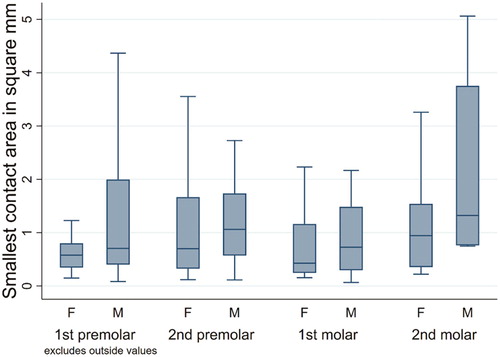
Total inter-occlusal contact areas on all teeth were measured in mm2. Total combined contact areas were significantly larger on molar (mean 6.4, sd 5.8) than premolar teeth (mean 3.5, sd 2.8), as expected (). Small single contact areas were often observed on the molar teeth, but this was not significantly different to the smaller contact areas observed on premolar teeth. A gradient was observed where total contact areas on molar and premolar teeth were larger among males than females, but these differences were not statistically significant ().
Figure 5. Total inter-occlusal contact area across sex and tooth position.
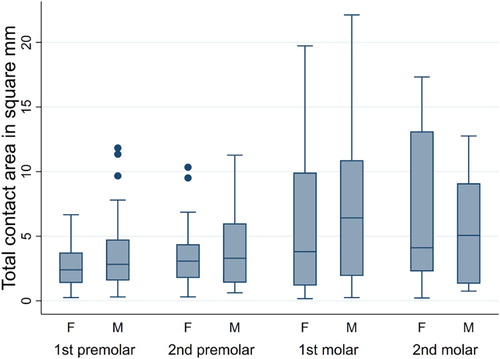
Figure 6. Smallest inter-occlusal contact area across sex and tooth position.
Stress
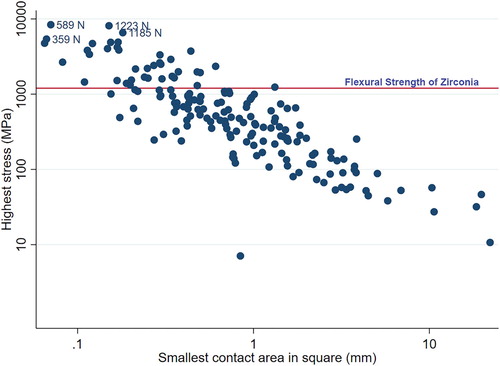
The stress values of 174 teeth were determined. Of these, 21.8% will potentially experience high stresses, above 1200 MPa, higher than the flexural strength of the strongest restorative ceramic material currently available ().
Figure 7. Stress distribution across contact area and maximum voluntary bite force indicating stress values in relation to the strongest available dental ceramic material flexural strength.
Teeth on the right-hand side of the mouth had over twice the odds of encountering a bite stress above 1200 MPa (). The count of contact points between opposing teeth was also associated with this scenario while sex, tooth position, and age were not significantly associated ().
Table 1. Odds of encountering a stress value of 1200+ MPa by person-level and tooth characteristics.
Discussion
The motion direction during a clench is dynamic and different for each person. This means that the true magnitude of a clench may differ from the vertical dimension recorded in this study. Attempts to record the true three-dimensional bite force has been made by Osborn and Mao (Citation1993) and Paphangkorakit and Osborn (Citation1997). Measuring bite forces in more dimensions may be a useful addition to electromyography to describe muscle activity. A limitation of this study was that the bite force transducer did not have the capabilities to record bite forces in a three-dimensional manner. However, for the purpose of recording MVBF, the anatomical features of the muscular-skeletal structures allow a person to clench down harder than they could perform a lateral movement. Extensive calibration tests were undertaken, and high confidence was placed in the accuracy of the bite force transducer across the whole range of bite forces encountered. The R-square value of 0.9967 showed a well-fitting linear regression to create the calibration formula. The wide range of MVBF values recorded were consistent with other reports (Bakke Citation2006; Hattori et al. Citation2009; Varga et al. Citation2011). This study was aimed at capturing the highest possible bite forces a person can generate. Recording these high forces is very dependent on the participant being willing to bite very hard. This was mitigated in part, by providing the participant with a comfortable bite substrate which at the same time allowed for an accurate measurement to be taken by not absorbing or redirecting the load in an unpredictable way. The thickness of the transducer allowed for an ideal jaw opening distance varying between 14 and 28 mm to record the highest forces people can generate as described previously by several authors (Bakke et al. Citation1989, Citation1990; Hattori et al. Citation2009; Cabral Citation2017). As evidenced by the mean bite forces of 430.4 N (sd = 279.4) as well as the bite force distribution recorded in this study, which is also similar to the bite forces reported from other studies previously mentioned, most people do not generate very high bite forces exceeding 500 N.
Contact area size and distribution does not seem to be related to sex as there was no statistical difference in the gradient observed between the two sexes. The differences in total contact area size between the molar and premolar regions can be explained by the molars being physically larger. However, higher bite forces on average were recorded from male participants, and over time, may contribute to larger contact areas, as the ability of a person to bite harder on average, may contribute as one factor in accelerated tooth wear for that specific person. As tooth wear progresses, average inter-occlusal contact sizes increases.
In the process of choosing a restorative material and designing a restoration in an all-ceramic material, the focus should not be on possible high bite forces alone. The combination of bite forces and the area on which those loads will be directed plays a much more important part, as the stress a restoration will experience will determine its life-span and clinical success. This study showed () that critically high-stress values can be reached by relatively low bite forces when a single contact area is very small. This may be one of the contributing factors for the clinical failure of all-ceramic restorations. When a restoration is manufactured, best practice is to provide balanced contact areas across the tooth surface in order to provide normal occlusion as well as stability and balanced stress distribution on the restoration. Occlusal adjustment by the clinician during placement may alter these contact areas and inadvertent small contact areas may be created. Furthermore, during function or during a bruxing event, a person may experience contact between teeth in such a position as to create a very small inter-contact area for that instance. The bite force may not necessarily be high, but the stress may be higher than the flexural strength of the material and a failure occurs.
Ceramics are indispensable in modern aesthetic dentistry and the continuous development of the materials and methods of fabrication in this area has resulted in a very large number of products available on the market. Today’s clinician faces a complex decision when choosing a ceramic for a particular indication. When faced with this selection, a decision is often based on material strength provided by the manufacturer or from study reports measured in vitro, which may not always predict the true performance characteristics a material will have when used in vivo. When evaluating the strength of brittle materials such as dental ceramics, it may be more appropriate to evaluate compressive strength in many cases due to the nature of clinical functions of a restoration. However, an aim of this study was to evaluate stresses on restorations and relating it to the commonly available flexural strength data such as those routinely published by manufacturers and used by clinicians. Flexural strength of all-ceramics fall into a wide range with Leucite glass, 120–180 MPa; Lithium Disilicate, 350 MPa; Aluminium Oxide, 600 MPa and the strongest, Zirconia at 900–1200 MPa (Anusavice Citation2013; Teja and Teja Citation2015). Unfortunately, as the strength of the materials increase, the translucency decreases, which has a negative effect on the aesthetic performance of the material in the mouth. The modern trend of a higher demand for better aesthetics, as one of the driving factors of an increased use of all-ceramics, may lead to the situation of materials being used outside of their functional strength range. However, in most instances of clinical failure of a restoration, the correct material choice would have been made as it is commonly accepted that higher strength is required for posterior teeth in comparison with anterior teeth while at the same time, less translucency is required for posterior teeth. The problem of material fracture may rather arise from stresses experienced being higher than the flexural strength of a material due to design and intra-oral adjustments resulting in very small contact points.
When taking the odds that a tooth may experience excessively high stresses, specifically those above 1200 MPa into account, the teeth on the right-hand side of the mouth had greater odds of falling in this category. The ‘handedness’ of participants were not recorded, however, it may be reasonable to conclude that with a higher number of people in any given population being right-handed (Masud and Ajmal Citation2012; Porac Citation2016), the habitual favouring of the right side when masticating may have developed the potential to bite harder on this side. Furthermore, when there are more contact points between opposing teeth, the odds are also greater that the tooth may experience stresses which may fall in the range above the maximum flexural strength of a zirconia restoration. This may purely be due to a scenario of more small contacts making up the total contact area of a tooth providing more opportunities of a small inter-occlusal contact event creating a high stress.
Even though the findings of this project does not address the complex arrangements of stresses that may be experienced by restorations at different contact angles, the contact point stress findings of this project highlights the importance of correct material choice as well as placing increased importance on the creation of large, balanced contact points in the design, manufacture as well as intra-occlusal adjustments of all-ceramic materials.
Disclosure statement
No potential conflict of interest was reported by the authors.
Additional information
Funding
References
- Aboushelib MN, Feilzer AJ, Kleverlaan CJ. 2009. Bridging the gap between clinical failure and laboratory fracture strength tests using a fractographic approach. Dental Materials. 25(3):383–391. doi: 10.1016/j.dental.2008.09.001
- Anusavice KJ. 2013. Phillips’ science of dental materials. 12th ed. St. Louis (MO): Elsevier/Saunders.
- Anusavice KJ, Kakar K, Ferree N. 2007. Which mechanical and physical testing methods are relevant for predicting the clinical performance of ceramic-based dental prostheses? Clinical Oral Implants Research. 18:218–231. doi: 10.1111/j.1600-0501.2007.01460.x
- Bakke M. 2006. Bite force and occlusion. Seminars in Orthodontics. 12(2):120–126. doi: 10.1053/j.sodo.2006.01.005
- Bakke M, Holm B, Jensen BL, Michler L, Möller E. 1990. Unilateral, isometric bite force in 8–68-year-old women and men related to occlusal factors. European Journal of Oral Sciences. 98(2):149–158. doi: 10.1111/j.1600-0722.1990.tb00954.x
- Bakke M, Michler L, Han KE, Möller E. 1989. Clinical significance of isometric bite force versus electrical activity in temporal and masseter muscles. European Journal of Oral Sciences. 97(6):539–551. doi: 10.1111/j.1600-0722.1989.tb00929.x
- Baladhandayutham B, Lawson NC, Burgess JO. 2015. Fracture load of ceramic restorations after fatigue loading. The Journal of Prosthetic Dentistry. 114(2):266–271. doi: 10.1016/j.prosdent.2015.03.006
- Cabral A. 2017. Influence of body position on maximum bite force. Manual Therapy, Posturology & Rehabilitation Journal = Revista Manual Therapy. 15:525–528.
- Hattori Y, Satoh C, Kunieda T, Endoh R, Hisamatsu H, Watanabe M. 2009. Bite forces and their resultants during forceful intercuspal clenching in humans. Journal of Biomechanics. 42(10):1533–1538. doi: 10.1016/j.jbiomech.2009.03.040
- Isaza JF, Throckmorton GS, Roldán SI. 2009. Design and construction of a transducer for bite force registration. Journal of Biomechanics. 42(8):1146–1149. doi: 10.1016/j.jbiomech.2009.02.015
- Johansson C, Kmet G, Rivera J, Larsson C, Vult Von Steyern P. 2014. Fracture strength of monolithic all-ceramic crowns made of high translucent yttrium oxide-stabilized zirconium dioxide compared to porcelain-veneered crowns and lithium disilicate crowns. Acta Odontologica Scandinavica. 72(2):145–153. doi: 10.3109/00016357.2013.822098
- Kelly JR, Tesk JA, Sorensen JA. 1995. Failure of all-ceramic fixed partial dentures in vitro and in vivo: analysis and modeling. Journal of Dental Research. 74(6):1253–1258. doi: 10.1177/00220345950740060301
- Kim JH, Park JH, Park YB, Moon HS. 2012. Fracture load of zirconia crowns according to the thickness and marginal design of coping. The Journal of Prosthetic Dentistry. 108(2):96–101. doi: 10.1016/S0022-3913(12)60114-0
- Lappin AK, Jones MEH. 2014. Reliable quantification of bite-force performance requires use of appropriate biting substrate and standardization of bite out-lever. Journal of Experimental Biology. 217(24):4303–4312. doi: 10.1242/jeb.106385
- Leevailoj C, Platt JA, Cochran MA, Moore BK. 1998. In vitro study of fracture incidence and compressive fracture load of all-ceramic crowns cemented with resin-modified glass ionomer and other luting agents. The Journal of Prosthetic Dentistry. 80(6):699–707. doi: 10.1016/S0022-3913(98)70058-7
- Masud Y, Ajmal MA. 2012. Left-handed people in a right-handed world: a phenomenological study. Pakistan Journal of Social and Clinical Psychology. 9(2):49–60.
- Nedelcu R, Olsson P, Nyström I, Thor A. 2018. Finish line distinctness and accuracy in 7 intraoral scanners versus conventional impression: an in vitro descriptive comparison. BMC Oral Health. 18(1):27. doi: 10.1186/s12903-018-0489-3
- Osborn JW, Mao J. 1993. A thin bite-force transducer with three-dimensional capabilities reveals a consistent change in bite-force direction during human jaw-muscle endurance tests. Archives of Oral Biology. 38(2):139–144. doi: 10.1016/0003-9969(93)90198-U
- Paphangkorakit J, Osborn JW. 1997. Effect of jaw opening on the direction and magnitude of human incisal bite forces. Journal of Dental Research. 76(1):561–567. doi: 10.1177/00220345970760010601
- Pjetursson BE, Sailer I, Makarov NA, Zwahlen M, Thoma DS. 2015. All-ceramic or metal-ceramic tooth-supported fixed dental prostheses (FDPs)? A systematic review of the survival and complication rates. Part II: multiple-unit FDPs. Dental Materials. 31(6):624–639. doi: 10.1016/j.dental.2015.02.013
- Porac C. 2016. Chapter 1 – Everybody’s right, so what’s left? In: Porac C, editor. Laterality. San Diego (CA): Academic Press; p. 1–16.
- Scherrer SS, Quinn JB, Quinn GD, Kelly JR. 2006. Failure analysis of ceramic clinical cases using qualitative fractography. International Journal of Prosthodontics. 19(2):185–192.
- Shahrbaf S, van Noort R, Mirzakouchaki B, Ghassemieh E, Martin N. 2014. Fracture strength of machined ceramic crowns as a function of tooth preparation design and the elastic modulus of the cement. Dental Materials. 30(2):234–241. doi: 10.1016/j.dental.2013.11.010
- Shushma G, Kantly R. 2016. Gnathodynamometer – a reliable device for assessing jaw bite force. Journal of Evolution of Medical and Dental Sciences. 5:7488–7490. doi: 10.14260/Jemds/2016/1695
- Spitznagel FA, Boldt J, Gierthmuehlen PC. 2018. CAD/CAM ceramic restorative materials for natural teeth. Journal of Dental Research. 97(10):1082–1091. doi: 10.1177/0022034518779759
- Sun T, Zhou S, Lai R, Liu R, Ma S, Zhou Z, Longquan S. 2014. Load-bearing capacity and the recommended thickness of dental monolithic zirconia single crowns. Journal of the Mechanical Behavior of Biomedical Materials. 35:93–101. doi: 10.1016/j.jmbbm.2014.03.014
- Teja S, Teja P. 2015. All-ceramic materials in dentistry. The Saint’s International Dental Journal. 1:91–95. doi: 10.4103/2454-3160.177930
- Varga S, Spalj S, Lapter Varga M, Anic Milosevic S, Mestrovic S, Slaj M. 2011. Maximum voluntary molar bite force in subjects with normal occlusion. The European Journal of Orthodontics. 33(4):427–433. doi: 10.1093/ejo/cjq097
- Wang XD, Fan DN, Swain MV, Zhao K. 2012. A systematic review of all-ceramic crowns: clinical fracture rates in relation to restored tooth type. International Journal of Prosthodontics. 25(5):441–450.
- Zhang Y, Mai Z, Barani A, Bush M, Lawn B. 2016. Fracture-resistant monolithic dental crowns. Dental Materials. 32(3):442–449. doi: 10.1016/j.dental.2015.12.010