
 ?Mathematical formulae have been encoded as MathML and are displayed in this HTML version using MathJax in order to improve their display. Uncheck the box to turn MathJax off. This feature requires Javascript. Click on a formula to zoom.
ABSTRACT
The 14th November 2016 Kaikōura earthquake was one of the most complex crustal earthquakes recorded in the modern era. The rupture propagated northward for more than 170 km along both mapped and unmapped faults causing widespread damage across central New Zealand. Field, Satellite Radar and GPS observations revealed ground displacements of up to 6 m (fault offsets of ∼12 m), extensive coastal uplift and large scale anelastic deformation including the ∼10 m uplift of a fault-bounded block.In the aftermath of the earthquake, slip models have estimated as much as 25 m of slip at depth along with the potential co-seismic rupture of the southern Hikurangi subduction interface. From the complex network of faults, exhibiting a variety of slip kinematics, to the large co-seismic slip, this earthquake has challenged our assumptions about fault segmentation in multi fault ruptures with important implications for seismic hazard. Following the earthquake, studies from multiple national and international groups have started to unravel some of the earthquakes complexities. Here I will present a broad overview of the current findings and discuss some of the ongoing debates and questions which have yet to be resolved.
1. Introduction
In the early hours of 14th November 2016, New Zealand was struck by one of the most complex earthquakes ever recorded by modern instrumentation (Hamling et al. Citation2017; Kaiser et al. Citation2017; Litchfield et al. Citation2018). With a magnitude of Mw 7.8, it was the largest event to have occurred in New Zealand since the 2009 Dusky Sound earthquake (Beavan et al. Citation2010) and was the latest in a spate of earthquakes to have struck New Zealand since 2003. Famed for its complexity, the earthquake has raised many questions about the degree to which multiple faults fail during earthquakes, with important implications for seismic hazard, and opened up the possibility of a rupture occurring along the southern terminus of the Hikurangi subduction zone.
The tectonics of New Zealand are largely controlled by the oblique convergence between the Pacific and Australian plates (). Along strike changes in the crustal structure and thickness of both the Australian and Pacific Plates as well as variations in the relative plate motions from north to south has led to a transition from the subduction of the Pacific plate beneath the North Island to dextral transpression and strike-slip faulting in the Marlborough Sounds and central South Island (Wallace et al. Citation2004, Citation2012). Across the southern North Island, margin parallel motion of ∼20 mm/yr is accommodated along a series of right-lateral strike slip faults (Van Dissen and Berryman Citation1996; Beanland and Haines Citation1998; Little et al. Citation2009; Carne et al. Citation2011) with ∼10 mm/yr being accommodated through the rotation of the forearc (Wallace et al. Citation2004). In central New Zealand, within Cook Strait, most of the plate motion is thought to be accommodated along crustal faults including the Boo Boo, Cloudy and Vernon faults (Pondard and Barnes Citation2010; Wallace et al. Citation2012). However, the transition from subduction of the Pacific plate beneath the North Island to the strike-slip dominated Marlborough Fault System is poorly understood. Through the Marlborough Fault system, the four major strike slip faults (Awatere, Wairau, Clarence and Hope) accommodate ∼80% of plate motion in addition to a complex zone of strike slip and transpression in northern Canterbury (Van Dissen and Yeats Citation1991; Barnes et al. Citation1998; Pettinga et al. Citation2001). While the majority of the faults which failed during the Kaikōura earthquake had previously been identified, only a third had incorporated into New Zealand's National Seismic Hazard Model (Stirling et al. Citation2012) with the remaining faults either unknown or not considered as active (Litchfield et al. Citation2018).
Figure 1. (Left) Location map of New Zealand. Red lines show the mapped active faults (Langridge et al. Citation2016), white line shows the location of the Hikurangi subduction zone (Williams et al. Citation2013) and the blue box denotes the region shown in the main figure. (Right) Location of mapped surface ruptures (heavy red lines), associated fault names and measured surface slip (Litchfield et al. Citation2018). The black lines are the mapped active faults and the White line marks the southern limit of the Hikurangi subduction zone. The plot in the top left shows the recorded surface offset along the Needles fault indicated by profile A-A' after (Clark et al. Citation2017).
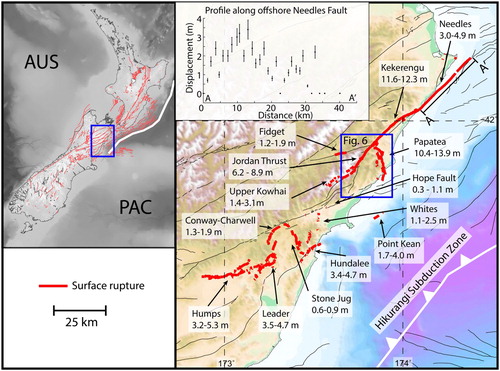
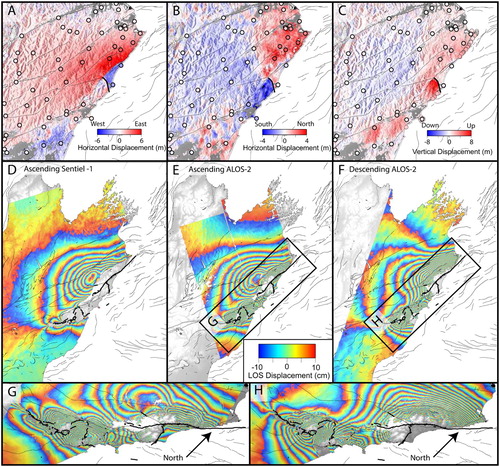
The earthquake struck at 00:02 local time on 14th November 2016 with an epicentre located in North Canterbury (). The rupture propagated for ∼170 km towards the northeast breaking both mapped and unmapped faults (Hamling et al. Citation2017; Kaiser et al. Citation2017; Litchfield et al. Citation2018) before terminating in the Cook Strait. The resulting surface deformation and network of faults which broke during the earthquake are some of the most complex ever observed. Surface ruptures were found along at least 17 main fault strands as well as numerous subsidiary structures (, Clark et al. Citation2017; Hamling et al. Citation2017; Kearse et al. Citation2018; Langridge et al. Citation2018; Litchfield et al. Citation2018; Nicol et al. Citation2018). Surface displacements revealed by geodetic data, including Satellite Radar Interferometry (InSAR) and GPS, show horizontal static displacements of up to ∼6 m with widespread uplift of ∼2 m but locally exceeding ∼8–10 m (–, Hamling et al. Citation2017; Hollingsworth et al. Citation2017; Morishita et al. Citation2017; Wang et al. Citation2018; Xu et al. Citation2018; Zinke et al. Citation2019). More than 20,000 landslides were triggered covering an area of ∼10,000 km causing significant damage and disruption to local infrastructure including the partial closure of State Highway 1 (Massey et al. Citation2018).
Figure 2. Location map and cosesimic GPS displacements for the Kaikōura earthquake. The red and white arrows show the vertical and horizontal GPS displacements respectively. The black lines show the location of active faults (Langridge et al. Citation2016) and the heavy black lines show the location of surface ruptures (Litchfield et al. Citation2018) as shown in . The blue box indicates the region shown in B and the blue ellipses show the location of the Inland and Seaward Kaikōuras and the Stewart Ranges. B, Epicentral locations for the Kaikōura earthquake from different sources as labelled. The yellow circles show the location of relocated seismicity from Lanza et al. (Citation2019). The blue box shows the region in panel C. C, Map showing the distribution of aftershocks from Lanza et al. (Citation2019). Moment tensors are from the Geonet catalogue. Red are for events between 10 and 20 km and blue are shallower than 10 km. The histogram shows the depth distribution of aftershocks plotted as yellow circles.
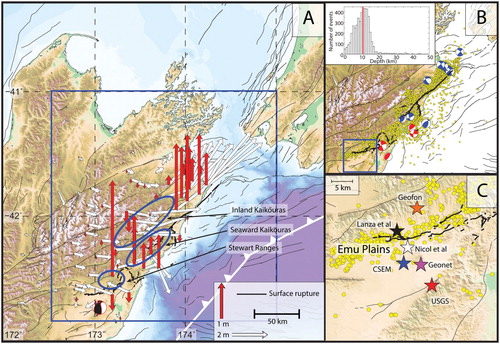
Figure 3. Surface deformation measured from SAR and InSAR. East-west A, north-south B, and vertical C displacements derived from SAR amplitude offsets from Hamling et al. (Citation2017). Coloured circles show the equivalent displacement measured at GPS. D, E, F, Ascending and descending interferograms acquired by JAXA's ALOS-2 satellite and the ESA's Sentinel-1A Hamling et al. (Citation2017). Each coloured fringe represents 20 cm of displacement either towards or away from the satellite. G, H, Zoom in of the near field deformation from E and F highlighting the complex fringe pattern most notably in the epicentral region.
2. Surface faulting and deformation
2.1. Southern ruptures and epicentral region
Within the epicentral region, ground observations and LiDAR surveys mapped the rupture of four main fault strands (Nicol et al. Citation2018), each composed of relatively short (<4 km) discontinuous traces with a combination of reverse, strike slip and oblique displacements. The earthquake is thought to have initiated on the Humps fault which extends for ∼36 km through the Emu Plains towards the Mt Stewart ranges (Nicol et al. Citation2018, and ). The precise epicentral location remains poorly constrained with variations in local and global estimates of more than 15 km. Locations based on global data generally put the epicentre ∼10 km south of the mapped surface traces () at a depth of 10–15 km; with the exception of one solution which is located ∼7 km to the north. However, assumptions on the Earth structure and wave propagation used to determine earthquake locations from global data typically have larger errors (Hjörleifsdóttir and Ekström Citation2010). Local estimates, based on manually picked P phases from the regional network, do better; locating the earthquake ∼2 km south of the mapped surface traces (Nicol et al. Citation2018). Field measurements and differential LiDAR suggest that, at the surface, the Humps fault is steeply dipping (70–80) to the south which has led to the interpretation that the Humps fault rupture initiated on a southward dipping fault (, Nicol et al. Citation2018; Mouslopoulou et al. Citation2019). However, a re-analysis of the earthquake sequence places the epicentre to the north of the surface ruptures (, Lanza et al. Citation2019) which is consistent with earlier studies suggesting that the earthquake initiated on a moderate to steeply dipping fault (Humps Fault) to the north (, Cesca et al. Citation2017; Hamling et al. Citation2017; Wang et al. Citation2018).
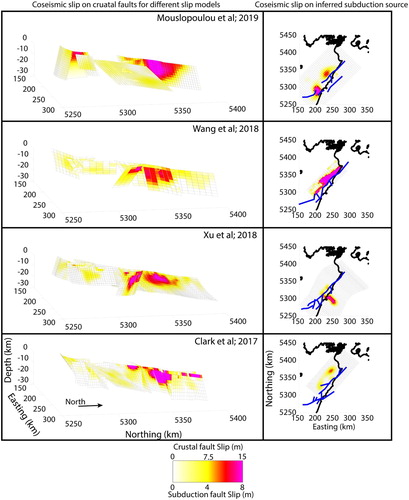
Figure 4. Comparison of co-seismic slip models showing the slip distributions along crustal faults and the subduction interface. The left hand panels shows an oblique view of the 3D distribution of slip along the crustal fault sources derived by Mouslopoulou et al. (Citation2019), Wang et al. (Citation2018), Xu et al. (Citation2018) and Clark et al. (Citation2017) based the inversion of predominantly geodetic data. The right hand panel shows the distribution of slip along the subduction zone from the same models using a different colour scale. The blue lines mark the surface traces of the modelled crustal fault planes.
To the east of the Emu Plains, the dip of the Humps Fault is more moderate to the north with maximum surface displacement of 4.1 m (Litchfield et al. Citation2018; Nicol et al. Citation2018). At its eastern termination, the Humps Fault intersects the more northward trending Leader Fault which marks the western boundary of a large uplifted block (Hamling et al. Citation2017; Morishita et al. Citation2017; Litchfield et al. Citation2018; Nicol et al. Citation2018). The uplift extends over an area of more than 100 km and is bounded by the Humps Fault to the south and Leader Fault to the west ( and ). Uplift of ∼2–3 m is observed across much of the area with localised fault offsets of up to 3.5 m (Hamling et al. Citation2017; Nicol et al. Citation2018). The coseismic pattern of uplift of the Stewart Ranges closely matches the present day topography suggesting that similar earthquakes must have occurred in the past (Nicol et al. Citation2018). To the east, the Hundalee Fault marks the southern boundary of the coastal uplift which extended for ∼100 km to Cook Strait ( and ). Surface slip along the Hundalee Fault was spatially discontinuous with maximum horizontal offsets of 3.7 m (Williams et al. Citation2018). The extent of rupture offshore is poorly resolved but a number of studies have inferred an offshore structure with a similar strike which can account for some of the observed uplift and tsunami (Clark et al. Citation2017; Gusman et al. Citation2018). Directly north of the Hundalee Fault, surface ruptures become less pronounced giving the appearance of a large fault jump. However, InSAR and optical satellite data indicate a discontinuity linking the Hundalee Fault to the Upper Kowhai Fault to the north (, Hamling et al. Citation2017; Zinke et al. Citation2019). Subsequent field investigations identified localised horizontal surface ruptures of up to 2 m (Litchfield et al. Citation2018) along the Whites Lineament (–).
2.2. Northern ruptures
North of the Whites Lineament, the rupture cuts into steep topography within the Seaward Kaikōura ranges ( and ). While limited to only a few ground observations, dextral-normal slip along the Upper Kowhai Fault of ∼2 m was observed consistent with geodetic observations (Hamling et al. Citation2017; Litchfield et al. Citation2018, ). North-east of the Upper Kowhai Fault, the surface faulting and deformation reveal one of the most spectacular features of the earthquake: the Papatea Block. Here an area of almost 150 km was uplift by up to 10 m and translated to the south by 4–5 m (Hamling et al. Citation2017; Langridge et al. Citation2018; Diederichs et al. Citation2019). The block is constrained by the Jordan Thrust to the west, Papatea Fault to the east and Hope Fault to the south. Along the Jordan Thrust ground observations indicate dextral slip of ∼7 m with a normal component of ∼2 m. However, satellite derived estimates indicate uplift of the hanging wall of 1–2 m suggesting that, while the net displacement is normal, the offset along the fault was overprinted by the motion of the Papatea block (). Along the Papatea Fault, which was not previously recognised as an active structure, net slip of up to 12 m is observed composed of ∼9.5 m of vertical throw and 4.3 m of sinstral strike slip (Langridge et al. Citation2018). A second, more discontinuous strand, is located ∼400–1700 m to the west of the main Papatea Fault leading to a narrow sliver of uplifted and extruded bedrock (Langridge et al. Citation2018). The geometry of the Papatea fault is highly variable with dips ranging from
at the coast to vertical at its northern extent (Langridge et al. Citation2018; Diederichs et al. Citation2019). Towards the coast, slip generally decreases but it can be traced offshore for a further ∼3 km (Langridge et al. Citation2018).
Unlike the southern ruptures, which show more surface heterogeneity, north of the Papatea Fault the rupture becomes more localised along the Kekerengu Fault and offshore Needles Fault ( and , Clark et al. Citation2017; Hamling et al. Citation2017; Kearse et al. Citation2018). The largest ground displacements and surface offsets occurred along this section of the rupture and resulted in the maximum release in seismic energy (Holden et al. Citation2017; Kaiser et al. Citation2017; Kaneko et al. Citation2017). The Kekerengu Fault ruptured in it's entirety linking the Jordan Thrust to the south and offshore Needles Fault to the north (Kearse et al. Citation2018; Litchfield et al. Citation2018). Peak surface slip of ∼12 m was measured along the Kekerengu with uplift of the hanging wall of ∼1.5 m (Kearse et al. Citation2018) leading to widespread uplift through the inland Kaikōura ranges (, Clark et al. Citation2017; Hamling et al. Citation2017).
3. Modelling and kinematics
To date, numerous slip models have been proposed with varying levels of complexity ranging from three rupture planes (Cesca et al. Citation2017; Hollingsworth et al. Citation2017; Wang et al. Citation2018) to those with complex geometries including more than 10 fault sources (, Clark et al. Citation2017; Hamling et al. Citation2017; Wang et al. Citation2018; Xu et al. Citation2018). Most of this variation is a result of the data being used to infer slip in the subsurface. Models utilising high resolution ground deformation data, such as InSAR and offsets derived from optical satellite images, typically have more complex geometries (Clark et al. Citation2017; Hamling et al. Citation2017; Wang et al. Citation2018; Xu et al. Citation2018). Estimates of maximum slip, associated with the Kekerengu Fault, range from ∼12 m (Wang et al. Citation2018) to close to 25 m (, Clark et al. Citation2017; Hamling et al. Citation2017). This is largely a result of the uncertainty in the fault geometries at depth. Hamling et al. (Citation2017) fixed the dip to fit geological estimates whereas other studies attempted to solve for the dip angle explicitly (Wang et al. Citation2018; Xu et al. Citation2018). These models tend to favour shallower dip angles on the northern faults and therefore require less slip to match the surface displacements (). However, ground observations (Kearse et al. Citation2018) and offshore seismics (in the case of the Needles, Barnes and Audru Citation1999) indicate more steeply dipping structures for the Kekerengu and Needles Faults. In the epicentral region, slip of 5–8 m is generally estimated at depth along the Humps (Hamling et al. Citation2017; Wang et al. Citation2018; Xu et al. Citation2018) although some studies suggest slip as high as 12 m close to the surface (, Mouslopoulou et al. Citation2019).
One of the ongoing debates following the earthquake surrounds the role of the Hikurangi megathrust with models falling into one of two main categories. The first point toward a significant component of seismic moment coming from the subduction interface (Bai et al. Citation2017; Hollingsworth et al. Citation2017; Wang et al. Citation2018) while the second suggest only a minor or no contribution (Clark et al. Citation2017; Hamling et al. Citation2017; Xu et al. Citation2018; Mouslopoulou et al. Citation2019, ). Despite the relatively shallow epicentral depth and inland location, global moment tensor solutions indicate a large component of thrust motion along a shallow dipping fault plane. Furthermore, the observation of a local tsunami (Hamling et al. Citation2017; Power et al. Citation2017; Gusman et al. Citation2018), which generally requires significant deformation of the seafloor, has been used as evidence to support the involvement of the megathrust. However, analysis of the local deformation field, combined with field observations and local seismic recordings point toward a predominantly crustal rupture (Hamling et al. Citation2017; Holden et al. Citation2017; Litchfield et al. Citation2018; Mouslopoulou et al. Citation2019). For models which include a subduction source, the contribution to moment varies from (Clark et al. Citation2017; Hamling et al. Citation2017) to close to 50% (Wang et al. Citation2018). Studies including a large component of subduction slip argue that it is required to fit the tsunami records (Bai et al. Citation2017; Wang et al. Citation2018). However, uplift of the seafloor from the crustal sources (Gusman et al. Citation2018) and possible offshore landslide (Heidarzadeh and Satake Citation2017; Mountjoy et al. Citation2018) can both explain the observed tsunami without needing slip along the subduction zone. In the Kaikōura region, sea floor observations and local uplift data point towards a shallowly dipping offshore fault (Clark et al. Citation2017; Gusman et al. Citation2018). This is more consistent with the decay in coastal uplift which drops from ∼1 m at the coast to close to zero over a 4 km length scale. With the interface at a depth of ∼19 km, the short wavelength variations are better explained by a shallow source (Clark et al. Citation2017). Much of the uncertainty comes from the lack of resolving power in many of the methods used in infer slip at depth combined with large variations in model geometries and parametrisations. Due to the large ground displacements, any deformation caused by slip at depth is swamped by the shallower sources making the co-seismic slip distribution highly non-unique (Xu et al. Citation2018).
The rupture took ∼120 s from start to finish with estimates of the average rupture speed from ∼1.5–3 km/s (Holden et al. Citation2017; Kaiser et al. Citation2017; Wang et al. Citation2018; Xu et al. Citation2018; Ulrich et al. Citation2019). The majority of models hint at a slower rupture speed (1.5–2 km/s) but allowing for a more complex rupture path increases the speed to 2.9 km/s (Ulrich et al. Citation2019). While details differ, rupture simulations tend to converge towards a rupture from west to east along the Humps and Hundalee Faults. Surface offsets measured along the coast and up to 2 km offshore associtated with the Hundalee Fault (Williams et al. Citation2018) and inferred slip across the offshore Point Kean Fault suggest that at least some slip was transferred offshore and may help link the southern and northern ruptures through the Papatea Fault. Uncertainty remains around the rupture kinematics of the Papatea Fault with models including (Wang et al. Citation2018; Xu et al. Citation2018; Ulrich et al. Citation2019) and excluding its rupture (Ando and Kaneko Citation2018; Holden et al. Citation2017) explaining the observations. Some models suggest that it connected the northern and southern faults with the rupture going through the the southern faults, the Papatea Fault and then bi-laterally along the Jordan Thrust-Upper Kowhai to the west and Kekerengu to the east (Ulrich et al. Citation2019). However, others show that after passing through the southern faults, the rupture front continued onto the Upper Kowhai and Jordan Thrust with the co-rupture of the Papatea Fault at the same time (Wang et al. Citation2018). With Wellington only ∼60 km from the termination of the rupture, the final arrest of the Kaikōura earthquake was fortuitous. The initiation and arrest of slip along a fault are thought to be governed by the stress heterogeneity along the fault (e.g. Parsons and Minasian Citation2015). Consistently, spontaneous rupture models of the Kaikōura earthquake naturally arrest along the Needles Fault based on the pre-earthquake stress field (Ando and Kaneko Citation2018).
4. Discussion
4.1. Role of the subduction interface
Whether the subduction zone slipped or not has significant implications for the seismic hazard for the region. Prior to the earthquake, the national seismic hazard model did not consider the Hikurangi subduction zone as a possible rupture source south of the Cook Strait (Stirling et al. Citation2012). Estimates of the long term geological strain rates across the northern South Island (Holt and Haines Citation1995) indicate that almost all of the relative plate motion is accommodated through the deformation of the overriding plate. Another line of evidence is the lack of a well developed accretionary wedge offshore (Collot et al. Citation1996; Reyners et al. Citation1997). Typically, accretion occurs as a direct result of the frontal off scraping at the trench axis (Clift and Vannucchi Citation2004) and so its absence may indicate that the plate interface was fully locked during deposition of the trench-fill turbidites. Numerical models investigating the formation of the MFS can explain the development of the faults within the brittle crust while including a permanently locked subduction interface (Ellis et al. Citation2008). These models suggest the development of a distributed shear zone within the middle crust consistent with high V-V
ratios, crustal anisotropy and low resistivity zones imaged by seismic tomography (Eberhart-Phillips and Bannister Citation2010), anisotropy (Wilson et al. Citation2004) and magnetotelluric data (Wannamaker et al. Citation2009) respectively. Based on these observations, it has been suggested that the southern terminus of the subduction zone (south of Cook Strait) is permanently locked and can no longer slip co-seismically (Reyners et al. Citation1997, Citation2017). However, kinematic elastic block modelling of GPS and fault slip rate data suggests that only
of the relative plate motion is taken up by known crustal faults (Wallace et al. Citation2012, Citation2018) indicating that a portion of plate motion is either being accommodated along unknown structures or along the plate interface at depth.
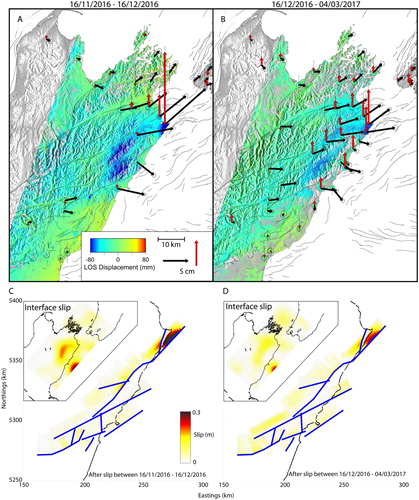
Analysis of the post-seismic deformation can also help understand whether or not the interface may have moved during the earthquake. Following a large event, afterslip is frequently observed in parts of the fault surrounding the main co-seismic rupture (Lin and Stein Citation2004). In the months following the earthquake, InSAR and GPS (Wallace et al. Citation2018; Mouslopoulou et al. Citation2019) shows continued widespread uplift across much of the coastal region in addition to broad subsidence inland (). Due to the long wavelength of the deformation, the observations cannot be explained by slip along the crustal faults alone but require slip along a deeper low-angle structure (Wallace et al. Citation2017). Based on the post-seismic models, it appears that the southern termination of the subduction zone is at least capable of slipping (). While we may never be able to fully resolve how much slip occurred co-seismically, given the magnitude of slip along the crustal faults and large stress changes imparted on the interface (Hamling et al. Citation2017; Xu et al. Citation2018; Mouslopoulou et al. Citation2019) it would not be surprising if the interface was dragged along with the upper crustal rupture.
Figure 5. Post-seismic interferograms and GPS displacements following the Kaikōura earthquake between 16/11/2016 and 16/12/2016 A and between 16/12/2016 and 04/03/2017 B. Negative LOS values indicate motion towards the satellite. C and D show the best fit afterslip models derived from the inversion of InSAR and GPS data for the two periods shown based on the fault model of Clark et al. (Citation2017) including slip along the subduction interface.
4.2. Papatea block escape tectonics
Between the northern and southern ruptures, the coseismic uplift and southward translation of the Papatea Block raises numerous questions about fault scaling relationships and how we model co-seismic slip. As a whole, the configuration of faults around the Papatea block and observed ground displacements are not consistent with traditional dislocation methods to model fault slip (Hamling et al. Citation2017). At the eastern boundary of the block lies the Papatea Fault which hosted some of the largest surface offsets of the entire earthquake. Prior to the event, neither the Papatea fault nor any of its associated subsidiary structures were recognised as being active faults (Rattenbury et al. Citation2006; Langridge et al. Citation2018). The kinematics of the Papatea Fault's rupture are unusual. Slip along the main strand reached ∼10 m and yet its length is only 17–19 km (Langridge et al. Citation2018). Considering empirical scaling relationships used in New Zealand (Stirling et al. Citation2012), slip along the Papatea is unusually high based on its length. Similarly, despite its short length, the Papatea Fault exhibit large variations in dip along its length. At its northern end, the fault dips steeply at to the east before rotating dip direction to the west as it comes south (Diederichs et al. Citation2019). Although the dip generally shallows as it approaches the coast, where the main strand has a dip of ∼50–60
, with an average dip of more than 70
along the northern sections, the Papatea Fault does not conform with Andersonian fault mechanics (Anderson Citation1905).
On its western edge is the northwest dipping Jordan Thrust and, as the name suggests, it has a long term history of thrust faulting as evidenced by the higher elevations on the hanging wall side (Collett et al. Citation2019). If we temporarily ignore the Papatea block, the large scale coseismic displacement field associated with this event indicates uplift of the hanging wall of 1–2 m, consistent with its long term activity (Hamling et al. Citation2017; Xu et al. Citation2018). However, the Papatea block, which forms the footwall, has been uplifted by 3–5 m meaning that the net vertical offset across the fault is opposite to its long term motion. To the south, the block is bounded by the seaward end of the Hope Fault which is dipping steeply to the north. In the case of the Hope fault, the overall uplift pattern is consistent with its geometry showing uplift of the footwall. But there is another problem. The observed uplift increases away from the Hope fault with its peak near the northern boundary of the block () which is opposite to what one would expect for thrust motion along a fault.
Figure 6. A, Large scale ground displacements derived from SAR offset data after Hamling et al. (Citation2017) and Langridge et al. (Citation2018) showing the uplift of the Papatea Block. Arrows indicate the horizontal displacement field with the coloured background showing the vertical. The blue lines show the location of faulting associated with the Papatea Fault. Black lines are faults from the active fault database (Langridge et al. Citation2016) with the main faults which ruptured during the earthquake labelled. B, LiDAR derived offsets after (Diederichs et al. Citation2019) along the Papatea Fault. The large red arrow indicates the look direction for the 3D perspective shown in C. C, Smoothed 3D view of the Papatea block highlighting the observed seaward tilt. with the location of the Papatea and Kekerengu Faults labelled.
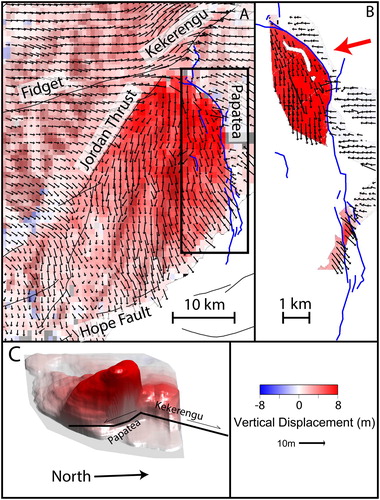
Co-seismic slip models which include the Papatea fault typically struggle to generate the large scale translation of the Papatea block and fail to match the surface deformation immediately around the fault (Wang et al. Citation2018; Xu et al. Citation2018; Mouslopoulou et al. Citation2019). In order to minimise the misfit, models require a much shallower dip than has been measured in the field (Langridge et al. Citation2018) or by LiDAR (Diederichs et al. Citation2019). As a result of the large displacements associated with the fault, models predict net slip of ∼18 m. However, using a classical (Okada Citation1985) elastic dislocation the balance of hanging wall uplift to footwall subsidence does not match the observed deformation pattern. A by-product of generating the large vertical throws along a steeply dipping thrust fault is that it be accompanied by significant subsidence of the footwall. However, the Papatea fault shows almost none (Hamling et al. Citation2017; Langridge et al. Citation2018; Diederichs et al. Citation2019, ).
All of the available observations points towards the Papatea block being an example of escape tectonics whereby motion of the Papatea block is a result of its extrusion to accommodate space within a major step-over (Hamling et al. Citation2017; Diederichs et al. Citation2019; Zinke et al. Citation2019, ). Unlike traditional fault slip which releases strain built up since the last earthquake, it has been suggested that slip along the Papatea fault occurred solely in response to the rapid shortening caused by slip along neighbouring faults as opposed to the release of accumulated interseismic strain along the fault itself (Diederichs et al. Citation2019). This is supported by the observed lack of aftershocks, negligible vertical post-seismic deformation (Hamling et al. Citation2017), and may also explain why the fault appears seismically quiet in back-projection models (Zhang et al. Citation2017; Wang et al. Citation2018; Diederichs et al. Citation2019; Tan et al. Citation2019).
4.3. Surface slip vs slip at depth
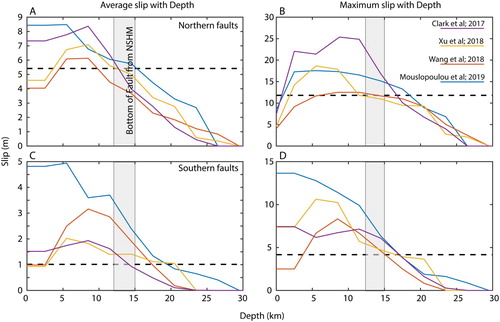
Surface fault slip and the depths to which slip occurs are important parameters in seismic hazard calculations affecting both estimates of earthquake recurrence and maximum magnitude. However, discrepancies between geological surface displacements and slip derived from geodetic inversions is not uncommon (Kaneko and Fialko Citation2011; Dolan and Haravitch Citation2014; Xu et al. Citation2016). Despite the uncertainty in the fault geometry and trade-offs with slip along neighbouring faults, the majority of the slip models suggest greater slip at depth than at the surface (Hamling et al. Citation2017; Kearse et al. Citation2018; Litchfield et al. Citation2018; Nicol et al. Citation2018). Along the Kekerengu Fault, where ∼12 m horizontal offsets were measured at the surface (Kearse et al. Citation2018), models suggest slip of 15–25 m at depths of 5–10 km depth with slip of ∼7 m down to 20 km or more (Hamling et al. Citation2017; Xu et al. Citation2018; Mouslopoulou et al. Citation2019, ). In the epicentral region, models suggest slip of more than 5 m at depth but only variable discontinuous slip, typically less than ∼3–4 m, is observed at the surface. Lack of near fault data, commonly found in geodetic inversions, reduces their ability to resolve shallow slip and can explain some of the observed differences (Kaneko and Fialko Citation2011; Xu et al. Citation2016). However, in this case many of the inversions have both on and off-fault data and are able to match the observed surface offsets (Hamling et al. Citation2017; Wang et al. Citation2018; Xu et al. Citation2018). The southern faults, through North Canterbury, typically have low slip rates and long recurrence intervals (Barrell and Townsend Citation2012) and, during the Kaikōura earthquake, exhibited more discontinuous surface traces with less localised on-fault deformation. Structurally immature faults have been shown to have larger shallow slip deficits than mature faults (Dolan and Haravitch Citation2014). Both the average and maximum slip estimates from cosesimic models exceed the surface observations (Litchfield et al. Citation2018; Nicol et al. Citation2018) by 2–3 times, consistent with them being immature (). Similarly, despite having high Holocene slip rates and more localised co-seismic slip zones, the northern faults (Needles-Kekerengu-Jordan Thrust) long term geological offsets suggest that they are also structurally immature (Litchfield et al. Citation2018), consistent with the observed differences between cosesimic models and surface observations.
Figure 7. A and B show the average and maximum slip values for the different co-seismic slip models () for the northern ruptures (Needles-Kekerengu-Jordan Thrust-Upper Kowhai). For the slip models shown, slip averages are calculated by taking the mean slip across all of the fault segments at depth intervals of 2 km. C and D show the average and maximum slip values but for the southern ruptures (south of the Hope Fault, ). The grey box in each panel shows the seismogenic depth limit in the NSHM (Stirling et al. Citation2012). The dashed black lines show the maximum and average slip estimates from the ground observations (Kearse et al. Citation2018; Litchfield et al. Citation2018).
Evidence for both shallow slip deficits and slip exceeding the seismogenic depth in the national hazard model have important implications for hazard. If fault slip rates and seismogenic depth are underestimated then any resulting earthquake probability estimates will also be underestimated. Slip rate estimates for the Humps Fault are ∼1 mm/yr with recurrence intervals of 5000–10,000 years (Litchfield et al. Citation2018). With a peak slip estimated at ∼7 m for this event, and a slip rate of 1 mm/yr, this would imply a 7000 year recurrence interval. Well within the paleoseismic estimates. However, for the faster slipping Kekerengu Fault, which has a slip rate and recurrence interval of ∼24 mm/yr and 376 years respectively (Little et al. Citation2018), co-seismic slip of 15–20 m inferred from co-seismic models () either gives a recurrence of ∼700 years or requires a doubling of the slip rate. Since the latter would exceed plate motion budgets, it is unlikely that the slip rate is double. One solution to this could be that the rupture of these faults varies through time (Zinke et al. Citation2017). It is possible that these large deep penetrating ruptures only occur every 800–1000 years with smaller shallow ruptures filling the shallow deficit in between these large events. This would still produce the same paleoseismic recurrence and slip slip rate but suggests that the shallow portion of the fault behaves differently. Kinematic slip models suggest that the Kekerengu Fault re-ruptured during the Kaikōura earthquake with the upper 10 km failing first followed by the deeper portion (Holden et al. Citation2017) supporting this type of behaviour. Alternatively, both static and dynamic stress changes suggest that the rupture of the southern faults loaded the northern segments (Hamling et al. Citation2017; Xu et al. Citation2018) possibly allowing for much larger slip magnitudes than would normally be expected.
5. Conclusions
To date, the 2016 Kaikōura earthquake was one of the most complex crustal earthquakes ever recorded and raised important questions on how multi-fault rupture scenarios are defined for seismic hazard models in plate boundary zones worldwide. Despite the rupturing of at least 17 main fault strands and having some of the largest recorded surface offsets in the world (Kearse et al. Citation2018), only ∼33% of the mapped surface ruptures had been included as sources in the NHSM (Stirling et al. Citation2012; Litchfield et al. Citation2018). Co-seismic models indicate that slip at depth along many of the faults was likely greater than observed at the surface, challenging paleoseismic observations of long term slip rates and recurrence intervals and supporting observations of time varying slip behaviour (Zinke et al. Citation2017). Furthermore, the Papatea block and evidence of widespread anelastic surface deformation call into question assumptions about fault elasticity in complex multi-fault earthquakes and our understanding of rupture dynamics. While many of the studies have converged towards the Kaikōura earthquake being a predominantly crustal event, debate around the contribution of the southern Hikurangi subduction interface remains. Although it is unlikely that we will fully resolve its moment contribution, a growing number of observations suggest that it can at least accommodate slip, either as a consequence of a large upper crustal event or in the following post-seismic period.
Acknowledgments
Thanks to Phaedra Upton for reviewing an early version of this manuscript and to many of my colleagues and collaborators for fruitful discussions on aspects of the earthquake over the last few years. Thanks to the European Union Copernicus program and the European Space Agency for access to and scheduling of Sentinel-1 data and JAXA for access to ALOS-2 data.
Disclosure statement
No potential conflict of interest was reported by the author.
Additional information
Funding
References
- Anderson EM. 1905. The dynamics of faulting. Transactions of the Edinburgh Geological Society. 8(3):387–402. doi: 10.1144/transed.8.3.387
- Ando R, Kaneko Y. 2018. Dynamic rupture simulation reproduces spontaneous multifault rupture and arrest during the 2016 mw 7.9 Kaikoura earthquake. Geophysical Research Letters. 45(23):12–875. doi: 10.1029/2018GL080550
- Bai Y, Lay T, Cheung KF, Ye L. 2017. Two regions of seafloor deformation generated the tsunami for the 13 November 2016, Kaikoura, New Zealand earthquake. Geophysical Research Letters. 44(13):6597–6606. doi: 10.1002/2017GL073717
- Barnes PM, Audru JC. 1999. Quaternary faulting in the offshore Flaxbourne and Wairarapa basins, southern Cook Strait, New Zealand. New Zealand Journal of Geology and Geophysics. 42(3):349–367. doi: 10.1080/00288306.1999.9514851
- Barnes PM, Lépinay BM, Collot JY, Delteil J, Audru JC. 1998. Strain partitioning in the transition area between oblique subduction and continental collision, Hikurangi margin, New Zealand. Tectonics. 17(4):534–557. doi: 10.1029/98TC00974
- Barrell DJ, Townsend DB. 2012. General distribution and characteristics of active faults and folds in the Hurunui District, North Canterbur. GNS Science. Report No: 2012/113.
- Beanland S, Haines J. 1998. The kinematics of active deformation in the North Island, New Zealand, determined from geological strain rates. New Zealand Journal of Geology and Geophysics. 41(4):311–323. doi: 10.1080/00288306.1998.9514813
- Beavan J, Samsonov S, Denys P, Sutherland R, Palmer N, Denham M. 2010. Oblique slip on the Puysegur subduction interface in the 2009 July Mw 7.8 Dusky Sound earthquake from GPS and InSAR observations: implications for the tectonics of southwestern New Zealand. Geophysical Journal International. 183(3):1265–1286. doi: 10.1111/j.1365-246X.2010.04798.x
- Carne R, Little T, Rieser U. 2011. Using displaced river terraces to determine Late Quaternary slip rate for the central Wairarapa Fault at Waiohine River, New Zealand. New Zealand Journal of Geology and Geophysics. 54(2):217–236. doi: 10.1080/00288306.2010.532224
- Cesca S, Zhang Y, Mouslopoulou V, Wang R, Saul J, Savage M, Heimann S, Kufner SK, Oncken O, Dahm T. 2017. Complex rupture process of the Mw 7.8, 2016, Kaikoura earthquake, New Zealand, and its aftershock sequence. Earth and Planetary Science Letters. 478:110–120. doi: 10.1016/j.epsl.2017.08.024
- Clark K, Nissen E, Howarth J, Hamling I, Mountjoy J, Ries W, Jones K, Goldstien S, Cochran U, Villamor P, et al. 2017. Highly variable coastal deformation in the 2016 Mw7. 8 Kaikōura earthquake reflects rupture complexity along a transpressional plate boundary. Earth and Planetary Science Letters. 474:334–344. doi: 10.1016/j.epsl.2017.06.048
- Clift P, Vannucchi P. 2004. Controls on tectonic accretion versus erosion in subduction zones: implications for the origin and recycling of the continental crust. Reviews of Geophysics. 42(2):1–31. doi: 10.1029/2003RG000127
- Collett CM, Duvall AR, Flowers RM, Tucker GE, Upton P. 2019. The timing and style of oblique deformation within New Zealand's Kaikōura ranges and Marlborough fault system based on low-temperature thermochronology. Tectonics. 38(4):1250–1272. doi: 10.1029/2018TC005268
- Collot JY, Delteil J, Lewis KB, Davy B, Lamarche G, Audru JC, Barnes P, Chanier F, Chaumillon E, Lallemand S, et al. 1996. From oblique subduction to intra-continental transpression: structures of the southern Kermadec-Hikurangi margin from multibeam bathymetry, side-scan sonar and seismic reflection. Marine Geophysical Researches. 18(2-4):357–381. doi: 10.1007/BF00286085
- Diederichs A, Nissen EK, Lajoie LJ, Langridge RM, Malireddi SR, Clark KJ, Hamling IJ, Tagliasacchi A. 2019. Unusual kinematics of the Papatea fault (2016 Kaikōura earthquake) suggests anelastic rupture. Science Advances. 5:eaax5703. doi: 10.1126/sciadv.aax5703
- Dolan JF, Haravitch BD. 2014. How well do surface slip measurements track slip at depth in large strike-slip earthquakes? The importance of fault structural maturity in controlling on-fault slip versus off-fault surface deformation. Earth and Planetary Science Letters. 388:38–47. doi: 10.1016/j.epsl.2013.11.043
- Eberhart-Phillips D, Bannister S. 2010. 3-D imaging of Marlborough, New Zealand, subducted plate and strike-slip fault systems. Geophysical Journal International. 182(1):73–96.
- Ellis S, Eberhart-Phillips D, Upton P, Wallace L, Eusden E. 2008. Transition from subduction to collision in the northern South Island, New Zealand: influence of crustal strength and geometry on localization and fault development. Geomod 2008.
- Gusman AR, Satake K, Gunawan E, Hamling I, Power W. 2018. Contribution from multiple fault ruptures to tsunami generation during the 2016 Kaikoura earthquake. Pure and Applied Geophysics. 175(8):2557–2574. doi: 10.1007/s00024-018-1949-z
- Hamling IJ, Hreinsdóttir S, Clark K, Elliott J, Liang C, Fielding E, Litchfield N, Villamor P, Wallace L, Wright TJ, et al. 2017. Complex multifault rupture during the 2016 Mw 7.8 Kaikōura earthquake, New Zealand. Science. 356(6334):eaam7194. doi: 10.1126/science.aam7194
- Heidarzadeh M, Satake K. 2017. Possible dual earthquake–landslide source of the 13 November 2016 Kaikoura, New Zealand Tsunami. Pure and Applied Geophysics. 174(10):3737–3749. doi: 10.1007/s00024-017-1637-4
- Hjörleifsdóttir V, Ekström G. 2010. Effects of three-dimensional Earth structure on CMT earthquake parameters. Physics of the Earth and Planetary Interiors. 179(3-4):178–190. doi: 10.1016/j.pepi.2009.11.003
- Holden C, Kaneko Y, D'Anastasio E, Benites R, Fry B, Hamling I. 2017. The 2016 Kaikōura earthquake revealed by kinematic source inversion and seismic wavefield simulations: slow rupture propagation on a geometrically complex crustal fault network. Geophysical Research Letters. 44(22):11–320. doi: 10.1002/2017GL075301
- Hollingsworth J, Ye L, Avouac JP. 2017. Dynamically triggered slip on a splay fault in the Mw 7.8, 2016 Kaikoura (New Zealand) earthquake. Geophysical Research Letters. 44(8):3517–3525. doi: 10.1002/2016GL072228
- Holt WE, Haines AJ. 1995. The kinematics of northern South Island, New Zealand, determined from geologic strain rates. Journal of Geophysical Research: Solid Earth (1978–2012). 100(B9):17991–18010. doi: 10.1029/95JB01059
- Kaiser A, Balfour N, Fry B, Holden C, Litchfield N, Gerstenberger M, D'Anastasio E, Horspool N, McVerry G, Ristau J, et al. 2017. The 2016 Kaikōura, New Zealand, earthquake: preliminary seismological report. Seismological Research Letters. 88(3):727–739. doi: 10.1785/0220170018
- Kaneko Y, Fialko Y. 2011. Shallow slip deficit due to large strike-slip earthquakes in dynamic rupture simulations with elasto-plastic off-fault response. Geophysical Journal International. 186(3):1389–1403. doi: 10.1111/j.1365-246X.2011.05117.x
- Kaneko Y, Fukuyama E, Hamling IJ. 2017. Slip-weakening distance and energy budget inferred from near-fault ground deformation during the 2016 Mw7. 8 Kaikōura earthquake. Geophysical Research Letters. 44(10):4765–4773. doi: 10.1002/2017GL073681
- Kearse J, Little TA, Van Dissen RJ, Barnes PM, Langridge R, Mountjoy J, Ries W, Villamor P, Clark KJ, Benson A, et al. 2018. Onshore to offshore ground-surface and seabed rupture of the Jordan–Kekerengu–Needles fault network during the 2016 M w 7.8 Kaikōura earthquake, New Zealand. Bulletin of the Seismological Society of America.108:1573–1595. doi: 10.1785/0120170304
- Langridge RM, Ries WF, Litchfield NJ, Villamor P, Van Dissen RJ, Barrell DJA, Rattenbury M, Heron D, Haubrock S, Townsend D, et al. 2016. The New Zealand active faults database. New Zealand Journal of Geology and Geophysics. 59(1):86–96. doi: 10.1080/00288306.2015.1112818
- Langridge RM, Rowland J, Villamor P, Mountjoy J, Townsend DB, Nissen E, Madugo C, Ries WF, Gasston C, Canva A, et al. 2018. Coseismic rupture and preliminary slip estimates for the Papatea fault and its role in the 2016 Mw 7.8 Kaikōura, New Zealand, Earthquake. Bull Seismol Soc Am. 108:1596–1622. doi: 10.1785/0120170336
- Lanza F, Chamberlain CJ, Jacobs K, Warren-Smith E, Godfrey HJ, Kortink M, Thurber CH, Savage MK, Townend J, Roecker S, et al. 2019. Crustal fault connectivity of the Mw 7.8 2016 Kaikōura earthquake constrained by aftershock relocations. Geophysical Research Letters. 46:6487–6496. doi: 10.1029/2019GL082780
- Lin J, Stein R. 2004. Stress triggering in thrust and subduction earthquakes and stress interaction between the southern San Andreas and nearby thrust and strike-slip faults. Journal of Geophysical Research: Solid Earth (1978–2012). 109(B02303):1–19.
- Litchfield NJ, Villamor P, Dissen RJV, Nicol A, Barnes PM, A Barrell DJ, Pettinga JR, Langridge RM, Little TA, Mountjoy JJ, et al. 2018. Surface rupture of multiple crustal faults in the 2016 Mw 7.8 Kaikōura, New Zealand, Earthquake. Bulletin of the Seismological Society of America. 108:1496–1520. doi: 10.1785/0120170300
- Little TA, Van Dissen R, Kearse J, Norton K, Benson A, Wang N. 2018. Kekerengu fault, New Zealand: timing and size of late holocene surface ruptures. Bulletin of the Seismological Society of America. 108:1556–1572. doi: 10.1785/0120170152
- Little TA, Van Dissen R, Schermer E, Carne R. 2009. Late Holocene surface ruptures on the southern Wairarapa fault, New Zealand: Link between earthquakes and the uplifting of beach ridges on a rocky coast. Lithosphere. 1(1):4–28. doi: 10.1130/L7.1
- Massey C, Townsend D, Rathje E, Allstadt KE, Lukovic B, Kaneko Y, Bradley B, Wartman J, Jibson RW, Petley DN, et al. 2018. Landslides triggered by the 14 November 2016 Mw 7.8 Kaikōura Earthquake, New Zealand. Bulletin of the Seismological Society of America. 108(3B):1630–1648. doi: 10.1785/0120170305
- Morishita Y, Kobayashi T, Fujiwara S, Yarai H. 2017. Complex crustal deformation of the 2016 Kaikoura, New Zealand, earthquake revealed by ALOS-2 complex crustal deformation of the 2016 Kaikoura, New Zealand, earthquake revealed by ALOS-2. Bulletin of the Seismological Society of America. 107(6):2676–2686. doi: 10.1785/0120170143
- Mountjoy JJ, Howarth JD, Orpin AR, Barnes PM, Bowden DA, Rowden AA, Schimel AC, Holden C, Horgan HJ, Nodder SD, et al. 2018. Earthquakes drive large-scale submarine canyon development and sediment supply to deep-ocean basins. Science Advances. 4(3):eaar3748. doi: 10.1126/sciadv.aar3748
- Mouslopoulou V, Saltogianni V, Nicol A, Oncken O, Begg J, Babeyko A, Cesca S, Moreno M. 2019. Breaking a subduction-termination from top to bottom: the large 2016 Kaikōura Earthquake, New Zealand. Earth and Planetary Science Letters. 506:221–230. doi: 10.1016/j.epsl.2018.10.020
- Nicol A, Khajavi N, Pettinga J, Fenton C, Stahl T, Bannister S, Pedley K, Hyland-Brook N, Bushell T, Hamling I, et al. 2018. Preliminary geometry, displacement, and kinematics of fault ruptures in the epicentral region of the 2016 Mw 7.8 Kaikōura, New Zealand, Earthquake. Bulletin of the Seismological Society of America. 108(3B):1521–1539. doi: 10.1785/0120170329
- Okada Y. 1985. Surface deformation due to shear and tensile faults in a half-space. Bull Seismol Soc Am. 75:1135–1154.
- Parsons T, Minasian DL. 2015. Earthquake rupture process recreated from a natural fault surface. Journal of Geophysical Research: Solid Earth. 120(11):7852–7862.
- Pettinga JR, Yetton MD, Van Dissen RJ, Downes G. 2001. Earthquake source identification and characterisation for the Canterbury region, South Island, New Zealand. Bulletin of the New Zealand Society for Engineering. 34(4):282–317. doi: 10.5459/bnzsee.34.4.282-317
- Pondard N, Barnes PM. 2010. Structure and paleoearthquake records of active submarine faults, Cook Strait, New Zealand: implications for fault interactions, stress loading, and seismic hazard. Journal of Geophysical Research: Solid Earth (1978–2012). 115(B12320):1–31.
- Power W, Clark K, King DN, Borrero J, Howarth J, Lane EM, Goring D, Goff J, Chagué-Goff C, Williams J, et al. 2017. Tsunami runup and tide-gauge observations from the 14 November 2016 M7. 8 Kaikōura earthquake, New Zealand. Pure and Applied Geophysics. 174(7):2457–2473. doi: 10.1007/s00024-017-1566-2
- Rattenbury MS, Townsend D, Johnston MR. 2006. Geology of the Kaikoura area. Institute of Geological & Nuclear Sciences 1:250000 geological map 13. 1 sheet + 70p. Institute of Geological & Nuclear Sciences. Report No:.
- Reyners M, Eberhart-Phillips D, Bannister S. 2017. Subducting an old subduction zone sideways provides insights into what controls plate coupling. Earth and Planetary Science Letters. 466:53–61. doi: 10.1016/j.epsl.2017.03.004
- Reyners M, Robinson R, McGinty P. 1997. Plate coupling in the northern South Island and southernmost North Island, New Zealand, as illuminated by earthquake focal mechanisms. Journal of Geophysical Research: Solid Earth. 102(B7):15197–15210. doi: 10.1029/97JB00973
- Stirling M, McVerry G, Gerstenberger M, Litchfield N, Van Dissen R, Berryman K, Barnes P, Wallace L, Villamor P, Langridge R, et al. 2012. National seismic hazard model for New Zealand: 2010 update. Bulletin of the Seismological Society of America. 102(4):1514–1542. doi: 10.1785/0120110170
- Tan F, Ge Z, Kao H, Nissen E. 2019. Validation of the 3-D phase-weighted relative back projection technique and its application to the 2016 M w 7.8 Kaikōura earthquake. Geophysical Journal International. 217(1):375–388. doi: 10.1093/gji/ggz032
- Ulrich T, Gabriel AA, Ampuero JP, Xu W. 2019. Dynamic viability of the 2016 Mw 7.8 Kaikōura earthquake cascade on weak crustal faults. Nature Communications. 10(1):1213. doi: 10.1038/s41467-019-09125-w
- Van Dissen RJ, Berryman KR. 1996. Surface rupture earthquakes over the last ∼1000 years in the Wellington region, New Zealand, and implications for ground shaking hazard. Journal of Geophysical Research. 101(B3):5999–6019. doi: 10.1029/95JB02391
- Van Dissen R, Yeats RS. 1991. Hope fault, Jordan thrust, and uplift of the seaward Kaikoura Range, New Zealand. Geology. 19(4):393–396. doi: 10.1130/0091-7613(1991)019<0393:HFJTAU>2.3.CO;2
- Wallace LM, Barnes P, Beavan J, Van Dissen R, Litchfield N, Mountjoy J, Langridge R, Lamarche G, Pondard N. 2012. The kinematics of a transition from subduction to strike-slip: an example from the central New Zealand plate boundary. Journal of Geophysical Research: Solid Earth (1978–2012). 117(B02405):1–24.
- Wallace LM, Beavan J, McCaffrey R, Darby D. 2004. Subduction zone coupling and tectonic block rotations in the North Island, New Zealand. Journal of Geophysical Research. 109(B12):B12406. doi: 10.1029/2004JB003241
- Wallace LM, Hreinsdottir S, Ellis S, Hamling I, D'Anastasio E, Denys P. 2018. Triggered slow slip and afterslip on the southern Hikurangi subduction zone following the Kaikōura earthquake. Geophysical Research Letters. 45:4710–4718. doi: 10.1002/2018GL077385
- Wallace LM, Kaneko Y, Hreinsdóttir S, Hamling I, Peng Z, Bartlow N, D'Anastasio E, Fry B. 2017. Large-scale dynamic triggering of shallow slow slip enhanced by overlying sedimentary wedge. Nature Geoscience. 10(10):765–770. doi: 10.1038/ngeo3021
- Wang T, Wei S, Shi X, Qiu Q, Li L, Peng D, Weldon RJ, Barbot S. 2018. The 2016 Kaikōura earthquake: simultaneous rupture of the subduction interface and overlying faults. Earth and Planetary Science Letters. 482:44–51. doi: 10.1016/j.epsl.2017.10.056
- Wannamaker PE, Caldwell TG, Jiracek GR, Maris V, Hill GJ, Ogawa Y, Bibby HM, Bennie SL, Heise W. 2009. Fluid and deformation regime of an advancing subduction system at Marlborough, New Zealand. Nature. 460(7256):733–736. doi: 10.1038/nature08204
- Williams JN, Barrell DJA, Stirling MW, Sauer KM, Duke GC, Hao KX. 2018. Surface rupture of the Hundalee fault during the 2016 Mw 7.8 Kaikōura earthquake. Bulletin of the Seismological Society of America. 108(3B):1540–1555. doi: 10.1785/0120170291
- Williams CA, Eberhart-Phillips D, Bannister S, Barker DHN, Henrys S, Reyners M, Sutherland R. 2013. Revised interface geometry for the Hikurangi subduction zone, New Zealand. Seismological Research Letters. 84(6):1066–1073. doi: 10.1785/0220130035
- Wilson CK, Jones CH, Molnar P, Sheehan AF, Boyd OS. 2004. Distributed deformation in the lower crust and upper mantle beneath a continental strike-slip fault zone: Marlborough fault system, South Island, New Zealand. Geology. 32(10):837–840. doi: 10.1130/G20657.1
- Xu W, Feng G, Meng L, Zhang A, Ampuero JP, Bürgmann R, Fang L. 2018. Transpressional rupture cascade of the 2016 Mw 7.8 Kaikoura earthquake, New Zealand. Journal of Geophysical Research: Solid Earth. 123(3):2396–2409.
- Xu X, Tong X, Sandwell DT, Milliner CW, Dolan JF, Hollingsworth J, Leprince S, Ayoub F. 2016. Refining the shallow slip deficit. Geophysical Journal International. 204(3):1867–1886. doi: 10.1093/gji/ggv563
- Zhang H, Koper KD, Pankow K, Ge Z. 2017. Imaging the 2016 Mw 7.8 Kaikoura, New Zealand, earthquake with teleseismic P waves: A cascading rupture across multiple faults. Geophysical Research Letters. 44(10):4790–4798. doi: 10.1002/2017GL073461
- Zinke R, Dolan JF, Rhodes EJ, Van Dissen R, McGuire CP. 2017. Highly variable latest pleistocene-holocene incremental slip rates on the Awatere fault at Saxton River, South Island, New Zealand, revealed by Lidar mapping and luminescence dating. Geophysical Research Letters. 44(22):11–301. doi: 10.1002/2017GL075048
- Zinke R, Hollingsworth J, Dolan JF, Van Dissen R. 2019. Three-dimensional surface deformation in the 2016 MW 7.8 Kaikōura, New Zealand, Earthquake from optical image correlation: implications for strain localization and long-term evolution of the pacific-australian plate boundary. Geochemistry, Geophysics, Geosystems. 20(3):1609–1628. doi: 10.1029/2018GC007951