
 ?Mathematical formulae have been encoded as MathML and are displayed in this HTML version using MathJax in order to improve their display. Uncheck the box to turn MathJax off. This feature requires Javascript. Click on a formula to zoom.
ABSTRACT
There are ongoing concerns about food security, particularly around food affordability and the nutritional quality of diets in New Zealand. While recent food price inflation has sparked conversations about overall affordability, less attention has been directed toward understanding how variations in price increases across different food categories might impact nutrition and health. Using data from Statistics New Zealand on the prices of 85 food items between 2014 and 2023, we estimated 12-month moving averages of relative real prices of sweetened foods vis-à-vis those of five other food categories: dairy, fruits, vegetables, processed meats, and unprocessed meats. Non-parametric Mann-Kendall tests and linear regressions were used to assess the trends in relative food prices. The data show that sweetened foods have become relatively inexpensive over this period. On the premise that both absolute and relative prices are important in determining dietary choices and that these choices impact health, we consider the possible negative implications of these trends. Possible reasons for the recent trends and policies to meet the challenges they pose are discussed.
Introduction
New Zealand, with a population of around five million, is renowned for exporting high-quality foods. The number of people its exports of dairy, fruit, and meat, seafood, and other proteins can feed far exceeds its population. It also imports grains sufficient to feed nine million people (Rush & Obolonkin, Citation2020). At the same time, concerns are being raised over food insecurity in the country, which stems mainly from insufficient incomes and financial hardship (Macaulay et al., Citation2022; Ministry of Health, Citation2019; Oyama et al., Citation2021). The recent surge in food prices has compounded the challenges of creating a food-secure nation.
The steep increase in food prices in New Zealand, brought about by a range of external and internal factors, including COVID-19 disruptions, geopolitical events and climate shocks, has received considerable media attention recently. This is unsurprising as food is a key component of overall household expenditure, and changes in food prices are readily observed. However, what has gone relatively unnoticed is the change in relative prices of specific types of food, specifically, the prices of fruits, vegetables, processed and unprocessed meats, and dairy relative to those of sweetened, processed, industrial foods. Changes in relative prices are more difficult to discern than absolute prices. A shopper may readily recognise a one-dollar increase in the price of a kilogram of apples or a chocolate bar but may not realise how the price of one has changed relative to the other. While absolute prices are conspicuous, relative prices can hide in plain sight and escape notice.
Escaping notice, however, is different from being inconsequential. Buyers need not be acutely aware that prices of vegetables have risen proportionally more than those of sweetened foods to shift their consumption away from greens to confectionery. They can apprehend such changes experientially while purchasing food. If prices of specific foods continue to remain high relative to those of others, households may become habituated to not consuming the expensive varieties and may adapt by switching to more affordable ones. And should these shifts engender a transition to unhealthy diets, over time, the consequences may be grave for consumers, healthcare systems, and the country’s fiscal health.
In this article, we illuminate the trends in food prices in New Zealand and show that the onset of the COVID-19 pandemic and the escalation of geopolitical tensions in Eastern Europe marked noticeable inflection points in their trajectories. Then, we discuss the implications of the recent changes in food prices for consumers, public policy, and the food industry and present reasons that may underlie recent food price trends. Last, we offer recommendations to address the potentially deleterious effects of the changes in relative food prices in the country.
Materials and methods
We examined the evolution of monthly weighted average prices across New Zealand of 85 food items between July 2014 and March 2023 collected from 560 retail outlets – supermarkets, greengrocers, fish shops, butchers, convenience stores, restaurants, and outlets selling breakfast, lunch, and takeaway foods – in 12 surveyed urban areas. These data were sourced from the Statistics New Zealand website (Statistics New Zealand, Citation2023a). We classified the items into six categories: dairy, fruits, vegetables, processed meats, unprocessed meats, and sweetened foods. The detailed list is presented in Appendix A.
We computed indices for the six categories by averaging the prices of their constituent items, dividing the result by the average price in July 2014, and multiplying the result by 100. The formulation is described in EquationEquation (1)(1)
(1) :
(1)
(1) where
denotes the index in period
of category
;
is the price of item
, belonging to food category c, in period t, and
is the number of items in category c.
Real food indices were calculated by deflating using the food price index constructed by Statistics New Zealand to measure changes in the prices that households pay for food (Statistics New Zealand, Citationn.d.). Accordingly, the real index
(2)
(2) where
is the real price index for category
in period
and
(3)
(3)
We defined in this fashion, i.e. by normalising the real food price indices such that they have a value of one in July 2014, the first month of the sample analysed in this study, to facilitate comparison over time and between categories. To be clear, whether one set of prices is higher than the other is irrelevant to this study; our goal is not to compare the absolute price of one category with another but to examine how the prices of different categories have evolved and, more importantly, how relative prices have changed over time.
To highlight the underlying trends in food prices, which their seasonal ebb and flow can mask, we also derived 12-month moving averages of nominal and real food price indices described in Equations Equation(1)(1)
(1) and Equation(2)
(2)
(2) . The moving averages for
and
were defined as
(4)
(4) and
(5)
(5)
respectively. To understand how prices of sweetened foods have changed relative to those of various food categories, we derived relative price indices
(6)
(6) where
denotes food categories other than that comprising sweetened foods, and
represents the real food price index for sweetened foods. Finally, we calculated the 12-month moving averages for the series described in EquationEquation (6)
(6)
(6) ; to quantitatively assess the trends in these moving averages, we used the non-parametric Mann-Kendall tests (Kendall, Citation1975; Mann, Citation1945). Regressions of the moving averages on linear time trends were also estimated to confirm the results.
Results
Notwithstanding the importance of studying real prices to remove the effects of inflation, discussing the nominal price indices is a good starting point. These are the prices households consider when shopping. They neither contemplate real nor relative prices. A typical shopping experience does not entail deflating nominal prices using a suitable measure to determine how expensive groceries are in real terms. Even if households were to attempt to estimate real prices, their perceptions of inflation might lead them astray. Data show that their perceptions of inflation do not align with reality; they consistently perceive inflation to be greater than it is (Reserve Bank of New Zealand, Citation2024). The six nominal indices, each representing a food category, are presented in .
Figure 1. Price indices of food categories. Note: The shaded area in this and the following figures represents the period after the onset of the COVID-19 pandemic.
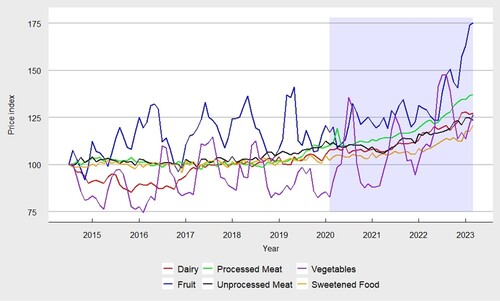
Fruit and vegetable prices stand out with their pronounced and unique seasonal patterns. Vegetable prices were significantly higher during July and August relative to December and January; fruit prices tended to peak in February and March and were the lowest during October and November. Such stark seasonality is not evident in any of the other series. Having moved closely up until 2017, the price indices of processed and unprocessed meats drifted apart after 2018, with prices of unprocessed meats rising more steeply than those of processed ones until 2020; this reversed after the onset of the pandemic when the increase in the price of processed meats outpaced that in the price of unprocessed meats. The prices of sweetened foods have remained the most stable and risen the least.
The monthly variations in food prices can mask the underlying trends. To bring these into sharper focus, we present the 12-month moving averages of the six price indices in . It bears emphasising that the precise timing of these changes should be interpreted cautiously. Because these are 12-month moving averages of the relative prices, the value in a specific month reflects the relative prices over the preceding 11 months and the month itself; for example, the average for January 2020 is calculated based on the data from February 2019 to January 2020.
Figure 2. Twelve-month moving averages of food indices.
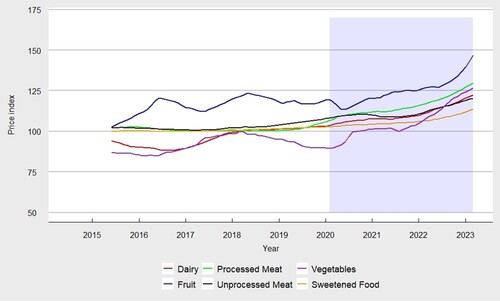
Three features of these moving averages are quite noticeable. First, prices, except for those of dairy, remained relatively flat until 2019; this is especially true for the prices of sweetened foods. Second, all prices increased after 2021, with dairy, meat, and vegetable prices having marked inflection points in 2021 and fruit prices in 2022. Third, fruit and vegetable prices increased the most steeply during 2021 and 2022 – this was driven, in part, by sharp increases in the price of natural gas, a critical feedstock for producing nitrogenous fertilisers (Vatsa et al., Citation2023). Natural gas and nitrogenous fertiliser prices surged to record highs in the third quarter of 2022, a few months after the escalation of the Russo-Ukrainian war in February of the same year.
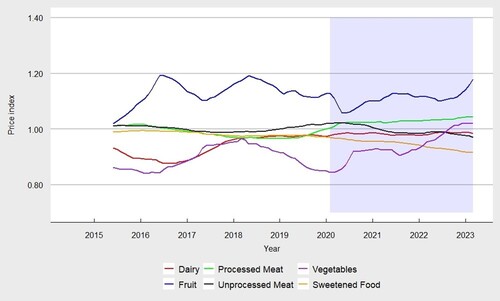
Next, we turn our attention to real prices estimated by deflating the nominal prices using the food price index. The 12-month moving averages of normalised real prices are illustrated in . While the nominal prices of sweetened foods started trending upward before the COVID-19 pandemic, their real prices have, in fact, consistently decreased over the past eight years. The real prices of dairy remained stable between 2018 and 2022. Furthermore, in real terms, unprocessed meats cost about the same in 2022 as they did in 2016. However, the real price of processed meats increased in 2019, whereas vegetables became considerably more expensive, climbing steeply in 2020 and 2022. Real prices of fruits increased in 2020, remained relatively stable in 2021, and increased again, relatively steeply, during 2022. Despite increasing since 2020, real fruit prices remained below the levels they reached in 2016 and 2018. Real fruit prices have risen less than real vegetable prices over the past two years.
Figure 3. Twelve-month moving averages of normalised real food prices.
The trends discussed above suggest that eating fruits and vegetables has become more expensive relative to eating sweetened foods. , showing the real prices of sweetened foods relative to those of the other food categories, confirms this. Once again, 12-month moving averages were considered to address the prominent seasonality evident in fruit and vegetable prices and to keep the exposition consistent across the five series. The data reveal a decline in the prices of sweetened foods relative to those of other food categories since the beginning of the pandemic. Prices of sweetened foods fell sharply relative to fruit and, especially, vegetable prices starting in 2020. Interestingly, prices of sweetened foods relative to dairy products and unprocessed meats began falling circa 2016 and 2017, respectively.
Figure 4. Twelve-month moving averages of relative real price of sweetened foods vis-à-vis other foods.
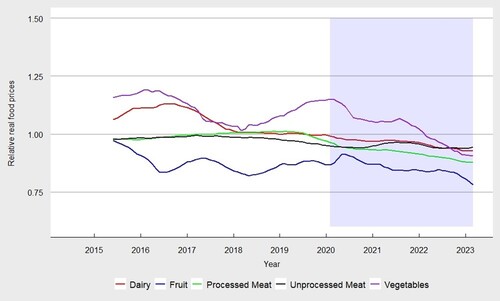
Results obtained from the Mann-Kendall tests reported in confirm the downward trends in the prices of sweetened foods relative to the prices of other food categories. In every instance, Kendall's statistic is negative, and the null hypothesis of the absence of a monotonic trend can be rejected at the 1% significance level. Separate linear regressions, with the 12-month moving averages as the dependent variables and a time trend as the independent variable, confirmed the results obtained from the Mann-Kendall tests. The coefficients of the time trend were negative and statistically significant at the 1% significance level in each of the five regressions.
Table 1. Mann-Kendall tests and linear regressions.
Discussion
The data are suggestive: it is becoming increasingly expensive to consume healthy diets in New Zealand; at the same time, with both the real and relative prices of sweetened, processed foods declining, they have become more affordable. These developments may contribute to entrenching poor dietary habits in the country, promoting the consumption of sweetened foods while reducing the intake of fruits, vegetables, and unprocessed meats. How challenging these dietary patterns prove will depend on their associations with health costs, mortality, morbidity, lost productivity, and quality of life. These associations will be influenced by whether and for how long the food price trends reported in this study persist.
There is clear evidence that food prices are integral to dietary choices (Andreyeva et al., Citation2010; Russell et al., Citation2022) and that these choices are closely related to the general economic situation of households. It has long been recognised in New Zealand that healthy diets are expensive. The more expensive the food, the less likely it will be consumed (Cornelsen et al., Citation2015). By the same token, reduced relative prices of sweetened, processed foods may increase their consumption, which, in turn, may widen the gulf between the health outcomes among different ethnic groups (Ni Mhurchu et al., Citation2013). Investigating the price elasticity of food demand among people of Māori, Pacific, and other descents, Ni Mhurchu et al. (Citation2013) found that food demand was more sensitive to changes in prices among low-income Māori people. Similar evidence has been reported for other countries.
Our results differ from those of Mackay et al. (Citation2019), who found that although food prices had risen over the ten years between 2007 and 2017, the rates at which prices of healthy and less healthy foods changed were not different. The discrepancies between our findings and those of Mackay et al. (Citation2019) can be explained by the differences in the data analysed and the food classification methods used. We have studied prices between 2014 and 2023. Thus, there is little overlap between the periods analysed in the two studies. Food price behaviour since 2019 has been markedly different from that between 2007 and 2017. Furthermore, there are differences between how foods are classified into different categories. For example, Mackay et al. (Citation2019) classified foods as healthy and less healthy; they also categorised foods according to the degree of processing. In contrast, we have classified foods into six categories: dairy, fruits, vegetables, processed meats, unprocessed meats, and sweetened foods.
Poor diets can lead to widespread health concerns. New Zealand can ill afford this. According to a New Zealand Health Survey, one in three adult New Zealanders was obese in 2020–2021. Childhood obesity has also been on the rise, increasing from 9.5% in 2019–2020–12.7% in 2020–2021 (Ministry of Health, Citation2021). Furthermore, the incidence of diabetes increased from 35.7 per 1,000 people in 2012–41.5 per 1,000 people in 2021 (Ministry of Health, Citation2023). What is more, the number of diabetics in the country is expected to increase by 70% – 90% over the next 20 years, and the annual cost of diabetes may rise from NZD 2.1 billion to NZD 3.5 billion over the same period (Diabetes New Zealand, Citation2021). Should the trend of rising relative affordability of sweetened, processed foods continue, healthy diets may become increasingly difficult to adopt, leading to higher rates of obesity and its attendant diseases, including type 2 diabetes, cardiovascular disease, and certain cancers (Avgerinos et al., Citation2019; Katta et al., Citation2021; Lin et al., Citation2020; Machado et al., Citation2020; Poti et al., Citation2017; Rauber et al., Citation2021; Sonnenburg & Bäckhed, Citation2016). This may present further challenges to the under-resourced New Zealand healthcare system, which is suffering from perennial staffing shortages and high workloads (Fenton et al., Citation2023).
Rising food prices can also drastically erode the purchasing power of low-income households that spend much of their incomes on food. This affects public health systems as health outcomes are closely related to income levels. Obesity and metabolic diseases are most prevalent among people who are least able to afford healthy diets. In high-income countries, poor diets disproportionately affect indigenous people and those in the lower economic strata (Australian Institute of Health and Welfare., Citation2020; Swinburn et al., Citation2011). New Zealand is no different. New Zealanders of European descent had the highest average annual household equivalised disposable income at NZD 55,446 during the year ending in June 2022; the number was NZD 54,870 for those of Asian descent. Pacific peoples were at the other end of the spectrum, earning NZD 43,897, and Māori earned NZD 46,579 (Statistics New Zealand, Citation2023b). These groups also had a strikingly higher incidence of obesity than New Zealanders of European ethnicity: it was 71.3% among Pacific peoples and 50.8% among Māori, compared to 31.9% among New Zealanders of European descent (Ministry of Health, Citation2021).Footnote1 Given their lower incomes, Pacific peoples and Māori may find it more challenging to afford and adhere to healthy diets due to the rising relative prices of fruits and vegetables. They may switch to consuming sweetened, processed foods, putting themselves at an even higher risk of diet-related chronic diseases.
The trends in relative food prices will have a stronger effect on dietary patterns if they persist. Fresh fruit and vegetable prices do fluctuate considerably, and we have seen periods of high prices before. While many countries have witnessed food price inflation during this period, the levels have recently begun to come down. However, New Zealand’s price inflation has been more stubborn than other countries (World Vision, Citation2024), suggesting there may be something different about the situation in New Zealand. The food supply chain in New Zealand may be particularly vulnerable to disruptions caused by extreme weather events because a focus on efficiency has led to increasing regional specialisation at scale. This means that relatively localised shocks may significantly impact supply; however, the vulnerability of the logistics network across New Zealand exacerbates this. Most freight travels by road, and many regions are served by only one or two main roads, which are often susceptible to weather events. Therefore, regional specialisation coupled with a vulnerable transport network makes the system less resilient to supply-side shocks. These shocks lead to higher prices for consumers than would be the case with a more resilient food system. Unless efforts are made to increase the resilience of our fresh produce sector, elevated and volatile prices may become the norm. The recent shortage of specific foods in the wake of cyclone Gabriel hitting key production areas and transport networks is a case in point.
The extent to which households respond to rising retail prices may vary. For example, changes in relative prices may have less impact on households that produce a significant proportion of their own requirements. In the Queenstown-Lakes region, for example, around 70% of survey respondents grew or made some of their own food at home (WAO, Citation2023). For many, though, the proportion is likely to be low, and the ability to produce enough to have a significant impact would be lower in more densely populated urban and other environments where nutritional challenges are likely to be the greatest. Investigating whether and to what extent households growing their own food increase food security and resilience of the food system would be an interesting area of future research.
Trade plays an important part in New Zealand’s food system, influencing both absolute and relative prices. The composition of New Zealand’s production (and exports) is markedly different from its imports (Rush & Obolonkin, Citation2020). For example, there is no sugar beet or cane production in New Zealand; therefore, the country is entirely reliant on sugar imports. In contrast, most fresh fruits and vegetables consumed in New Zealand are produced domestically (Soliman & Greenhalgh, Citation2020). Such differences mean that the factors affecting prices may vary considerably, leading to differences in price trajectories. For example, climatic events specific to New Zealand will have little impact on sugar prices (and, by association, products that use sugar) compared to fresh fruit and vegetables. These events may lead to an increase in prices of fruits and vegetables relative to sweetened foods. In addition, exports of a relatively small number of high-value crops (kiwifruit, apples, grapes for wine) have been growing. These crops compete for land with products aimed at domestic consumption, raising the cost of production and the final price.
Recently, the link between the structure of the food retail sector and rising food prices in New Zealand has come into sharper focus (Commerce Commission, Citation2022). New Zealand has one of the most concentrated retail sectors globally, with just two companies, Woolworths and Foodstuffs, accounting for the vast proportion of grocery spending. It has also been shown that food prices in the country are among the highest on average across the OECD (Commerce Commission, Citation2022). While the market structure may influence food prices in general, it does not explain the trajectory of prices identified in this study – the current structure has been in place for quite some time. However, in periods of rising costs, the pricing strategies of the retail sector may explain, at least in part, diverging prices.
Retail margins are often expressed as a percentage of the purchase price. In addition, higher margins are often placed on fresh fruit and vegetables for various reasons (for example, increased handling costs and potential waste). In periods of low inflation, this will have relatively little impact on relative prices. However, as inflationary pressures lead farm gate prices to rise, the absolute retail price of fresh produce will rise faster, increasing the difference between prices of different food categories. However, assuming a symmetrical response, if farm gate prices fall, it is likely that retail prices for these products will fall faster. However, there is evidence of asymmetry in fresh produce pricing, which may mean higher prices persist (Girapunthong et al., Citation2003).
A multifaceted suite of policies is needed to meet the challenges posed by the rising relative affordability of sweetened foods. Taxes on these foods may play an integral role in this endeavour. Sugar taxes have been shown to reduce the consumption of soft drinks (Andreyeva et al., Citation2022; Cornelsen et al., Citation2015; Fernandez & Raine, Citation2019). It is not surprising that more than 85 countries have administered taxes on sugar-sweetened beverages (WHO, Citation2022). The evidence for New Zealand, albeit based on a relatively small number of studies, suggests that a 20% tax on all carbonated beverages may postpone or avert 0.2% of all deaths in the country while raising NZD 40 million in taxes (Wilson et al., Citation2020).
A tax on specific food categories will not suffice. Given the significant cross-price elasticities of food items, taxing specific foods may increase the consumption of non-taxed foods. For example, focusing solely on taxing the main sources of dietary saturated fat is unlikely to reduce the incidence of cardiovascular disease, as the decrease in saturated fat consumption may be compensated by increased salt intake (Mytton et al., Citation2007). Combining sugar taxes, fruit and vegetable subsidies, and saturated fat taxes will likely yield better health outcomes (Blakely et al., Citation2020). Such policies may contribute to increasing the price of sweetened foods relative to the prices of fruits and vegetables. Using the revenue generated from taxing deleterious foods to subsidise the consumption of healthier varieties and other initiatives to improve diets and lifestyles is likely to have more impact.
Financial incentives and disincentives must be complemented by policies designed to change consumer preferences toward food. Food taxes and subsidies may address the symptoms (the decreasing affordability of a healthy diet) but not necessarily the causes of the issue. As noted earlier, the reduction in the prices of sweetened foods relative to those of fruits and vegetables may be occurring due to vulnerabilities in our food supply chain. As the frequency and severity of climatic and other shocks are increasing (Cottrell et al., Citation2019), there is a need to consider how we build resilience into the supply chains for fresh produce in particular. A range of alternatives have been put forward as to how this may be achieved. These include encouraging diversification of our food production systems, supporting regenerative agriculture, and policies that encourage a more local or regionally distributed food system. However, there is relatively little empirical evidence as to what these alternatives actually mean in terms of production costs, prices, and overall resilience. Further work is required to understand how different supply chain configurations may affect overall prices and their variability.
Conclusion
Within the context of a period of unprecedented shocks to food supply chains and increasing concern around food security, especially in terms of affordability and nutrition, this paper has investigated the recent evolution of food prices in New Zealand. The empirical analysis highlighted that within a period of overall food inflation, the trajectory of prices for different food groups has varied. In particular, the prices of foods that may be considered healthier, such as fruit and vegetables, have risen faster than other foods. The findings also show that sweetened foods have become relatively cheaper when compared to other food groups during this period. On the premise that both absolute and relative prices are important in determining dietary choices and that these choices impact health, the paper considers the possible negative implications of these trends.
While the paper did not attempt to establish causation formally, a number of possible factors are identified that could have been responsible, at least in part, for the trends identified in the study. These include differences between the extent to which products were produced domestically or imported, the vulnerabilities of our fresh food supply chain, disrupted global food supply chains due to the COVID-19 pandemic and the Russo-Ukrainian war, and the pricing strategies of supermarkets.
The potential for policies that attempt to redress the balance between the price of more and less healthy foods is articulated. These include taxing unhealthy foods and subsidising healthy foods. However, it is noted that for these to be effective in influencing diet and health, they need to be part of a multifaceted suite of policies. The need for policies that tackle the root cause of the differences in relative prices is also highlighted, including those that reduce the vulnerabilities in our fresh produce supply chains.
Our analysis groups various food items into six categories. Thus, it ignores the behaviours of prices within the categories. Also, we have not investigated how households have adapted to changes in relative prices, including the possibility that substitution occurs within as well as between categories. Further work, using scanner data, for example, can usefully analyse how the composition of shopping baskets has changed in response to the price changes witnessed over the last few years. This can provide more nuanced insights into the relationship between absolute and relative prices and household food consumption. In addition, establishing the causes of the variation in price trajectories between the different food groups could help determine the types of policies that best redress the balance and improve dietary choices and health in New Zealand.
Disclosure statement
No potential conflict of interest was reported by the author(s).
Notes
1 It should be noted that the suitability of traditional measures of obesity, such as the Body Mass Index (BMI), as health indicators for New Zealand’s ethnic populations has been questioned (Moharram et al., Citation2020; Rush et al., Citation2009).
References
- Andreyeva T, Long MW, Brownell KD. 2010. The impact of food prices on consumption: a systematic review of research on the price elasticity of demand for food. American Journal of Public Health. 100(2). doi:10.2105/AJPH.2008.151415.
- Andreyeva T, Marple K, Marinello S, Moore TE, Powell LM. 2022. Outcomes following taxation of sugar-sweetened beverages: a systematic review and meta-analysis. JAMA Network Open. 5(6):e2215276. doi:10.1001/jamanetworkopen.2022.15276.
- Australian Institute of Health and Welfare. (2020). Australia’s health 2022: burden of disease.
- Avgerinos KI, Spyrou N, Mantzoros CS, Dalamaga M. 2019. Obesity and cancer risk: emerging biological mechanisms and perspectives. Metabolism. 92:121–135. doi:10.1016/j.metabol.2018.11.001.
- Blakely T, Cleghorn C, Mizdrak A, Waterlander W, Nghiem N, Swinburn B, Wilson N, Mhurchu CN. 2020. The effect of food taxes and subsidies on population health and health costs: a modelling study. The Lancet Public Health. doi:10.1016/S2468-2667(20)30116-X.
- Commerce Commission. 2022. Market study into the grocery sector: final report. https://comcom.govt.nz/__data/assets/pdf_file/0024/278403/Market-Study-into-the-retail-grocery-sector-Final-report-8-March-2022.pdf.
- Cornelsen L, Green R, Turner R, Dangour AD, Shankar B, Mazzocchi M, Smith RD. 2015. What happens to patterns of food consumption when food prices change? Evidence from a systematic review and meta-analysis of food price elasticities globally. Health Economics. 24(12):1548–1559. doi:10.1002/hec.3107.
- Cottrell RS, Nash KL, Halpern BS, Remenyi TA, Corney SP, Fleming A, Fulton EA, Hornborg S, Johne A, Watson RA, Blanchard JL. 2019. Food production shocks across land and sea. Nature Sustainability. 2(2). doi:10.1038/s41893-018-0210-1.
- Diabetes New Zealand. 2021. The economic and social cost of Type 2 diabetes. https://healthierlives.co.nz/wp-content/uploads/Economic-and-Social-Cost-of-Type-2-Diabetes-FINAL-REPORT.pdf.
- Fenton E, Wild CEK, Derraik JGB, Grant C, Anderson Y. 2023. The need to nurture Aotearoa New Zealand’s healthcare workforce. The New Zealand Medical Journal. 136(1572):61–65.
- Fernandez MA, Raine KD. 2019. Insights on the influence of sugar taxes on obesity prevention efforts. Current Nutrition Reports. 8:333–339. doi:10.1007/s13668-019-00282-4.
- Girapunthong N, Vansickle JJ, Renwick A. 2003. Price asymmetry in the United States fresh tomato market. Journal of Food Distribution. 34(3).
- Katta N, Loethen T, Lavie CJ, Alpert MA. 2021. Obesity and coronary heart disease: epidemiology, pathology, and coronary artery imaging. Current Problems in Cardiology. 46(3). doi:10.1016/j.cpcardiol.2020.100655.
- Kendall MG. 1975. Rank correlation methods. 4th edn. San Francisco, CA: Charles Griffin.
- Kurz CF, König AN. 2021. The causal impact of sugar taxes on soft drink sales: evidence from France and Hungary. The European Journal of Health Economics. 22:905–915. doi:10.1007/s10198-021-01297-x.
- Lin X, Xu Y, Pan X, Xu J, Ding Y, Sun X, Song X, Ren Y, Shan P-F. 2020. Global, regional, and national burden and trend of diabetes in 195 countries and territories: an analysis from 1990 to 2025. Scientific Reports. 10(14790). doi:10.1038/s41598-020-71908-9.
- Macaulay GC, Simpson J, Parnell W, Duncanson M. 2023. Food insecurity as experienced by New Zealand women and their children. Journal of the Royal Society of New Zealand. doi:10.1080/03036758.2022.2088574.
- Machado PP, Steele EM, Levy RB, Louzada ML, da C, Rangan A, Woods J, Gill T, Scrinis G, Monteiro CA. 2020. Ultra-processed food consumption and obesity in the Australian adult population. Nutrition & Diabetes. 10(39). doi:10.1038/s41387-020-00141-0.
- Mackay S, Vandevijvere S, Lee A. 2019. Ten-year trends in the price differential between healthier and less healthy foods in New Zealand. Nutrition & Dietetics. 76:271–276. doi:10.1111/1747-0080.12457.
- Mann HB. 1945. Nonparametric tests against trend. Econometrica. 13(3). doi:10.2307/1907187.
- Ministry of Health. 2019. Household food insecurity among children: New Zealand health survey. health.govt.nz.
- Ministry of Health. 2021. Obesity statistics. https://www.health.govt.nz/nz-health-statistics/health-statistics-and-data-sets/obesity-statistics.
- Ministry of Health. 2023. Virtual diabetes register and web tool. https://www.tewhatuora.govt.nz/our-health-system/data-and-statistics/virtual-diabetes-tool/.
- Moharram MA, Aitken-Buck HM, Reijers R, Van Hout I, Williams MJA, Jones PP, Whalley GA, Lamberts RR, Coffey S. 2020. Correlation between epicardial adipose tissue and body mass index in New Zealand ethnic populations. New Zealand Medical Journal. 133(1516).
- Mytton, O., Gray, A., Rayner, M., & Rutter, H. (2007). Focusing solely on taxing the main sources of dietary saturated fat is unlikely to reduce the incidence of cardiovascular disease, as the decrease in saturated fat consumption is compensated by increased salt intake. Journal of Epidemiology & Community Health, 61(8). doi:10.1136/jech.2006.047746.
- Ni Mhurchu C, Eyles H, Schilling C, Yang Q, Kaye-Blake W, Genç M, Blakely T. 2013. Food prices and consumer demand: differences across income levels and ethnic groups. PLoS One. 8(10). doi:10.1371/journal.pone.0075934.
- Oyama S, Tautolo ES, Tukuitonga C, Rush EC. 2021. Pacific islands families study: adverse impact of food insecurity on child body composition. New Zealand Medical Journal. 134(1543.
- Poti J, Braga B, Qin B. 2017. Ultra-processed food intake and obesity: what really matters for health—processing or nutrient content? Current Obesity Reports. 6(4):420–431. doi:10.1007/s13679-017-0285-4.
- Rauber F, Chang K, Vamos EP, Louzada MdC, Monteiro CA, Millett C, Levy RB. 2021. Ultra-processed food consumption and risk of obesity: a prospective cohort study of UK biobank. European Journal of Nutrition. 60(4):2169–2180. doi:10.1007/s00394-020-02367-1.
- Reserve Bank of New Zealand. 2024. Household inflation expectations (H1). https://www.rbnz.govt.nz/statistics/series/households/household-inflation-expectations.
- Rush E, Obolonkin V. 2020. Food exports and imports of New Zealand in relation to the food-based dietary guidelines. European Journal of Clinical Nutrition. 74(2):307–313. doi:10.1038/s41430-019-0557-z.
- Rush EC, Scragg R, Schaaf D, Juranovich G, Plank LD. 2009. Indices of fatness and relationships with age, ethnicity and lipids in New Zealand European, Māori and Pacific children. European Journal of Clinical Nutrition. 63(5):627–633. doi:10.1038/ejcn.2008.15.
- Russell C, Whelan J, Love P. 2022. Assessing the cost of healthy and unhealthy diets: a systematic review of methods. Current Nutrition Reports. 11:600–617. doi:10.1007/s13668-022-00428-x.
- Soliman T, Greenhalgh S. 2020. Rethinking NZ’s food security in times of disruption. Policy Brief.
- Sonnenburg JL, Bäckhed F. 2016. Diet–microbiota interactions as moderators of human metabolism. Nature. 535:56–64. doi:10.1038/nature18846.
- Statistics New Zealand. 2023a. Food price index: April 2023. https://www.stats.govt.nz/information-releases/food-price-index-april-2023/.
- Statistics New Zealand. 2023b. Household income and housing-cost statistics: year ended June 2022. https://www.stats.govt.nz/information-releases/household-income-and-housing-cost-statistics-year-ended-june-2022/.
- Statistics New Zealand. n.d. Food price index. https://www.stats.govt.nz/topics/food-price-index.
- Swinburn BA, Sacks G, Hall KD, McPherson K, Finegood DT, Moodie ML, Gortmaker SL. 2011. The global obesity pandemic: shaped by global drivers and local environments. The Lancet. 378(9793):804–814. doi:10.1016/S0140-6736(11)60813-1.
- Vatsa P, Miljkovic D, Baek J. 2023. Linkages between natural gas, fertiliser and cereal prices: a note. Journal of Agricultural Economics. doi:10.1111/1477-9552.12532.
- WAO. 2023. Queenstown Lakes District Food Resilience Report. https://static1.squarespace.com/static/62e75a6654804f2488174b3d/t/64803e47b217631664f56a6e/1686126181936/Food+Resilience+Report+2023+FINAL.pdf.
- WHO. 2022. WHO manual on sugar-sweetened beverage taxation policies to promote healthy diets. https://www.who.int/publications/i/item/9789240056299.
- Wilson N, Morenga LT, Mackay S, Gerritsen S, Cleghorn C, Amanda C, Jones BS. 2020. Food taxes and subsidies to protect health: relevance to Aotearoa New Zealand. The New Zealand Medical Journal. 133(1511):71–85.
- World Vision. 2024. Price Shocks. https://www.wvi.org/sites/default/files/2024-03/Priceshocks 3-final.pdf.
Appendix
Table A1. Food classifications