
ABSTRACT
The COVID-19 pandemic caused a global disruption to higher education, especially in engineering education, where many teaching and learning activities are difficult or impossible to conduct online. This study examines the changes in the students’ experiences of this disruption using a 26-item process-oriented course experience questionnaire (CEQ) that was already in use in the Faculty of Engineering at Lund University (LTH), rather than a newly created pandemic questionnaire. This allowed results from spring 2020 to be compared with corresponding data for 2017–2019. Overall, the students expressed lower satisfaction with their courses, indicated they received less feedback and fewer valuable comments, and found it harder to understand the expectations and standards of work. On the positive side, students reported that assessment was less about facts and more about in-depth understanding. By gender, male students were overall more negative to the experience of online learning, whereas female students appeared better able to benefit from the shift to online learning. Our results show the great advantage of using a robust course evaluation system that focuses on students’ learning experience rather than satisfaction, and suggest a way of being prepared to systematically study the effects of possible future disruptions to higher education.
1. Introduction
Higher education rarely experiences a global disruption like the COVID-19 pandemic. Although major events (both positive and negative) occur on national, regional (i.e. #FeesMustFall, Potgieter et al. Citation2019), or institutional levels all the time, the sort of far-reaching impact of something like a global pandemic is almost inconceivable. Higher education, like many other sectors of society, clearly struggles to meet the basic level of pandemic readiness recommended by the WHO (World Health Organization Citation2009). One recommendation for achieving pandemic readiness is to consider and test ways of reducing social mixing. In Sweden, as in many other parts of the world, we found ourselves being forced to shift all teaching online with only three days’ notice in March 2020. Even if we could have conceived of purely online teaching, only a handful of us had ever had occasion to test it. In the context of engineering education, teaching and learning are characterised in part by hands-on teaching-and-learning activities that depend on physical interaction. Here, there is an inherent barrier to testing online alternatives, in part because of resistance among faculty (Vivolo Citation2016). And this resistance is not without warrant: although readiness is an admirable goal, which students should be given what is almost certainly a lower-quality learning experience in order to test alternatives? The consequence, it seems, is that engineering education, like much of the rest of society, had to improvise when the pandemic forced a shift online. Rather than implementing a prepared strategy for online teaching, we scrambled into what has been dubbed emergency remote teaching (Hodges et al. Citation2020).
As we approach the day when we can return to unrestricted campus teaching and learning, an important concern we should have is how to take lessons from this experience and use it to be prepared for an uncertain future. This means we need to study the effects of the pandemic, especially on student learning. But learning is a complex process that takes place inside the brains of students. As with any study of learning in any educational context, the more different types of data you can gather, the better the holistic picture of learning you will be able to build. What has been done so far shows many good ways of gathering meaningful data to help us understand the effects of the pandemic on student learning. We need all of these different types of data. Rather than attempting to give a state-of-the-art overview of the relevant literature on the effects of the pandemic, which would be outdated within weeks given the rate of publication in this area, we have gathered a cross-section of studies to illustrate some of the different ways authors are trying to understand the effects of the pandemic. We believe it is important to pay attention to methodology and the sources and types of data so that we can develop better readiness for the future.
From the teacher’s perspective, many publications offer theoretical advice on how to handle the situation (e.g. Bao Citation2020; Kahn and Jawaid Citation2020; Rapanta et al. Citation2020; Verawardina et al. Citation2020). Contributions like these are worth consideration and could form the basis for follow-up empirical studies. Other authors describe how they have actually adapted their strategies (e.g. Chick et al. Citation2020; George Citation2020) or how larger groups academic teachers have experienced the shift (i.e. Forslund Citation2020). In studies like these, we see an opportunity to gather more data and also to track the persistence and effects of changes over time, especially after the pandemic ends. Yet other publications discuss general national or international impact from the pandemic (e.g. Stokes Citation2020; Wyse et al. Citation2020), widening the perspective beyond single courses or institutional contexts. This is important for beginning to understand how the impact of the pandemic has varied across regions. One key theme across these studies is that teachers struggled to deal with much less interaction with students. In the shift to exclusively online interaction, teachers have found it difficult to motivate students, monitor their progress, clarify problems with understanding, offer feedback, or express general concerns and care during courses. These challenges likely have real consequences for students’ experience and learning.
Early in the pandemic, Sahu (Citation2020) rightly emphasized the importance of paying attention to the student experience. Given the urgency of the situation, the solution for many involved deploying new questionnaires that explicitly asked students about their experience. The most direct approach to creating a new instrument is to draw on observations and holistic impressions and use good judgement (e.g. Chen, Kaczmarek, and Ohyama Citation2020; Dietrich et al. Citation2020; Tigaa and Sonawane Citation2020; Asgari et al. Citation2021). Authors like Buttler, George, and Bruggemann (Citation2021) had time to test their questionnaire in a pilot study, but noted that previous literature on emergency remote teaching was not yet available to use as a foundation for their approach. One way to circumvent this challenge is to draw upon an existing conceptual framework related to the problem and use it to inform the design of the instrument (e.g. Hattingh et al. Citation2020; Jeffery and Bauer Citation2020; Refae, Kaba, and Eletter Citation2021). Another is to use or adapt an existing instrument (e.g. Baber Citation2020; Cinar, Ekici, and Demir Citation2021; Tang et al. Citation2021). These two approaches are common when breaking new ground in research, but require a certain level of prior knowledge to be feasible and credible.
In some cases, circumstances allowed authors to implement questionnaires to make comparisons of student experiences before and after the shift to online learning. For example, Revilla-Cuesta et al. (Citation2021) acted quickly to create a questionnaire about the students’ learning experience that they administered to students during the first week of online classes (to assess experiences of face-to face learning) and again at the end of the term (to assess online learning), and then compared results. Knudson (Citation2020) had previously developed a concept inventory for student learning in his subject, biomechanics, which he deployed both at the start of online learning (to test learning from face-to-face instruction) and at the end (to compare online learning), coupled with an end-of-term questionnaire. In a slightly different approach, Stewart, Miertschin, and Goodson (Citation2020) had conducted a study of student time-management skills before the pandemic began, but wrote their article during the pandemic, and so framed it in terms of what their results meant for the pandemic.
Although questionnaires offer the possibility of quickly and easily gathering large amounts of data, it is difficult to create good questions and the results can be difficult to interpret. Interview and mixed approaches take more time yet generally yield richer data. Two examples of interview studies of student experiences during the pandemic are Mucci-Ferris, Grabsch, and Bobo (Citation2021) and Eberle and Hobrecht (Citation2021), both of which conducted semi-structured interviews with students to understand challenges and opportunities. In two ways to mix interviews with questionnaires, Klein et al. (Citation2021) used semi-structured interviews to inform the development of their questionnaire, while Parker, Hansen, and Bernadowski (Citation2021) chose participants and the focus for their semi-structured interviews based on the results of their questionnaire. These are only a few examples that illustrate the value of interviews in their own right or as complementary to questionnaires.
All of these studies use data sampling methods that were developed and/or introduced after pandemic-related restrictions were instituted. Although this approach is better than nothing under the circumstances, it does create an inherent problem for making meaningful comparisons before and after the shift to emergency remote teaching. Newly created and/or implemented instruments lack pre-pandemic data, or, if it was possible to gather baseline data right at the start of the pandemic, they still represent a new activity for students, which can affect the results.
However, luck and/or clever thinking allowed some authors to use existing instruments and/or data to study the effects of the pandemic on students. For example, Rodriguez-Núñez and Leeuwner (Citation2020) used their existing course evaluation instrument with some modified questions to look at their students’ experiences. Elmer, Mepham, and Stadtfeld (Citation2020) compared 2020 results of an existing nation-wide student survey to results from two previous years to gain insight into how the shift to online learning had affected students’ mental health and social networks. Millar et al. (Citation2021) forewent asking students for their perceptions altogether, and instead used engagement analytics from their learning management system to explore correlations between student study behaviour and student achievement during the first period of online learning. Finally, Gonzalez et al. (Citation2020) were able to actually compare students’ academic performance in 2019/20 to corresponding cohorts in the two previous academic years, as a way of examining the effects that the disruption of campus learning and shift to online learning had on students’ learning.
The benefit of these latter examples is that they avoided adding another disruption to the students’ experience in order to gather data. This is the strategy we have employed in our study. In our institution, the Faculty of Engineering at Lund University (LTH), we have been using the same course evaluation system for more than fifteen years. As we will describe in more detail in the next section, it is a research-based instrument that asks students how they experience features of courses that are known to influence the quality of learning (Ramsden Citation2005), instead of asking them about their satisfaction with various aspects of the course. Despite all the biases associated with student evaluations of teaching, it has been argued that students can provide meaningful report on their experiences (Darwin Citation2017).
Our study uses this existing instrument to compare students’ self-reported experiences in traditional campus-based teaching and emergency remote teaching during the COVID-19 pandemic. In it, we explore the following three questions:
How do the students’ reports of their experience compare in courses before and after the transition to emergency remote teaching?
What implications did the transition to emergency remote teaching have for aspects of teaching that affect the quality of student learning?
What differences, if any, are there in the way that male and female students experienced the transition to emergency remote teaching?
To answer these questions, we have compared data from course evaluations for the same courses taught during the period March to end of May 2017–2019 with the same period in 2020, when all campus teaching was suddenly moved online. This direct comparison is possible because the course evaluation instrument is the same for all courses that use it. The analysis uses data from a total of 11,329 respondents from 2017–2019 and 3,490 respondents in 2020 (). Approximately 80% of the responses are from to first-cycle courses (bachelor’s level) in engineering and architecture, and the remaining 20% come from second-cycle courses (master’s level). In our analysis we are aware of two things: 1) the course evaluation data used only shed light on a subset of aspects of students’ learning experience; and 2) that the students’ self-reported learning experience is not a direct measure of student learning. As we will explain in more detail in our discussion of the gender differences we found in our data, we had good reason to believe that male and female students would report different experiences in the shift to emergency remote teaching.
Table 1. The number of surveys that form the bases for the analysis. The response rate was 35% 2017–2019 and 30% 2020.
We believe that what sets our study apart from much of what is being published about the effects of the pandemic on teaching and learning in engineering is that we use data obtained from a questionnaire already in use in our context, rather than using a newly created instrument. This allows us to get quite close to a genuine before-and-after study. The instrument itself is also important because it is deliberately designed to gather data about how students have experienced important aspects of teaching and learning, rather than gathering data about student satisfaction. As we will argue, we think this is an important consideration for making good choices about such instruments as course evaluations even during non-pandemic times. Finally, the volume of data we have access to makes possible meaningful statistical analysis, which is important if variations in the data are relatively small.
2. Research method
2.1. Context
This study uses data from the Faculty of Engineering at Lund University (LTH). Lund University as a whole is a research-intensive university in Sweden that typically appears among the top 100 in global rankings. As a faculty, LTH comprises approximately 6,000 full-time equivalents of first- and second-cycle students and 800 academic staff with teaching and research responsibilities. Engineering education makes up 90% of the teaching, with the remaining 10% being in architecture and industrial design. Courses usually range in size between 25 and 200 students. The students usually have at least 20 contact hours on campus per week, fairly equally distributed between lectures, small-group tutorials, and a wide range of laboratory, project, and other practical work. The students are thus used to a lot of campus instruction and class time spent with peers and teachers. Digital resources are abundant but online teaching has historically been very rare.
The academic year at LTH is divided into four study periods, each with eight weeks of teaching and a week for exams. By government order, all campus teaching at universities in Sweden was abruptly shut down in the middle of March 2020, which was the middle of the exam week for study period 3 at LTH. This gave teachers for all courses in study period 4 only three working days to transform their courses to run online, and students the same amount of time to prepare to adapt their learning strategies.
2.2. The Course Experience Questionnaire
Since 2004, LTH has used the Course Experience Questionnaire (CEQ) in all courses that have more than 25 registered students. The questionnaire is distributed online and is open during a three-week period, before and after the final exam. The information generated by CEQ is jointly processed in several steps by the students, teachers, and program directors, with the aim of improving student learning (Roxå et al. Citation2021).
Conceived by British and Australian researchers, the CEQ is designed to measure key aspects of the quality of students’ learning experiences (Ramsden Citation1991; Wilson, Lizzio, and Ramsden Citation1997; Ramsden Citation2005) and is built on the concept of student approaches to learning (Marton and Säljö Citation1976; Marton and Booth Citation1997; Ramsden Citation2005). Students are asked how they experience features in a course that encourage either deep or surface approaches to learning. The CEQ is therefore a proxy for measuring meaningful aspects of the teaching that affect student learning, and does not measure learning outcomes per se. Although the concept of deep and surface approaches to learning has been subject to critique (e.g. Howie and Bagnall Citation2013), it does still offer a useful heuristic for thinking about student learning behaviour. As a result, a clear strength of the CEQ is that its design is transparent and well grounded in educational research. Several independent studies have also confirmed the statistical reliability of the scales (e.g. Jansen, van der Meer, and Fokkens-Bruinsma Citation2013; Ali and Dodeen Citation2020). At LTH, the translation of the information provided by the CEQ about students’ learning experiences into changes in course design and teaching and learning activities is aligned with and supported by an extensive professional development program (Roxå et al. Citation2021).
The LTH version of the CEQ contains 26 items (see ) which fall into three main categories. The first category addresses the teaching process in four different scales: Good Teaching (GT, six items), Clear Goals and Standards (CG, four items), Appropriate Assessment (AA, four items) and Appropriate Workload (AW, four items). The second category involves students’ self-assessment of their learning in selected Generic Skills (GS, six items) that are common learning outcomes in the courses given at LTH. The third category includes two overall items: one for the students’ overall satisfaction with the course (item OS), and one for the students’ perception of the course’s importance for their education (item IE). The students respond on a 5-level Likert scale ranging from the endpoints Fully disagree (coded as −100) to Fully agree (coded as +100) with no labelling in words of intermediate alternatives. The middle alternative is considered as Neutral and coded as 0. This way of showing the CEQ scores has been in use since the CEQ was introduced at LTH in 2004 and is intended to help avoid overly quantitative, or simply erroneous, interpretations of the scores, such as ‘3 is twice as good as 1.5’, if the Likert scale were instead coded as 1–5. Given that the CEQ is designed to capture aspects that favour a deep approach to learning, each item has a distinct ‘better’ or ‘worse’ dimension. In addition to the 26 items, the students are also asked for contextual data. The overall response rate was 35% for 2017–2019 and 30% for 2020. Although this rate may seem low, Borrell and Gudmundsson (Citation2009) have shown that this subsample is still representative for the student body as a whole.
Table 2. List of items in the CEQ. Items in italic are negatively phrased in the CEQ, hence the scores are reversed in the analysis. Items OS and IE do not belong to a scale, and the latter is endemic for LTH. The scales Good Teaching, Clear Goals and Standards, Appropriate Assessment and Appropriate Workload include items that ask for students’ experiences of aspects of the teaching process, while Generic Skills prompts for a self-evaluation of learning.
The questionnaire is only one component in the evaluation process. Based on the CEQ data, a working reportFootnote1 is prepared that includes both survey data (means and distribution of scores, scores stratified according to overall satisfaction, etc.), and contextual data (student gender, extent of participation in course activities, response rate, passing rate). Free-text comments on what students appreciated about the course and what is most in need of improvement are also included, but only after being vetted independently by students appointed by the student union. The working report is distributed to the teacher(s), the student representatives for the course, and the program director, and is discussed among all parties together at a half-hour lunch meeting, typically five weeks after the course. This meeting is an opportunity for the different stakeholders to engage in a meaningful dialogue about their interpretations of factors influencing student learning, as well as their personal experiences with the course and additional data collected through formative measures. The three parties each independently write a brief response to the survey data and other information, including suggested changes to be made to course design and teaching. These responses form part of the final course evaluation report together with the statistical results, but not including individual students’ free-text comments. Since national regulations require that students be informed about the outcome of the evaluation, the final report is emailed to all students registered in the course and uploaded to the faculty’s intranet, where heads of department, senior managers, and other interested stakeholders within the faculty can access it.
2.3. Analysis
Campus (pre-COVID-19) and online teaching and assessment formats employed in the start of the pandemic were compared by testing for statistically significant changes in the students’ CEQ scores on the different items in the survey, using combined data from the three previous years (2017–2019) as a reference. This choice of a three-year reference period involved a balance. We know that there is a slight positive trend in some scales (e.g. about 1.2 units per year for the Good Teaching scale over the past fifteen years) which speaks against using too many years for reference. However, results on the CEQ can vary from study period to study period and from year to year because of a wide variety of disparate factors, which speaks against using too few reference years. We chose to look at three reference years as a way of compromising between these two considerations.
Any conversion of a qualitative rating on a Likert scale to a number in order to do statistical analysis will involve trade-offs. All CEQ results at LTH are presented on a scale from −100 to +100. We chose to retain this scale in our analysis in order to be consistent with local praxis and to allow our results to be more easily interpreted within our own context. Given that a) the original data is from a Likert scale with an inherently arbitrary interpretation and b) we can make no assumptions about the nature of the distribution of scores (e.g. a normal distribution), we chose a non-parametric statistic Wilcoxon signed-rank test as hypothesis test method for the analysis. The MATLAB implementation of the Wilcoxon method compares two independent samples to assess whether their population mean ranks differ. In our analysis, we primarily investigate if the means of scores of different CEQ items differ or not, i.e. if there is a change from the reference years to 2020. But since each item is different in nature, we cannot for example assume that equal changes in scores of two items also have equal positive or negative pedagogical implications. The different items may also have different resistance to change, which calls for conservative interpretations when comparing item scores. However, for a given item it is reasonable to compare how the total cohort has scored relative to subcategories female and male students.
The number of surveys each year is shown in , together with the gender distribution. With 26 items this would result in a maximum of 294,554 scores for 2017–2019 and 90,740 scores in 2020. However, since not every student provides scores on each and every item there are losses in data. They range from 3.3% (2017–2019) to 4.0% (2020). also shows that there is a loss with respect to gender, since 8-9% of the students do not identify as, chose not to indicate, or simply missed indicating whether they were female/male. Our instrument does not currently have non-binary gender options or a ‘do not wish to indicate’ option, but we are in the process of addressing this issue. Our instrument currently uses the terms male/female, and so will we in this article, but we recognise that students’ answer to this question should be interpreted as the gender to which they belong (man/woman), and not biological sex.
The statistical significance of a given change will be lower when subsets (e.g. female/male) are analyzed than if all surveys are pooled (given that the variance in each sample is the same), simply because the sample size decreases. Correspondingly, even if the change in CEQ score between 2017–2019 versus 2020 is smaller for the total student cohort than for the male students, for example, the statistical significance of that change may still be higher than the statistical significance of the change in the scores by the males.
This study also tests whether the differences in response from 2017–2019 to 2020 between the two gender categories are statistically significant. This was done by taking the vectors of responses (specific to each gender and item) from 2020 and reducing each value by the corresponding mean value of change from the period 2017–2019. If the adjusted vectors of responses differ significantly, it is safe to say that male and female students have diverged in their opinions when going from campus to online teaching for a given item. However, since such a test cannot be carried out using Wilcoxon signed-rank test, a traditional t-test was used instead.
3. Results
As displayed in , the Wilcoxon signed-rank test shows that for the total student cohort, nine items (GT2, GT4, CG3, CG4, AA4, AW2, GS3, GS5, GS6) show highly significant changes (p value < 0.01, ***), two items (OS, CG1) show significant changes (p value < 0.05, **) while three items (GT1, AA3, AW1) show weakly significant changes (p value < 0.1, *).
Table 3. Significance of change between the campus teaching period 2017–2109 and the distance teaching period 2020. Significance levels are *** (p < 0.01), ** (p < 0.05) and * (p < 0.1). A positive index (+) denotes an improvement from 2017–2019 to 2020, and a negative one (–) denotes a worsening in score in 2020 relative to 2017–2019.
As an example of change in means, the mean score of item OS (overall satisfaction) was 41.9 for 2017–2019 versus 38.9 in 2020. This change in means of −3.0 is **-significant with a p value of 0.017.
shows the changes in means between the reference period 2017–2019 and 2020. The largest changes refer to work in groups (item GS3) with a change in CEQ score of −9.4 and whether the students were ‘given enough time to understand the things [they] had to learn’ (AW2) with a change of +5.3.
Figure 1. Means of change in CEQ scores (filled circles) from 2017–2019 to 2020, together with means of change for male and female students respectively. Item numbers refer to CEQ questions shown in . Significance levels are *** (p < 0.01), ** (p < 0.05) and * (p < 0.1).
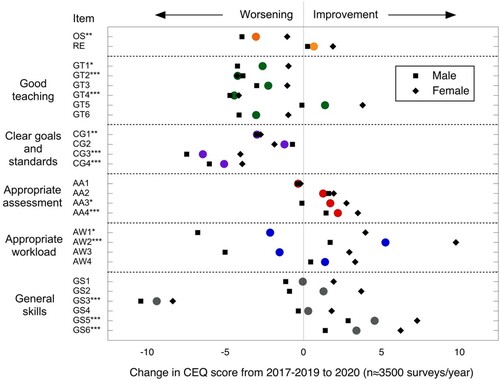
The scale that most obviously is linked to the activities of the teachers is the Good Teaching scale (items GT1 to GT6). The Good Teaching scale score decreased by 2.5 (from 25.4–22.9) from 2017–2019 to 2020. These changes were significant at the ***-level (p value 0.0018).
also shows the means of change for male students (solid black square) and female students (solid black diamond). With only one exception, GT2, the means of change are more positive or less negative for female students than for the male, which means that the male students experience less positive or more negative changes when going from campus teaching to online teaching.
The means of change for the total cohort are generally closer to the ‘male’ data point for two reasons. One is that there are more male students, and another is the influence of the students that have not indicated gender. These students are systematically more negative to the change from campus to online teaching than either of the male and the female students, which tends to push the means slightly to the left. For item AA2, the overall mean of change is actually lower than either of the means for male and females, respectively.
shows the difference between male and female students for the reference period 2017–2019 and for 2020, as well as whether the changes of the two genders are significantly different from each other. Using a simple t-test, three items (AA1, AA2, AA3) show highly significant changes (p value < 0.01, ***), two items (GS2, GS6) show significant changes (p value < 0.05, **) while two items (items GT5, GS5) show weakly significant changes (p value < 0.1, *). The overall variability of the CEQ scores were almost identical among male and female students.
Table 4. Comparison of CEQ scores for female and male students, as well as changes in CEQ scores between 2017–2019 and 2020. The icons (♀, ♂) indicate which gender that scores most positively 2017–2019 and 2020, respectively. Significance levels are *** (p < 0.01), ** (p < 0.05) and * (p < 0.1).
Finally, we tested whether the global changes in all CEQ scores combined differed between the genders. We found that for all items combined, the average CEQ score of the female students improved by 0.83 (from 28.26), while the average CEQ score of the male students decreased by 2.07 (from 30.03). This difference between genders was highly significant (p value < 10−10).
4. Discussion
In our analysis, we were able to see a range of interesting results both for the whole data set and for different genders. As with any self-reported results like course evaluations, it should be stressed that it is not possible to directly translate changes in CEQ data to changes in student learning. What we can say is that many aspects that support a deep approach to learning have suffered in a shift to online teaching that did not allow time for proper planning, and this affected the entire student population. However, exactly what changed and how is something that varies across the data.
4.1. Item- and scale-specific trends for all students
There are a number of interesting results to be found in each of the scales on the CEQ and for individual items within those scales. On the Good Teaching scale, the only item that showed a positive mean of change was GT5: ‘my lecturers were extremely good at explaining things'. By contrast, the other five items showed a negative mean of change, with the two items dealing with useful feedback and comments (items GT2, GT4) showing both the most negative and the most statistically significant results. To us, this indicates that the teachers were not able to reach out to the students as effectively as they normally can when they regularly meet on campus in lectures, seminars, and tutorials. Because meaningful feedback is strongly related to student learning (Hattie Citation2012), these results suggest that student learning suffered overall as a result of moving to online teaching. Normally, items GT2 and GT4 show scores among the bottom three of all items in the CEQ, suggesting that going online made an unsatisfactory situation even worse. We also see a negative change in motivation (GT1), which is an affective factor in learning. The overall picture we see when looking that the Good Teaching scale is that although teachers were able to maintain or even improve unidirectional communication when rapidly shifting from regular to emergency remote teaching, dialogue with and between students suffered. This is in line with national picture of student experiences painted in SFS (Citation2020), which also found that students felt information transfer about content from teachers to students was relatively unaffected, while two-way communication was strongly negatively affected.
Three out of four items on the Clear Goals and Standards scale also scored lower in 2020 than 2017–2019, suggesting that the teachers were not as effective in conveying expectations when they did not have the students in front of them. This is in line with the observations reported by Stenliden et al. (Citation2020). The lack of subtle two-way communication that serves to negotiate what defines quality in a certain course may well be the reason for this. Another contributing factor may have been the fact that the students worked more in isolation, as they normally help each other to decode and interpret written and oral, explicit and implicit information about requirements when they work on campus (Elmer, Mepham, and Stadtfeld Citation2020; SFS Citation2020).
Regarding assessment, the CEQ data indicate students experienced a shift towards less focus on facts and more focus on in-depth understanding (items AA3 and AA4). Normally at LTH, first-cycle (undergraduate) courses end with a four-to-five-hour closed-book written exam that almost exclusively decides the students’ final grades. The general format is defined in the formal course syllabus, which is revised annually. As supervised exams on campus could not take place, the faculty management offered teachers leeway in designing exams, which allowed for the use of open-book exams online, provided that the changes were approved and documented within departments. In discussions we have had with teachers during the pandemic, many tell us that they used this opportunity to tweak the format of the exam in favour of a broader take on the course content, testing for more than merely the ability to solve standard engineering calculation tasks. Arguably the changes in scores of items AA3 and AA4 can be attributed to changes in the design of the exams, but a more thorough analysis beyond anecdotal information is needed.
The effect of the changes on experienced workload are less obvious. It is interesting to note that the students indicated that they had more time (item AW2) but still felt more pressure (item AW3). We may argue that the former item refers to an objective condition, while the latter integrates many aspects that are closely linked to Good Teaching and Clear Goals and Standards, falling mainly in the affective domain.
The discussion above has referred to items and scales related to the teaching process. In contrast, the items on the General Skills scale (GS1 to GS6) reflect the students’ perception about what they have learned or developed during course. The students indicate that they have developed stronger individual skills such as written communication and ability to plan their work, while learning teamwork has suffered. Given that studying during the pandemic has been more of an individual activity than a group one, these results make sense.
In summary, we can make the following statements for the student cohort as a whole:
The students expressed less overall satisfaction with their courses.
The students feel they have received less feedback and fewer valuable comments, and have probably been less motivated.
The students found it harder to understand expectations, including the standards of work.
The assessment has been less about facts and has had a tendency toward more focus towards in-depth understanding.
The students have had more time for understanding, but still there is an indication that the workload may have become heavier.
The students have developed their ability to plan their work as well as their writing skills, but the learning of teamwork skills has certainly suffered.
We consider our results to confirm and deepen what has started to emerge in the literature (Elmer, Mepham, and Stadtfeld Citation2020; Erickson and Wattiaux Citation2021; Savage et al. Citation2020). According to students, emergency remote teaching in the spring of 2020 resulted in much less social interaction, with increased confusion about standards expected and a decline in general wellbeing. In our case, this is arguably due to shortcomings in available technology, or in teachers’ limited ability to rapidly transfer courses into online mode, or both. We expect both these limitations to decrease in significance over time.
4.2. Gender differences
For the whole data set, the CEQ results indicate that the students’ overall experience was generally poorer after the rapid transition to online teaching. However, if we use the contextual data to divide the results by gender, it is possible to gain a better understanding of differences in the way men and women in the student population experienced this transition. As we will discuss in this section, based on improvements on certain CEQ items for female students in 2020, it appears that female students felt they were at least partly able to turn the situation to their advantage.
It is important to note at the outset that there is precedent for gender differences in CEQ results at LTH. As shown in , there were pre-existing significant differences between female and male students on 17 out of 26 items in 2017–2019. Male students were more positive regarding overall satisfaction, clear goals and standards, and workload. Female students were more positive regarding relevance for their education, appropriate assessment, and how the courses helped them to develop skills related to groupwork, written communication, and ability to plan their work.
Looking at all the quality aspects captured in the 26 items of CEQ, the female students express a much more favourable / less negative view of the changes from 2017–2019 to 2020 as compared with their male counterparts. As shown in , on 24 items out of the 26 the change in scores of the male students were either more negative or less positive than the female students’ scores. The exceptions are items GT2 and CG2. This means that the conditions in 2020 either evened out or amplified pre-existing differences in experience between female and male students.
The most highly significant (p < 0.01) differences are related to the Appropriate Workload scale, for which gender differences that appeared in 2017–2019 were evened out in 2020. While male students in 2020 indicated they experienced a higher workload and greater pressure than male students in 2017–2019, the female students indicated the opposite. The females also indicated that they felt they were given more time to understand the things they had to learn, while the male students did not indicate a change relative to 2017–2019. Regarding skills development, the female students’ responses show a more positive view of going online on their development of individual skills (analytical skills, written communication, ability to plan their work) than was expressed by their male peers.
These results suggest that female students felt significantly better at coping with the transition from campus to online. One way to explain this is to infer that they tend to organise themselves better and plan to make better use of their time, which presumably helps them manage the external pressure they may feel. This could be linked to conscientiousness, a personality trait that involves self-discipline, efficacy, orderliness, and aim for achievement, and is positively correlated with academic performance (Chamorro-Premuzic and Furnham Citation2003; Rosander, Bäckström, and Stenberg Citation2011). There are studies that suggest that female students, at different levels of education, tend to exhibit a higher degree of conscientiousness than male students (cf. Duckworth and Seligman Citation2006; Kling, Noftle, and Robins Citation2012; Keiser et al. Citation2016). In the situation of more individual studies at home and fewer interactions with other students, well-developed conscientiousness may well have offered an opportunity to offset the loss of in-person interactions with teachers and peers. This line of argument is consistent with a previous study at LTH that showed that on average, female students outperform male students in most programs at LTH (Hell Citation2013). We do not wish to read too much into these patterns, since they are general and could depend on any number of factors that we cannot account for in our analysis. However, differences of this sort are interesting.
To understand the gender differences in changes in CEQ scores we may also turn to the theory of self-regulated learning. As defined by Pintrich (Citation2004), self-regulated learning follows a cycle of planning, monitoring, controlling, and regulating the learning process. It is fair to hypothesise that effective self-regulation would help students at LTH handle the disruption they experienced in 2020 and that gender differences in self-regulation could help to explain why there are differences in CEQ scores between male and female students. Indeed, Virtanen and Nevgi (Citation2010) found evidence that female students in technology do better at collaborating and using help-seeking strategies than their male counterparts. If these results are applicable to LTH, we could infer that one way that female students may have managed the crisis better was by independently (that is, outside of organised teaching) turning to their peers to a higher degree than the male students.
Despite the large number of differences between genders in the CEQ results, there are also two groups of items where male and female students fully agree. The first group includes items dealing with communicative aspects: lack of comments and feedback, and difficulties in knowing expected standards of work (items GT2, GT4, CG1). The second includes items dealing with characteristics of the assessment (items AA1, AA2). We interpret this to mean that some changes in teaching can in fact be evaluated fairly objectively by the students even if different genders may have different appreciation of these aspects. This may also point to a strength in the wording of at least these CEQ items, since the wording of all CEQ items was carefully chosen when the instrument was designed.
A clear benefit of using this particular course evaluation instrument is that in addition to revealing subtle differences in students’ reported experiences in the shift to online teaching, it also allows us to identify differences in how men and women in the student population experienced particular aspects of this shift. Our results clearly indicate the importance of considering gender differences when looking at the effect of campus shutdown on teaching quality and student learning experiences. At the same time, the quite high and very similar coefficients of variation in the range of 34% for both gender categories clearly shows that we should also be cautious about drawing general conclusions for genders.
4.2. Relationship to other kinds of data
We have already looked at gender differences in the CEQ data, but our instrument’s contextual data allows for other groupings as well. For example, we plan to look deeper into changes in the students’ experiences of learning depending on year of studies and the character of the course. If we look beyond just the CEQ data, one point of comparison is student records of passing rates for final assessments at LTH. The shift to online learning clearly created important challenges for students, and the overall decline in student ratings on the Good Teaching scale could lead us to expect poorer student outcomes. Given that most courses at LTH are formally assessed using one or more forms of summative assessment at the end of the course, the passing rates for final assessment are indicative of overall student results at LTH. We often see higher participation in final assessment tasks than in corresponding courses overall because students at LTH are allowed to postpone final assessment if that course is not a prerequisite for their next course, and are also allowed to retake exams to improve their result.
If we compare 2020 to previous years, the passing rate for final assessments in 2020 was the highest for this study period that we have seen in the past six years, but we did not see a dramatic change: the average passing rate over the previous 5 years was 87%, in 2020 it was 90%. The increase in students passing final assessments in 2020 are due to a combination of two factors: more students completed final assessments in study period 4 in 2020 (10,100 as compared to 8956 in 2019 – we do not normally see such large variation from year to year), and more of those students passed (9066 in 2020 versus 7636 in 2019). We also see an increase in participation and passing rates (of nearly 1800 and 10% from 2019 to 2020, respectively) for the supplemental exam period that fell shortly after the shift to online teaching (April 2020). Here, too, the increased passing rate is a combination of both increased participation and more students passing.
The reason these increased participation and passing rates are interesting is that an exception was made in Sweden in the spring of 2020 so that students would still be eligible for continued government financial aid even if they did not complete all their credits on time. This could in theory have led to fewer students choosing to participate in final assessments and complete courses on time (as long as they were not prerequisites), if they were worried about passing or felt overwhelmed and unable to prepare properly. This could influence passing rates on exams, as students who would previously have needed to try to complete all their courses on time to retain their financial aid could, during the pandemic, simply postpone an exam they might not have expected to pass without suffering any financial consequences. Our data, however, suggest this was not the case, as the increased passing rates were accompanied by increased overall participation rates, not decreased rates. In other words, rather than giving up, it seems that many more students chose to push harder. Exactly what lies behind these rates remains to be analyzed, but the relationship between CEQ data and student outcomes is a valuable one to consider precisely because the CEQ items address aspects of teaching and learning that we know are associated with a deep approach to learning, which supports better overall learning.
In order to build a more comprehensive picture of the overall teaching and learning situation at LTH, we will compare and contrast the results presented above with the interviews currently being made with teachers. Our results from analysis of CEQ data are consistent with a parallel and joint project with Queensland University, Edinburgh University, and Lund University, where teachers were surveyed about their experiences of teaching during the same period. This material, which is still unpublished, includes approximately 90 responses from our faculty, which corresponds to 25% of all teachers responsible for courses during the period in question. Preliminary results indicate that teachers struggled with guiding students when it came to direction, pace, and expected standards. Although written learning outcomes and explicit criteria can be helpful, they cannot replace the responsive and dense interaction between teacher and students and among the students that occurs in classroom teaching. Respondents to the survey reported problems in creating this interaction online and expressed concern for their students. We see it as strength to be able to interpret these qualitative data in light of the quantitative CEQ data that stems from a time series that stretches for many years prior to the pandemic and covers the entire faculty.
The rapid transition from campus to online emergency remote teaching has further exposed areas where we as a faculty need to strengthen our teaching, regardless of the future mix of campus-based and online instruction. In that sense we fully agree with Jeffery and Bauer (Citation2020) who conclude ‘the current online ‘experiment’ is most valuable in that it has amplified the learning challenges that have always existed in our classrooms’ (2482). Even when emergency remote teaching is phased out, we see a need to intensify all sorts of feedback and comments on the students’ progress, to support student networks and peer interactions and to take benefit of the positive experiences gained related to modified assessment methods as well as improved general skills such as analytical thinking, academic writing, and ability to plan work.
5. Conclusions
We were able to find statistically significant differences in the CEQ scores before and after the pandemic (or, for regular campus teaching as compared to emergency remote teaching) across a range of questionnaire items and also between genders for students at LTH. Some of these differences were large and aligned well with anecdotal and instinctive observations and experiences during the early days of emergency remote teaching. Others were more subtle or difficult to predict. In one way, the results of our analysis help to reinforce certain feelings many teachers at LTH have struggled with during the pandemic, and align with early predictions about what would be challenging and important in the shift to online teaching, such as those made by Sahu (Citation2020). They also help us see how this sort of shift might create new opportunities for different kinds of learning, and perhaps most importantly for LTH, new kinds of assessment.
Bearing all of this in mind, it is important to note that the actual changes in CEQ results are not very large: they are all within a range of ± 10 on a scale from −100 to +100, which is a change of less than 10% overall. In other words, there were no major upsets in student evaluations of teaching during this first round of emergency remote teaching, despite the wildly insufficient lead time for transitioning and the many unfamiliar challenges that arose and had to be dealt with on the fly. This leads us to two main conclusions. First, having such a well-established, credible, and robust course evaluation system has allowed us to use statistical analysis to discover meaningful things about the students’ experience during the shift to emergency remote teaching, despite the fact that overall changes in results were relatively subtle, without burdening students with additional ‘pandemic experience’ questionnaires created specifically for that purpose. We were lucky. It is highly unlikely that we would have been able to see statistical significance in such subtle shifts if we were using a newly created instrument that was separate from regular course evaluations. Indeed, using a newly created instrument would preclude statistical comparison to previous data. Second, even though so many of us in higher education have struggled with adapting to online teaching and learning during the pandemic, it seems that our students did not confuse how much they liked the pandemic version of a given course with their overall learning experience in that course, despite the less-than-ideal teaching and learning conditions at the time. This shows the value of making a wise choice of course evaluation instrument that goes beyond probing student satisfaction, and suggests that students were able to adapt fairly well to the circumstances they faced.
Although it is usual to consider it mainly the teacher’s responsibility to plan and execute teaching that supports student learning, we should never forget the instrumental role our students play in the overall success of higher education. Whether specifically in engineering education or more broadly in higher education, the experience we have all shared in adapting to online teaching and learning during the pandemic has the potential to reveal new ways of working together with students to create better strategies and methods for teaching and learning in higher education. And the challenge that many have faced of gaining meaningful insight into students’ experiences during the pandemic clearly shows the value of using a course evaluation instrument that gathers data about students’ experience of various aspects of teaching, rather than focusing on student satisfaction. If higher education is to be better prepared for the possibility of another pandemic-like disruption (which it must be, even if we hope it will not occur), then it seems that we would do well to adopt more systematic and deliberate strategies for adapting to new teaching and learning challenges and for gathering regular and robust data about teaching and learning that can serve multiple purposes. If we want to achieve strong readiness to tackle the challenges of teaching and learning in an uncertain future, we should be strategic about choosing, designing, and deploying tools that can do more than one thing.
Ethical considerations
This research meets the ethical guidelines and adheres to the legal requirements of the study country.
Disclosure statement
No potential conflict of interest was reported by the author(s).
Additional information
Notes on contributors
Per Warfvinge
Per Warfvinge is a professor of chemical engineering and director of the Centre for Engineering Education at the Faculty of Engineering at Lund University. He served as assistant dean at the faculty from 2001 to 2018, holding responsibilities for teaching and learning as well as for international relations.
Jennifer Löfgreen
Jennifer Löfgreen is an academic developer at the Faculty of Engineering at Lund University with special interests in writing and communication in STEM and in epistemological questions around valuing and using different kinds of knowledge for teaching and learning in STEM. She holds a PhD in materials chemistry and is a current PhD candidate in engineering education.
Karim Andersson
Karim Andersson is a quality assurance officer at the Faculty of Engineering at Lund University. He has developed and operated the faculty’s infrastructure for student evaluations of teaching since 2004.
Torgny Roxå
Torgny Roxå is an associate professor at Lund University and has 30 years of experience in academic development. He developed the first Excellent Teaching Practitioner scheme, a reward for excellent teachers and their departments, which now runs on its 19th year and has inspired around 30 Swedish and Scandinavian institutions. His research is focused upon strategic change in teaching cultures within higher education organisations, significant networks, and microcultures. Currently he is preoccupied with the emergency transition to online teaching forced by COVID-19, researching experiences made by teachers and by students.
Christina Åkerman
Christina Åkerman is head of the division of quality assurance at the Faculty of Engineering at Lund University. She holds a PhD in chemical engineering.
Notes
1 An example can be found at https://www.ceq.lth.se/info/dokument/filer/exempel_arbetsrapport_en.pdf
References
- Ali, H., and H. M. Dodeen. 2020. “An Adaptation of the Course Experience Questionnaire to the Arab Learning Context.” Assessment & Evaluation in Higher Education, doi:https://doi.org/10.1080/02602938.2020.1841733.
- Asgari, S., J. Trajkovic, M. Rahmani, W. Zhang, R. C. Lo, and A. Sciortino. 2021. “An Observational Study of Engineering Online Education During the COVID-19 Pandemic.” PLOS ONE 16 (4): e0250041. doi:https://doi.org/10.1371/journal.pone.0250041.
- Baber, H. 2020. “Determinants of Students’ Perceived Learning Outcome and Satisfaction in Online Learning During the Pandemic of COVID19.” Journal of Education and e-Learning Research 7 (3): 285–292. doi:https://doi.org/10.20448/journal.509.2020.73.285.292.
- Bao, W. 2020. “COVID-19 and Online Teaching in Higher Education: A Case Study of Peking University.” Human Behavior and Emerging Technologies 2: 113–115. doi:https://doi.org/10.1002/hbe2.191.
- Borrell, J., and A. Gudmundsson. 2009. “Vad tycker de som inte svarat på kursvärderingsenkäten?” (What are the opinions of students that have not answered the course experience questionnaire?). Proceedings from Lunds universitets utvecklingskonferens 2009, Lund, Sverige, pp. 79–85. ISSN 978-91-997974-2-9.
- Buttler, T., D. George, and K. Bruggemann. 2021. “Student Input on the Effectiveness of the Shift to Emergency Remote Teaching due to the COVID Crisis: Structural Equation Modeling Creates a More Complete Picture.” International Journal of Educational Research Open 2-2: 100036. doi:https://doi.org/10.1016/j.ijedro.2021.100036.
- Chamorro-Premuzic, T., and A. Furnham. 2003. “Personality Predicts Academic Performance: Evidence from two Longitudinal University Samples.” Journal of Research in Personality 37 (4): 319–338. doi:https://doi.org/10.1016/S0092-6566(02)00578-0.
- Chen, E., K. Kaczmarek, and H. Ohyama. 2020. “Student Perceptions of Distance Learning Strategies During COVID-19.” Journal of Dental Education, 1–2. doi:https://doi.org/10.1002/jdd.12339.
- Chick, R. C., G. T. Clifton, K. M. Peace, B. W. Propper, D. F. Hale, A. A. Alseidi, and T. J. Vreeland. 2020. “Using Technology to Maintain the Education of Residents During the COVID-19 Pandemic.” Journal of Surgical Education 77 (4): 729–732. doi:https://doi.org/10.1016/j.jsurg.2020.03.018.
- Cinar, M., M. Ekici, and O. Demir. 2021. “Medication or Band-Aid? Revisiting University Students’ Readiness for Online Education.” Turkish Online Journal of Distance Education, 176–191. doi:https://doi.org/10.17718/tojde.906848.
- Darwin, S. 2017. “What Contemporary Work are Student Ratings Actually Doing in Higher Education?” Studies in Education Evaluation 54: 13–21. doi:https://doi.org/10.1016/j.stueduc.2016.08.002.
- Dietrich, N., K. Kentheswaran, A. Ahmadi, J. Teychené, Y. Bessière, S. Alfenore, S. Laborie, et al. 2020. “Attempts, Successes, and Failures of Distance Learning in the Time of COVID-19.” Journal of Chemical Education 97: 2448–2457. doi:https://doi.org/10.1021/acs.jchemed.0c00717.
- Duckworth, A. L., and M. E. P. Seligman. 2006. “Self-discipline Gives Girls the Edge: Gender in Self-Discipline, Grades, and Achievement Test Scores.” Journal of Educational Psychology 98: 198–208. doi:https://doi.org/10.1037/0022-0663.98.1.198.
- Eberle, J., and J. Hobrecht. 2021. “The Lonely Struggle with Autonomy: A Case Study of First-Year University Students’ Experiences During Emergency Online Teaching.” Computers in Human Behavior 121: 106804. doi:https://doi.org/10.1016/j.chb.2021.106804.
- Elmer, T., K. Mepham, and C. Stadtfeld. 2020. “Students Under Lockdown: Comparisons of Students’ Social Networks and Mental Health Before and During the COVID-19 Crisis in Switzerland.” PLoS ONE 15 (7): e0236337. doi:https://doi.org/10.1371/journal.pone.0236337.
- Erickson, M., and M. Wattiaux. 2021. “Instructor and Student Responses to COVID-19 Emergency Remote Learning: a Preliminary Investigation of ten Undergraduate Animal Sciences Courses.” Natural Sciences Education. doi:https://doi.org/10.1002/nse2.20039.
- Forslund, A. 2020. “Vårens online-undervisning ─ en utmaning med stor utvecklingspotential (Online teaching during spring 2020 – a challenge with potential)”. Centre for the Advancement of University Teaching, Stockholm University. Accessed 28 October, 2020. https://www.su.se/ceul/om-oss/nyheter/v%C3%A5rens-online-undervisning-en-utmaning-med-stor-utvecklingspotential-1.507980
- George, M. L. 2020. “Effective Teaching and Examination Strategies for Undergraduate Learning During COVID-19 School Restrictions.” Journal of Educational Technology 49 (1): 23–48. doi:https://doi.org/10.1177/0047239520934017.
- Gonzalez, T., M. A. de la Rubia, K. P. Hincz, M. Comas-Lopez, L. Subirats, S. Fort, and G. M. Sacha. 2020. “Influence of COVID-19 Confinement on Students’ Performance in Higher Education.” PLOS ONE 15 (10): e0239490. doi:https://doi.org/10.1371/journal.pone.0239490.
- Hattie, J. 2012. Visible Learning for Teachers. London and New York: Routledge.
- Hattingh, T., W. van Niekerk, H. Marais, and Y. Geldenhuys. 2020. “Engineering Student Experiences of a Remotely Accessed, Online Learning Environment.” 2020 IFEES World Engineering Education Forum - Global Engineering Deans Council (WEEF-GEDC) 00: 1–6. doi:https://doi.org/10.1109/weef-gedc49885.2020.9293652.
- Hell, M. 2013. “Presterar kvinnor bättre än män på LTH, eller tvärtom, eller inget av det, eller både och?” (Do women outperform men at LTH, or is the opposite true, or are both claims true?). Accessed 16 October, 2020 https://journals.lub.lu.se/index.php/KG/index.
- Hodges, C., S. Moore, B. Lockee, T. Trust, and A. Bond. 2020. “The Difference Between Emergency Remote Teaching and Online Learning.” Accessed 16 October, 2020. https://er.educause.edu/articles/2020/3/the-difference-between-emergency-remote-teaching-and-online-learning.
- Howie, P., and R. Bagnall. 2013. “A Critique of the Deep and Surface Approaches to Learning Model.” Teaching in Higher Education 18 (4): 389–400. doi:https://doi.org/10.1080/13562517.2012.733689.
- Jansen, E., J. van der Meer, and J. Fokkens-Bruinsma. 2013. “Validation and use of the CEQ in The Netherlands.” Quality Assurance in Education 21 (4): 330–343. doi:https://doi.org/10.1108/QAE-11-2012-0041.
- Jeffery, K. A., and C. F. Bauer. 2020. “Students’ Responses to Emergency Remote Online Teaching Reveal Critical Factors for All Teaching.” Journal of Chemical Education 97 (9): 2472–2485. doi:https://doi.org/10.1021/acs.jchemed.0c00736.
- Kahn, R. A., and M. Jawaid. 2020. “Technology Enhanced Assessment (TEA) in COVID 19 Pandemic.” Pakistan Journal of Medical Science 36 (COVID19-S4). doi:https://doi.org/10.12669/pjms.36.COVID19-S4.2795.
- Keiser, H. N., P. R. Sackett, N. R. Kuncel, and T. Brothen. 2016. “Why Women Perform Better in College Than Admission Scores Would Predict: Exploring the Roles of Conscientiousness and Course-Taking Patterns.” Journal of Applied Psychology 101 (4): 569–581. doi:https://doi.org/10.1037/apl0000069.
- Klein, P., L. Ivanjek, M. N. Dahlkemper, K. Jeličić, M.-A. Geyer, S. Küchemann, and A. Susac. 2021. “Studying Physics During the COVID-19 Pandemic: Student Assessments of Learning Achievement, Perceived Effectiveness of Online Recitations, and Online Laboratories.” Physical Review Physics Education Research 17 (1): 010117. doi:https://doi.org/10.1103/physrevphyseducres.17.010117.
- Kling, K. C., E. E. Noftle, and R. W. Robins. 2012. “Why Do Standardized Tests Underpredict Women’s Academic Performance? The Role of Conscientiousness.” Social Psychological and Personality Science 4 (5): 600–606. doi:https://doi.org/10.1177/1948550612469038.
- Knudson, D. 2020. “A Tale of two Instructional Experiences: Student Engagement in Active Learning and Emergency Remote Learning of Biomechanics.” Sports Biomechanics, 1–11. doi:https://doi.org/10.1080/14763141.2020.1810306.
- Marton, F., and S. Booth. 1997. Learning and Awareness. New Jersey: Lawrence Erlbaum Associates.
- Marton, F., and R. Säljö. 1976. “On Qualitative Differences in Learning–1: Outcome and Process.” British Journal of Educational Psychology 46 (1): 4–11. doi:https://doi.org/10.1111/j.2044-8279.1976.tb02980.x.
- Millar, S.-K., K. Spencer, T. Stewart, and M. Dong. 2021. “Learning Curves in COVID-19: Student Strategies in the ‘new Normal’?” Frontiers in Education 6: 641262. doi:https://doi.org/10.3389/feduc.2021.641262.
- Mucci-Ferris, M., D. K. Grabsch, and A. Bobo. 2021. “Positives, Negatives, and Opportunities Arising in the Undergraduate Experience During the COVID-19 Pandemic.” Journal of College Student Development 62 (2): 203–218. doi:https://doi.org/10.1353/csd.2021.0017.
- Parker, S. W., M. A. Hansen, and C. Bernadowski. 2021. “COVID-19 Campus Closures in the United States: American Student Perceptions of Forced Transition to Remote Learning.” Social Sciences 10 (2): 62. doi:https://doi.org/10.3390/socsci10020062.
- Pintrich, P. R. 2004. “A Conceptual Framework for Assessing Motivation and Self-Regulated Learning in College Students.” Educational Psychology Review 16: 385–407. doi:https://doi.org/10.1007/s10648-004-0006-x.
- Potgieter, M., L. A. Pilcher, R. R. Tekane, I. Louw, and L. Fletcher. 2019. ““Lessons Learnt from Teaching and Learning During Disruptions.”.” In Research and Practice in Chemistry Education, edited by M. Schultz, S. Schmid, and G. A. Lawrie, 89–107. Singapore: Springer.
- Ramsden, P. 1991. “A Performance Indicator of Teaching Quality in Higher Education: The Course Experience Questionnaire.” Studies in Higher Education 16 (2): 129–150. doi:https://doi.org/10.1080/03075079112331382944
- Ramsden, P. 2005. Learning to Teach in Higher Education. 2nd ed. London: RoutledgeFalmer.
- Rapanta, C., L. Botturi, P. Goodyear, L. Guàrdia, and M. Koole. 2020. “Online University Teaching During and After the Covid-19 Crisis: Refocusing Teacher Presence and Learning Activity.” Postdigital Science and Education 2: 923–945. doi:https://doi.org/10.1007/s42438-020-00155-y.
- Refae, G. A. E., A. Kaba, and S. Eletter. 2021. “Distance Learning During COVID-19 Pandemic: Satisfaction, Opportunities and Challenges as Perceived by Faculty Members and Students.” Interactive Technology and Smart Education, Ahead-of-Print(Ahead-of-Print). doi:https://doi.org/10.1108/itse-08-2020-0128.
- Revilla-Cuesta, V., M. Skaf, J. M. Varona, and V. Ortega-López. 2021. “The Outbreak of the COVID-19 Pandemic and its Social Impact on Education: Were Engineering Teachers Ready to Teach Online?” International Journal of Environmental Research and Public Health 18 (4): 2127. doi:https://doi.org/10.3390/ijerph18042127.
- Rodriguez-Núñez, J., and J. Leeuwner. 2020. “Changing Courses in Midstream: COVID-19 and the Transition to Online Delivery in Two Undergraduate Chemistry Courses.” Journal of Chemical Education 97 (9): 2819–2824. doi:https://doi.org/10.1021/acs.jchemed.0c00781.
- Rosander, P., M. Bäckström, and G. Stenberg. 2011. “Personality Traits and General Intelligence as Predictors of Academic Performance: A Structural Equation Modelling Approach.” Learning and Individual Differences 21 (5): 590–596. doi:https://doi.org/10.1016/j.lindif.2011.04.004.
- Roxå, T., A. Ahmad, J. Barrington, J. van Maren, and R. Cassidy. 2021. “Reconceptualising Student Ratings of Teaching to Support Quality Discourse on Student Learning: A Systems Perspective.” Higher Education, doi:https://doi.org/10.1007/s10734-020-00615-1.
- Sahu, P. 2020. “Closure of Universities Due to Coronavirus Disease 2019 (COVID-19): Impact on Education and Mental Health of Students and Academic Staff.” Cureus 12 (4): e7541. doi:https://doi.org/10.7759/cureus.7541.
- Savage, M. J., R. James, D. Magistro, J. Donaldson, L. C. Healy, L. Nevill, M. & P, and J. Hennis. 2020. “Mental Health and Movement Behaviour During the COVID-19 Pandemic in UK University Students: Prospective Cohort Study.” Mental Health and Physical Activity 19. doi:https://doi.org/10.1016/j.mhpa.2020.100357.
- SFS. 2020. “Hur påverkar coronapandemin studenterna? (How does the Corona pandemic affect the students?” Stockholm: Sveriges Förenande Studentkårer. Accessed 1 May, 2021. https://sfs.se/wp-content/uploads/2020/12/SFS-rapport-Hur-pa%CC%8Averkar-coronapandemin-studenterna-december-2020-2.pdf.
- Stenliden, L., A. M. Bylund, L. Landkvist, L. Ekström Lind, S. Kellgren Lundberg, H. Stenmark, and C. Wilhemsson. 2020. “Lärares digitala kompetens före, under och efter covid-19. (Teachers’ digital competence before, during, and after covid-19.).” Utbildning och Lärande, doi:https://doi.org/10.31235/osf.io/bvca3.
- Stewart, B. L., S. Miertschin, and C. Goodson. 2020. “COVID-19 Transitions to Online Formats and Pre-Pandemic Foundations for Student Success: Time Management and Lifestyle Variables.” Journal of Higher Education Theory and Practice 20 (10): 173–189. doi:https://doi.org/10.33423/jhetp.v20i10.3661.
- Stokes, D. C. 2020. “Senior Medical Students in the COVID-19 Response: An Opportunity to Be Proactive.” Academic Emergency Medicine 27 (4): 343–345. doi:https://doi.org/10.1111/acem.13972.
- Tang, Y. M., P. C. Chen, K. M. Y. Law, C. H. Wu, Y. Lau, J. Guan, D. He, and G. T. Ho. 2021. “Comparative Analysis of Student’s Live Online Learning Readiness During the Coronavirus (COVID-19) Pandemic in the Higher Education Sector.” Computers & Education 168: 104211. doi:https://doi.org/10.1016/j.compedu.2021.104211.
- Tigaa, R. A., and S. L. Sonawane. 2020. “An International Perspective: Teaching Chemistry and Engaging Students During the COVID-19 Pandemic.” Journal of Chemical Education 97 (9): 3318–3321. doi:https://doi.org/10.1021/acs.jchemed.0c00554.
- Verawardina, U., L. Asnur, A. L. Lubis, Y. Hendriyani, D. Ramadhani, I. P. Parma, R. Darni, T. J. Betri, S. Wilda, and T. Sriwahyuni. 2020. “Reviewing Online Learning Facing the Covid-19 Outbreak.” Talent Development and Excellence 12 (3s): 385–392.
- Virtanen, P., and A. Nevgi. 2010. “Disciplinary and Gender Differences among Higher Education Students in Self-Regulated Learning Strategies.” Educational Psychology 30 (3): 323–347. doi:https://doi.org/10.1080/01443411003606391.
- Vivolo, J. 2016. “Understanding and Combating Resistance to Online Learning.” Science Progress 99 (4): 399–412. doi:https://doi.org/10.3184/003685016(14773090197742.
- Wilson, K. L., A. Lizzio, and P. Ramsden. 1997. “The Development, Validation and Application of the Course Experience Questionnaire.” Studies in Higher Education 22 (1): 33–53. doi:https://doi.org/10.1080/03075079712331381121.
- World Health Organization. 2009. Whole-of-Society Pandemic Readiness. Accesed 1 May, 2021. https://www.who.int/influenza/preparedness/pandemic/2009-0808_wos_pandemic_readiness_final.pdf?ua=1.
- Wyse, A. R., E. M. Stickney, D. Butz, A. Beckler, and C. N. Close. 2020. “The Potential Impact of COVID-19 on Student Learning and How Schools Can Respond.” Educational Measurement: Issues and Practices 39 (3): 60–64. https://doi.org/https://doi.org/10.1111/emip.12357.