
ABSTRACT
The Teamwork Indicator (TWI) inventory for students monitors group development and can serve as a feedback tool in project work, active learning, and teams to improve the educational outcome. TWI consists of 20 items, it is simple and easy to use, and the inventory gauges changes over time in four central group dimensions: management, social collaboration, work commitment and attitudes toward evaluations. Based on a large sample (N=6595), the inventory has good psychometric properties. The item structure showed temporal and contextual stability for sex, cultural diversity, language, and training format. In active learning, students are left more to themselves, and in peer assessment, the inventory can partly substitute for feedback from a facilitator. The TWI is suitable for groups of a certain duration and with two-fold goals: content learning and social development of interactive, communication and collaborative skills. The use of TWI can initiate reflections about self, team and group functioning in general, which in the short and long-term is likely to translate into the outcome of new groups, probably also into the students’ future careers.
Traditional lectures have long been the mainstay of teaching in higher education although they are not always the best way to transmit knowledge (Inra et al. Citation2017). In recent decades, the educational focus has shifted to include active learning with the aim of bringing students out of the passive-receptive mode, that is typical of lectures. Moreover, higher education is faced with the global challenge to address sustainability. In this context, the needs to reduce the gap between education and work, increase cross-disciplinary collaboration, and develop collaborative skills is emphasised. This is likely to require more student-centered, flexible curricula, project-related learning in ways that include training in communication, teamwork, critical thinking, and creativity etc. (Guerra and Rodriguez-Mesa Citation2021; Trede, Braun, and Brookes Citation2021). Active learning mostly takes place in small groups where students work together; they are involved in discussions, asking questions, testing their understanding etc. Their learning depends on social skills that can foster collaboration, self-directed and lifelong learning (Holen Citation2000). This paper presents an inventory that is simple to administer and that may be used in higher education to enhance the social aspects of content learning in active groups.
Today, it seems well-documented that active learning increases student performance and reduces failures rates (Freeman et al. Citation2014). Neuroscience has demonstrated that the brain's mesolimbic dopaminergic pathway is involved when learners actively and equitably participate in collaboration; increased dopamine levels seem to reinforce wishes to continue peer-learning, and students tend to experience well-being, contentment, even excitement (Clark and Dumas Citation2015).
In the context of active learning, students take greater responsibility for their acquisition of knowledge and skills, including social skills that can enhance their learning outcome. For faculty members, active learning often involves a role switch from teaching to group facilitation, combined with the use of social leverage, interpersonal exercises, inventories and stimulating reflections to optimise group development. Technology-enhanced learning is also becoming more common (Kirkwood and Price Citation2014).
In project work, students may learn to cope with liminality, i.e. to resolve situations where the group is ‘stuck’. The members are uncertain and uncomfortable; no script exists for how to proceed. Mastery of situations like these provides opportunities for arriving at new solutions or innovations (Brandshaug and Sjølie Citation2021).
Some have argued that good leadership is a key to efficient teams in business (Kozlowski and Ilgen Citation2006). In academic settings, however, formative reciprocal peer feedback, i.e. symmetric exchange between students about performance, their contributions and standards is preferable (Liu and Carless Citation2006). Student involvement in peer assessments of self, others and the group tends to improve both the subject knowledge and social skills, which is reflected in the communication, self-evaluation, observation and adequate self-criticism (Dochy and Mcdowell Citation1997).
Small group research has been going on for more than half a century and has diversified (Kozlowski and Ilgen Citation2006). The output depends on the aim, the context, the capacity of the members, and the nature of the intended outcome. Teams have been defined as a subcategory of small groups. Usually, teams operate within larger units and aim for a delivery to an external stakeholder, e.g. to the management or to a client. The delivery could be a solution to a problem, an invention, a strategy for addressing competition or an emergency, and it's like. Thus, teams are different from, e.g. therapy groups or groups in most educational settings. Teams tend to belong to working life. The satisfaction and personal gain of the team members are important but should always remain secondary to the quality of the delivery.
In recent decades, society, employers, and students alike expect higher education to equip graduates with generic professional skills (Dahlgren et al. Citation2008; Garcia-Aracil, Monteiro, and Almeida Citation2021; Gerwel Proches, Chelin, and Rouvrais Citation2018; Lisa, Khennelova, and Newman Citation2019; Ramadi, Ramadi, and Nasr Citation2016). World-wide, teams have been made the central focus of management in the public services, business, industry and organisations (Kozlowski Citation2018). Even so, training and improvement of social skills for teamwork is a recent challenge in higher education. Such skills are not well transferred by textbooks, seminars or lectures, but presupposes experiential, active learning and peer-evaluations, reflection and feedback within teams (Veine et al. Citation2020). These skills include how to address group tasks, negotiate differences, solve problems, arrive at consensus, meet deadlines, and it's like. Experiential learning involves the construction of knowledge and skills from real-life experience situated in a context relevant to the learners’ future careers (Yardley, Teunissen, and Dornan Citation2012). In experiential group learning, the students are more likely to gain awareness of their responsibility, the value of their contributions and their effects on the group.
The transition from an unreflected involvement in a series of single interactive, seemingly independent group episodes into a wider, generalisable insight into interactive patterns in group work is paramount. Reflections and feedback seem to be key components in the development of meta-cognitive, higher-order comprehension of group interactions, assumed to be a precondition for translating the insight into other current and future team situations. Usually, this translation does not take place unless educational structures in the program guide the students in those directions.
Students’ interactive teamwork skills have been addressed by training programs focusing on assessment and feedback to improve team behavior and outcome. The widely used CATME is training students to work in teams, and it facilitates communication, aims to create accountability and efficiency in relation to the members’ contributions (Loughry, Ohland, and Williams Citation2014). The ITP Metrics stands for individual team performance; it provides team diagnostics, behavioral assessments, and peer feedback. The focus is on five dimensions: team health, peer feedback, conflict management styles, leadership, and personality traits (Tang Citation2020). The AEM Cube (https://www.human-insights.nl/tools-aem-cube) is targeting attachment, exploration, and the management of complexity. In health care training, TeamSTEPPS involves strategies and tools meant to enhance performance and patient safety (Chen et al. Citation2019). Some of these programs are licensed, elaborate, and require instructor training.
In this paper, the primary focus is on the use of a simple inventory. Together with other social leverage tools it can trigger reflecting discussions and symmetrical feedback about self, peers, and group. With active learning as a backdrop, the inventory is suitable for repeated use in groups of some duration when the educational aim is dual: to improve social skills that can foster both productivity and better subject learning. The TWI is easy and free to use, it is not licensed, and it requires limited involvement and preparation. The scores are not normative, but the groups have the opportunity to observe and discuss their changes over time.
Context of this inventory – Experts in Teamwork
At the Norwegian University of Science and Technology (NTNU), it is now mandatory for almost all master's student to participate in the program ‘Experts in Teamwork’ (EiT). The objective is to improve students’ collaboration skills by reflecting on and learning from specific teamwork situations by carrying out a project together (Sortland and Løje Citation2019).
The EiT training program takes a full day every week during one semester, i.e. 15 days in total. There is also an intensive EiT program lasting 15 consecutive days. Independent of the program version, around 30 students are together in a ‘village’; they are divided into small groups with about 5 students in each, and they collaborate to complete a project. To optimise interdisciplinary and person-related challenges in the groups, no more than two students, preferably only one, come from the same academic discipline. For the same reason, students from other countries are also often included. They tend to bring in some cultural challenges and language differences. The groups work without a formal leader, and together, the members are responsible for their project. The project work is supervised by a professor who is a content expert on the subject. In addition, the professor is supervising the final project delivery to the external partner.
A key aspect of the learning is related to the many situations that can arise when team members work together across disciplines. In particular, the students develop their teamwork skills when reflecting on group events and repeated behavioral patterns. Likewise, facilitation stimulates the reflection on the prerequisites for good team collaboration and on how each individual contributes to the teamwork. At intervals, the team takes action to improve their teamwork by evaluating progress and interaction, sometimes by using the TWI.
To improve the group dynamic, any group member or the facilitator can suggest a discussion of a single event, or repeated events, or the modes of working in the current group. To address the issue, the group members may have free, open discussions, or they may use structured social situations or exercises, usually taken from the EiT workbook – EiT-handbook for village supervisors and learning assistants (Sortland Citation2020). In addition, the scoring of the inventory presented in this article is done on three occasions, which is explained in more detail below under ‘Procedures’.
Formative reciprocal peer feedback has been defined as a ‘communication process through which learners enter into dialogues related to performance and standards’ (Liu and Carless Citation2006). Formative evaluations are met with less resistance when given by students (Paquet and Des Marchais Citation1998). That is why symmetrical, i.e. peer-to-peer feedback is regarded as essential.
Small groups offer good opportunities for formative peer feedback, which in itself has been suggested as an important aspect of collaborative learning (Van Gennip, Segers, and Tillema Citation2010). At the end of the EiT program, the groups turn in both a written process report about the cooperation in the group and what the individual has experienced and learned (interactive developments within the group), and a project report about their problem formulation, methods and results. The project report and the process report are each worth 50 per cent of the final grade. Every participant in the group gets the same grade.
The interdisciplinary component of EiT brings the students into work situations where differences between members are more pronounced, which increases challenges in the teamwork. Having to cope with differences is supposed to optimise the group training. However, the inventory presented in this paper does not presuppose interdisciplinary or highly diverse groups.
Aim of study
The aim of this study was to investigate the aforementioned inventory on the individual levels; it has been developed over some years at the NTNU as a feedback tool in student groups within EiT. The inventory has been called ‘The Teamwork Indicator’ (TWI). The objectives of this study were to explore the group dimensions of the inventory, the psychometric properties, and temporal as well as contextual stability. Another aim was to look at possible changes in the group dimensions during the training. On the practical level, the goal was also to give the inventory a sound and simple presentation that would inspire motivated readers to apply or test this approach in their educational environment.
Materials and methods
Design and ethics
This study is a part of a bigger survey exploring process aspects of the interdisciplinary EiT group training. This study involves the inventory and has a longitudinal design with three measure points. It has an empirical exploratory approach; the items of the inventory were not theory-derived but identified and filtered by faculty members and researchers involved in EiT with extensive educational experience and practice.
The students in EiT were invited to participate in the survey. Participation was voluntary. All data collected were treated confidentially. The findings are presented in ways that makes no individual, group, or project identifiable. By the end of the semester, the data were fully anonymized. The study has been approved by The Data Protection Office for Research, the Norwegian Centre for Research Data (NSD) for the years 2017, 2018 and 2019.
Item generation
Initially, a pool of items was generated by the researchers, faculty members and their assistants engaged in EiT. Based on their experiences, they were asked to suggest characteristic patterns of group interactions or behaviors that in their view either hindered or fostered collaborative group work. Their suggestions were itemised by the researchers. Later the items were rated for relevance by other faculty members and assistants connected to EiT. They were also encouraged to suggest new or alternative items. Items receiving low relevance scores or items that loaded on more than one factor with a correlation above 0.40 in preliminary factor analyses were discarded. This procedure was reiterated until no cross loadings and no new items occurred and all items had high relevance scores. Thus, the number of items was pared down from more than 60 to 24 items, and finally down to 20 items. The 20-item inventory is explored in this study.
Participants
The participants were master's students mostly in their 4th year at NTNU – the Norwegian University of Science and Technology. In total, 6595 (100%) students registered for the course: 2164 (32.8% of the total) in 2017, 2194 (33.3%) in 2018 and 2237 (33.9%) in 2019.
Within every academic year, the survey data were collected at three different times, and the student participation varied between them. Of the total, at T1, there were N=6188 (93.83%) participants, at T2 there were N=5873 (89.05%) and at T3, there were N=5886 (89.25%) participants, and 5077 (77.0%) completed the inventory at all three measure points, while a higher number of students completed the inventory on two of the three occasions. Participation was voluntary, and a few did not want to participate, some did not prioritise the survey at the time of data collection, some students were absent that day, or some surveys were discarded as incomplete.
Of the total, 2569 (39.0%) were female and 3578 (54.3%) were male students. Age was not recorded as the students mostly came from the same age bracket. The number of students in the longitudinal EiT program was 4262 (64.6%), and in the intensive program it was 2063 (31.3%). The Norwegian version of the inventory was used by 4611 (69.9%) students, and the English version by 1581 (24.0%). Those using the English inventory usually came from non-Scandinavian countries, i.e. outside of Denmark, Norway, and Sweden. Their responses mostly reflected different cultural backgrounds than the majority.
Procedure – use of inventory
The inventory was completed at T1 on the 4th day, at T2 on the 9th day, and finally, at T3 on the 14th or 15th day of the EiT program. Some in the intensive program dropped the completion at T2; they felt it was too close in time to the first completion. At T3, some students prioritised to work on their group report and delivery.
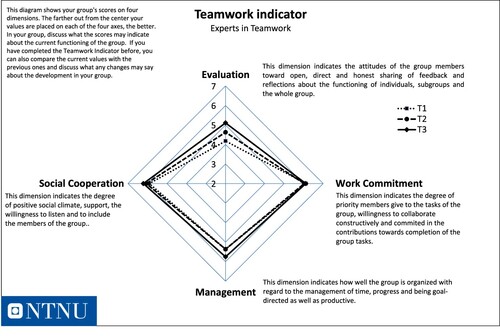
In 2017 and 2018, the inventory was completed on paper. Since 2019, it has been done digitally. In the research literature, no essential difference has been found between survey data collection made in the two formats (Jibb et al. Citation2020). The students were not informed about the scoring key of the inventory. However, soon after the completion, the group received a printout of a diagram displaying the mean values of their pooled group dimension scores, derived from a spreadsheet, and displayed in a diamond shaped figure. See the attached specimen, . The students were encouraged to discuss the pooled scores in relation to how they saw their group functioning at the time of the inventory completion. No group norms were given for the scores, but at T2 and T3, the students could compare with their prior group scores and discuss the implications of any changes.
Figure 1. Specimen of TWI feedback diagram: The diamond shaped diagram shows the mean values of the Teamwork Indicator (TWI) at T1 (early), T2 (mid phase), and T3 (end of training) at NTNU. The diagram displays changes in group dimension scores over time and a brief explanation of each dimension: Management, Social Cooperation, Work Commitment and Evaluation. Among students, the diagram is used in active learning groups or project work at the start of an evaluation session about the functioning of the group and the potentials for improvement. Here, the mean values of the total student population are displayed.
The items of the inventory were rated in response to the question: ‘ … indicate to what extent it [the item] matches the way you see your group today.’ The response options on each item ranged from ‘1 – Very small extent’, ‘4 – Moderate extent’, to ‘7 – ‘Very large extent’. The advice to the students was to avoid checking their ratings with others, and they were encouraged to be frank, fair, and honest in the scoring of their group.
Statistics
The inventory data were tested by the Kaiser-Meyer-Olkin (KMO) measure and the Bartlett's Test for Sphericity to check the suitability of the data for factor analyses at T1, T2 and T3, which would be the principal component extraction with varimax rotation. This statistical procedure was chosen to identify the factor structure from which group dimensions can be derived. Not the factor scores, but the dimensional scores were chosen for the subsequent analyses. If factor scores were to be used, each item would be weighted according to the strength of it's correlation to the latent factor. When using dimension scores, however, every item weights the same, and dimension scores are simply the sum of all item scores within each dimension. This makes the inventory easier to use for practical purposes. With solid factor correlations, the difference between the factor score and it's related dimensional score is minimal.
In the factor analyses, missing values were replaced by the mean values. The minimum factor loading was set to >.50 to be included in the group dimensions; the mean scores and standard deviations of the dimensions were calculated. In addition, the Cronbach's alphas as a measure of internal consistency among the items within each dimension were computed at each of the three measure points. A check was also made to see if removal of any item would increase any of the Cronbach's alphas. The mean values of the group dimensions were explored at the three measure points, between T1-T2, T2-T3 and T1–T3 by analysis of variance (ANOVA) paired-samples t-tests as that tapped a higher number of respondents.
Three of the group dimensions were inverted. Accordingly, the face validity of the labels given to each dimension was checked. In a separate group (N=29), the respondents indicated which label they saw as the best fit for each of the 20 items; there was also a ‘Don't know’ option. To find the label acceptable, at least half of the responses were expected to endorse the label. As an additional test, the face-value of each dimension was computed for the Chi-square of the difference; the number of responses that agreed with the assigned label were tested against the sum of all other given responses.
The level of significance was set at <.05 in all computations. The statistical analyses were done using SPSS 26.
Results
At T1, KMO=.885 and the Bartlett's sphericity (approx. χ2=34479,35; df=190; p<.001) were significant; likewise, at T2, KMO=.913 and Bartlett's sphericity (approx. χ2=43429.34; df=190; p<.001), and finally, at T3, KMO=.937 and Bartlett's sphericity (approx. χ2=50930.67; df=190; p<.001). The tests from the three measure points indicated appropriateness for factor analyses of the inventory data.
In the exploratory factor analysis, the 20 items at T1, T2 and T3 emerged with four latent factors and Eigenvalues above one. All communalities were > .4. The four factors explained 51.96% of the total variance at T1, 57.44% at T2, and 60.39% at T3. Within each of the four factors, all five items had correlations >.50 to the latent factor and no cross loadings occurred. The five items with high correlations to the latent factor were always the same at the three measure points and the remaining items obtained considerably lower correlations.
Based on the sequence of the factor extractions at T1, the four extracted factors were provisionally assigned the letters A to D. At T1, Cronbach's alpha of the four factors ranged from 0.72–0.81; at T2, they ranged from 0.77–0.86; and at T3, they ranged from 0.81–0.87. At no point was a higher alpha found by removing any of the items. The correlations of the items to the latent factor in the analyses are displayed in . The inter-item-correlations within each dimension never exceeded r= 0.66, which was the highest binary correlation found. Accordingly, no major support was found for item redundancy.
Table 1. Teamwork Indicator (TWI), factor analysis with varimax rotation; correlations with latent factors (F1 to F4), accumulated explained variance at the beginning (T1), mid-phase (T2) and end of training (T3). Four group dimensions emerged with correlations >.05 to latent factor; the letters A to D show the sequence of extraction of dimensions at T1, T2 and T3. Mean values and standard deviations of dimensions plus their Cronbach alphas are displayed. Labels of the four group dimensions: A – Management; B – Social Cooperation; C – Work Commitment; D – Evaluations. (NT1=6188; NT2=5873; NT3=5886 students).
Regarding the sequence of the factor extractions, the items of factor A and B were always extracted first and in the same order. A came before B, while the order of factors containing dimension C and D was reversed at T2 and T3; D always appeared before C.
To check further the stability of the item structure of the four dimensions, the 20 items were factor analyzed separately in six sub-populations within the total population: among women only, and men only, for cultural differences among those who completed the inventory in English versus those who used the Norwegian version, and among those in the intensive program versus those in the longitudinal program. No changes in the item structure of the four dimensions appeared in any sub-population; the five items with the highest correlation for each factor always grouped together in the same way irrespective of sub-population.
Labeling group dimensions
The group factors A, C and D contained negatively worded items, while factor B had only positive worded items. The items that grouped together within each factor were used as group dimensions. To make the sum score of the four dimensions point in the same direction, the scores of dimensions A, C and D were inverted. Their dimensional mean values after inversion are also displayed in .
The items of dimension A are related to problems with the management of time, progress, and productivity as well as having unclear goals and priorities. The items capture features of poorly organised groups. This dimension is inverted and labeled ‘Management’. With the inversion, high scores indicate good management, and lower scores indicate poor management.
Dimension B is related to positive social qualities such as group climate or social cohesion, and the degree of internal support and willingness to develop the collaboration. This dimension is labeled ‘Social Cooperation’. Higher scores indicate a good, supportive, and productive social climate.
The items in dimension C explore how difficult it is to muster the group. Some members are seen to make group work difficult; they appear unwilling, resistant, or evasive toward cooperating, or their attention is elsewhere. The scores on dimension C address aspects of low commitment to the group's work. When the dimension is inverted, high scores indicate that the members are committed and prioritise the group work, while low scores indicate the opposite. This dimension was labeled ‘Work Commitment’.
The items of dimension D captured attitudes toward internal peer evaluations, i.e. the tendency to avoid evaluations of self, peers, and the group. The items address issues such as the tendency to sugarcoat feedback or keep the evaluations on a general, impersonal, or vague level. This dimension is inverted. Accordingly, high scores indicate that the members are direct and adequate in sharing their evaluations about individuals, subgroups, and the whole group. Low scores indicate the opposite, i.e. avoidance; the evaluations do not directly address the challenges of the group. This dimension has been called ‘Evaluations’ and captures the attitude toward social sharing of feedback and reflections.
At T1, T2 and T3, the four dimensions of the inventory always included these items:
Management, dimension A, is the inverted sum of items: 2, 5, 8, 13, and 17
Social Cooperation, dimension B, is the sum of items: 6, 9, 12, 14, and 18
Work Commitment, dimension C, is the inverted sum of items: 1, 4, 11, 16, and 20
Evaluation, dimension D, is the inverted sum of items: 3, 7, 10, 15, and 19
The inverted dimensions are characterised by the absence of what is expressed in the wording of the items. For this reason, face validity of the suggested labels of the dimensions was tested on a smaller sample (N=29) with no or limited prior knowledge about the inventory and it's scoring procedure. For each item five response options were given, each of the four labels above plus ‘Don't know’. The task of these participants was to tick off the label that seemed most appropriate for each of the 20 items. When their responses agreed with the suggested labels, they were counted as endorsements, while those that did not agree, were counted as ‘no backing’ for the given label. Subsequently, the number of responses given to each item were pooled together for each of the four dimensions. The preset goal was to obtain at least half or more of the possible endorsements for the label given to each dimension. All dimension labels were given more than half of the possible endorsements. In total, there were 29×5=145 possible responses for each dimension. ‘Management’ received 112 endorsements and 33 of no backing (χ2=43.4, df=1, p<.001). Social Cooperation received 87 endorsements and 58 of no backing (χ2=5.8, df=1, p<.025), Work Commitment received 75 endorsements, and 70 of no backing (divided between A=12, B=51 and D=4, Don't know=3) (χ2=0.174; df=1, n.s.), and finally, Evaluation received 99 endorsements and 46 of no backing (χ2=19.4, df=1, p<.001). Work Commitment did not reach significance due to item 16; it received 26 out of 29 possible endorsements for B rather than C.
In an analysis of possible changes in the mean scores of each dimension between the three measure points, comparisons revealed some differences. For Management, no significant change was found from T1 to T2. However, from T2 to T3 there was a significant increase in the mean value. For Social Cooperation, there were significant increases from T1 to T2, and again from T2 to T3. Regarding ‘Work Commitment’, a different pattern was found. There was a significant fall in the mean value from T1 to T2, and a significant rise from T2 to T3 back to about where it started; the difference between the mean values at T1 and T3 was not significant. The dimension covering Evaluations increased all the way through the three measure points from the beginning until the end of the training. For details, see and .
Table 2. Teamwork Indicator – Mean values and SD for the group dimensions. Comparing mean values over time within each of four group dimensions: T1-T2; T2-T3; T1-T3. T1 was early in the group training, T2 was at the mid-phase, and T3 was toward the end of the training. Paired-sample T Tests.
Discussion
Item structure
From the 20-item version of the ‘Teamwork Indicator’, four group dimensions emerged, each with five items. The four group dimensions demonstrated stable item structures over time, i.e. each dimension contained the very same five items when tested independently at the beginning, in the mid-phase and toward the end of the training. This stability indicates that comparisons within the same dimension may be made between the various measure points; the dimensions remain fairly stable over time.
Further scrutiny of the robustness of the item structures shows that they remain unchanged also when tested in various sub-populations, i.e. in relation to sex, program duration and cultural background. The high number of participants allows this kind of testing without loss of the required statistical power. The inventory may be used in English and Norwegian, perhaps also in other languages, without distortions of the item structure of the four group dimensions. The inventory may be used over time in active groups or project work to monitor group dynamics and changes in group management, social climate, work commitment and readiness to undergo evaluations. The internal reliability of the inventory remained high at the various measure points.
The face validity was satisfactory. Qualitatively, the inventory has concept validity; the included items had reiteratively been endorsed for relevance by faculty members involved in EiT. Alternative instruments that directly capture the gist of the four dimensions have been hard to find for the testing of criterion validity.
The TWI share conceptual similarities with other schemes aiming for social, work-related growth among students when it comes to peer-feedback, management, social cooperation, and work commitment. However, the dimension that is gauging attitudes toward evaluations does not seem to be a regular part of such schemes even though these attitudes are essential for successful outcome of the peer evaluations (Yardley, Teunissen, and Dornan Citation2012; Liu and Carless Citation2006; Paquet and Des Marchais Citation1998). This dimension draws the attention to an aspect of the group dynamic that is vital for a positive outcome provided the evaluations are constructive and adequate, not superficial, moralistic, derogatory, or punitive. In this study, the scores on Evaluation increased steadily during the life of the groups, which is likely to reflect an increased student appreciation of the relevance of evaluations. For generalisations and translations of group insights into new situations, higher order conceptualizations are relevant, and they are best obtained by discussing personal experiences of events and functioning within the student group.
Sequence of extraction
The extraction sequence reflects the level of explained variance of each factor. Thus, the sequential placements reflect aspects of the participants’ consistency in the scoring of each dimension. With diverse populations and when the educational aim is behavioral changes in the participants, some alterations in the sequence of extraction would be expected. The Management and Social Cooperation dimensions always emerged first, while Work Commitment and Evaluation reversed places from the mid-phase of the EiT training.
Inversion
The items of the TWI cover various central behaviors and interactive patterns in groups that the faculty regarded as relevant – either as unfortunate or helpful toward the fulfillment of the academic objectives of the group training. However, the dimensions that emerged from the factor analyses point in different directions. After inversion, higher scores on any dimension indicate positive interactive characteristics; this makes the scores easier to understand, use and interpret for the students. On the practical level, the inversion makes it a little harder for the students to guess which dimension the inversed items belong to. No definite cutoff point or norms are given for the interpretation of the pooled dimension scores. Instead, the students are encouraged to discuss the scores and their changes over time in relation to their group experiences. The pooled scores reflect views that reside tacitly or explicitly within the group. A discussion of the scores may bring up topics that have not been aired before or they may expand issues already touched upon. To some extent, the use of the TWI in active learning groups may partly compensate for limited facilitation skills in faculty members, but more important, the reflections and feedback occur in symmetric and not in asymmetric relations, which is likely to increase the cognitive internalisation of the relevant issues (Dochy and Mcdowell Citation1997).
In the long run, reiterated discussions of the members’ contributions and the group interaction may lead not only to interactive changes, but also to a deeper understanding about how individual behaviors and interactive patterns may translate into new contexts, i.e. into the students’ future work life. In line with the transformational learning theory of Mezirow (Mezirow Citation1991), evaluations, i.e. critical reflections on group experiences, are assumed to be a key to higher-order learning. Just having the group experiences is not enough to bring about this transformation (Merriam Citation2004). Sharing and reflecting on group experiences are paramount activities for this type of intellectual growth and insight (Criticos Citation1993), which often has been witnessed in the final process reports written by students in EiT. Moreover, teamwork skills have been coined the twenty-first century skills and are increasingly requested in work life (Sortland and Løje Citation2019).
Characterising group dimensions
When using TWI, the students assess their own group and indirectly themselves. Good management is relevant for goal attainment. Satisfaction has been found to be essential for effective groups, and non-attainment of group goals is unfavorable for group morale (Heslin and Dunphy Citation1964). Related concepts are sometimes referred to as ‘task’ or ‘maintenance behavior’; they relate to effective goal attainment and include discussions and evaluations of ideas manifesting in the group (Pashwan and Gollakota Citation2004).
The dimension ‘Social cooperation’ reflects the social climate, or a sense of group belongingness and cohesion in the group. Conceptually, this may be seen as related to a degree of trust and attachment that members have toward each other. Trust has been closely related to team performance (Erdem and Ozen Citation2003), but also to social satisfaction (Hagstrom and Selvin Citation1965), as well as a consensus about the group status. Group performance, consensus and satisfaction have been considered critical variables in assessing group work (Hackman Citation1990). Groups that score high on similar dimensions perform their tasks better than groups without this shared understanding (Park Citation2008).
Regarding ‘Work commitment’, several authors have used inverted concepts such as free riders or negative attitudes toward common goals (Williams, Beard, and Rymer Citation1991; Pashwan and Gollakota Citation2004). Low levels of this inverted dimension indicate that the members show individualistic attitudes or uncommitted behaviors; they do not contribute much to the group work. The degree of absence of dysfunctional behavior, disruptive participation, domineering, discounting the importance of others, withdrawal from the group or free-riding has been associated with similar features (Pashwan and Gollakota Citation2004).
The learning objectives of EiT program at NTNU state that ‘Students can provide constructive feedback to individual team members and the team as a whole’. The training rests on the assumption that ‘Evaluations’, i.e. shared feedback and self-reflections can modify and improve teamwork, particularly when shared in symmetrical relations, e.g. shared between students or peers, rather than in asymmetrical relations such as between faculty and students. Symmetrical peer evaluations are formative; they are supposed to help students to improve. Peer feedback tends to have more impact and lead to more internalised and permanent understanding and behavioral changes (Williams, Beard, and Rymer Citation1991; Pashwan and Gollakota Citation2004). To have clout, the evaluations should be honest, direct, allied, and constructive, not superficial, vague, antagonistic, or sugarcoated, but frank and friendly. Moreover, evaluations should not be conflict-avoidant. High scores on Evaluations tend to make implicit thoughts, values, and attitudes in the group more explicit and thereby, they address behaviors of individuals, subgroups, and group.
In exceptional instances, however, certain kinds of ‘feedback’ can be used to dominate a group, intimidate members, or to avoid commitment. Provided that the group members do not address such matters themselves, faculty members should intervene if such episodes are observed or reported; behavioral manifestations of this kind are usually regarded to be off limits. Open, direct, adequate, and constructive feedback, on the other hand, is likely to minimise or curb this type of abuse of feedback.
In higher education, peer feedback has lately become more frequently included in educational programs to improve learning (Huisman et al. Citation2018; Hulsman and Van Der Vloodt Citation2015). Giving and receiving feedback is likely to be a future task for most master's students. Accordingly, training of the ability to give good, adequate formative feedback has become more prevalent in higher education (Rodgers et al. Citation2015). In the same vein, training involving peer feedback has been utilised in relation to written, procedural and verbal academic tasks. Some health faculties use peer feedback in the development of communication skills in the patient-health worker interaction (Krause et al. Citation2017).
Dimensional changes
For the management, no improvement was seen from the beginning until the mid-phase; it was only in the second part of the training that a significant change occurred on this dimension. For many students, the transition from individual to conjoint efforts may require some reorientation of mindset. That may be why improved management ratings appeared only in the last part of the group life.
Social cooperation, however, improved right from the start and continued to rise all the way. For Commitment to work, however, there was a significant decline from the beginning to the mid-phase, but the scores returned close to the starting point toward the end. The initial decline in work commitment may be due to relaxation of self-discipline when the training was well started; the students that display this behavior may have regressed to an individualistic style around the mid-phase but mobilised again toward the end. This behavioral propensity may be hard to change in some.
Favorable attitudes toward evaluations, using honest and direct feedback as well as reflections about the group, subgroups and individuals showed a steady rise from beginning until the end. The work-related dimensions, management, and work commitment show less or no progress compared to the two dimensions covering social involvement, i.e. social cooperation and evaluations.
It may be argued that the changes seen in part reflect social desirability in the scoring (Holtgraves Citation2004; Uziel Citation2010), and to a lesser degree real behavioral changes; the students ‘learn’ what is expected and rate accordingly. The TWI's scoring key is not known by the students when deciding how to score their group. Social desirability mostly appears in self-reports. In this case, the students are not rating themselves but their group. The TWI scoring does not affect their grades. Accordingly, there may be less incentive toward impression management and desirability-oriented scoring.
Strengths and limitations of study
A major strength of this study is the high number of participants; the inventory has been tested on close to a total university population of master's students from diverse disciplines over three academic years. A good proportion of the students had mixed cultural backgrounds. The inventory has been tested in two different languages, in relation to cultural diversity, which is likely to reduce cultural bias in the findings. The psychometric properties of this inventory are quite satisfactory.
Ideally, the items of the dimensions should consist of both positively and negatively worded items. However, this type of diversity did not transpire from the item generation process. Moreover, the numerical levels between the mean scores and the standard deviations of the dimensions are quite close, but not directly comparable. It would have been preferable if all mean values had been adjusted to be identical. However, that would make the computation of the scores more complicated and reduce the practical utility of the TWI. As long as the scores are used to initiate discussions about the functioning of the group, the differences between the mean values probably play a lesser role.
Even though the students are advised to be independent, honest, and direct in their ratings, some students may find it hard to express fully their opinion even on paper or digitally. Views held by one person are not likely to affect the group's pooled scores much. However, if the view is shared by two or several students, the pooled scores are far more likely to be clearly swayed.
Any scale is generally tested on a high number of participants to ascertain adequate psychometric qualities. However, this inventory is to be applied in small groups of 5–6 members. In the smaller context, the dimensional scores will have less accuracy than in the approximations made within in the large population. Against this, the students are not given any numerical norms to guide their interpretation. Instead, they are advised to discuss the scores in relation to how they see the functioning of the group, particularly over time, this makes the interpretation qualitative and less bound by the ‘accuracy’ of the mean values.
The four group dimensions consist of items that the faculty members at NTNU regarded as relevant for optimal cooperation and group processes. However, groups could be characterised by other relevant dimensions not included in this inventory. Even so, this inventory captures relevant group dimensions; they carry some similarities to concepts suggested by other researchers. Nevertheless, the item selection process may have overlooked essential dimensions. This study and the literature on related issues originate from Euro-American culture. Dimensions from other cultural settings may not have been included and explored.
Conclusion
The Teamwork Indicator inventory is to be applied to students in active learning groups, teamwork, or project work of some duration when the acquisition of good collaborative skills is a part of the educational objective. Integrated into the curriculum, the TWI may make student evaluations more sophisticated and direct with limited involvement from the faculty. The TWI dimension scores indicate how an active student group is functioning on four central dimensions: the quality of management, social cooperation between team members, work commitment, and the attitudes toward evaluations. On the individual level, the TWI has demonstrated good psychometric properties in relation to temporal and contextual challenges; it allows comparisons over time in diverse cohorts. A future study should explore the outcome on the group level. The TWI dimension scores are preferably to be used for internal discussions and reflections about self, peers, subgroups, and group regarding the contributions, climate, functioning and outcome. In this way, the inventory can add to the development of higher-order insights and meta-cognitive generalisable understanding related to good, productive teamwork in academia, organisations, businesses, and society in general – at the time when the TWI assessments are being made, but also later in the student's future career.
Note
Through this publication, the Teamwork Indicator is regarded by the authors as in the public domain. Anyone interested is free to use it in their educational or business environment. Even so, the authors would appreciate information about experiences in utilising the TWI.
Acknowledgements
We want to thank the master's students at NTNU for their high participation and for making this study possible. Moreover, we want to thank the staff at the Experts in Teamwork Academic Section for their support. In particular, we want to thank Assistant Professor Thomas Espenes for his untiring and swift responses to the many needs and requests we made during the work on this study.
Disclosure statement
No potential conflict of interest was reported by the author(s).
Additional information
Funding
Notes on contributors
Are Holen
Are Holen MD, PhD is a psychiatrist and professor emeritus at the Department of mental health, Faculty of medicine and health sciences at NTNU, Trondheim, Norway. At NTNU, he has served as coordinator of PBL- problem-based learning in medicine. Moreover, he held the position as Dean of Medical Education for five years. For more than a decade, he has been attached to Experts in Teamwork by training faculty members from all departments at NTNU in the use of facilitation and group dynamic. His research has mostly been related to traumatic stress, group processes and active learning in higher education.
Bjørn Sortland
Bjørn Sortland is Associate Professor and Head of the Experts in Teamwork Academic Section at the Department of Industrial Economics and Technology Management, NTNU. He holds a PhD in marine technology, and he has been involved in developing underwater technology at the Department of Marine Technology at NTNU. Throughout his academic career, he has had an interest in project work and team-based education. Since 2002, he has been in charge of Experts in Teamwork at NTNU, which has been recognised with several awards and is now NTNU′s signature course.
References
- Brandshaug, S. W., and E. Sjølie. 2021. “In Liminality: Interdisciplinary Teams Learning Through Challenges.” Higher Education, Skills and Work-Based Learning 11: 406–419.
- Chen, A. S., B. Yau, L. Revere, and J. Swails. 2019. “Implementation, Evaluation, and Outcome of TeamSTEPPS in Interprofessional Education: A Scoping Review.” Journal of Interprofessional Care 33: 795–804.
- Clark, I., and G. Dumas. 2015. “Towards a Neural Basis for Peer-Interaction: What Makes Peer-Learning Tick?” Frontiers in Psychology 6–12: 1.
- Criticos, C. 1993. “Experiential Learning and Social Transformation for a Post-Aparteid Learning Future.” In Using Experience for Learning. Vol. 11, edited by D. Boud, R. Cohen, and D. Walker, 157–168. Buckingham, UK: Open University Press.
- Dahlgren, M. A., A. Reid, L. O. Dahlgren, and P. Petocz. 2008. “Learning for the Professions: Lessions from Linking International Research Projects.” Higher Education 56: 129–148.
- Dochy, F. J., and L. Mcdowell. 1997. “Introduction: Assessment as a Tool for Learning.” Studies in Educational Evaluation 23: 279–298.
- Erdem, F., and J. Ozen. 2003. “Cognitive and Affective Dimensions of Trust in Developing Team Performance.” Team Performance Management 9: 131–135.
- Freeman, S., S. L. Eddy, M. Mcdonough, M. K. Smith, N. Okoroafor, H. Jordt, and M. P. Webderoth. 2014. “Active Learning Increases Student Performance in Science, Engineering, and Mathematics.” Procedings of the National Academy of Sciences of the United States of America 111: 8410–8415.
- Garcia-Aracil, A., S. Monteiro, and L. S. Almeida. 2021. “Students’ Perception of Their Preparedness for Transition to Work After Graduation.” Active Learning in Higher Education 22: 49–62.
- Gerwel Proches, C. N., N. Chelin, and S. Rouvrais. 2018. “Think First job! Preferences and Expectation of Engineering Students in a French 'Grand Ecole'.” European Journal of Engineering Education 43: 309–325.
- Guerra, A., and F. Rodriguez-Mesa. 2021. “Educating Engineers 2030 - PBL, Social Progress and Sustainability.” European Journal of Engineering Education 46: 1–3.
- Hackman, J. R. 1990. “Work Teams in Organisations: An Orienting Framwork.” In Groups at Work (and Those That Didn't): Creating Conditions for Effecttive Teamwork, edited by J. Hackman, 1–14. San Franciso: Jossey-Bass.
- Hagstrom, W. O., and H. C. Selvin. 1965. “Two Dimensions of Cohesiveness in Small Groups.” Sociometry 28: 30–43.
- Heslin, R., and D. Dunphy. 1964. “Three Dimensions of Member Satsfaction in Small Groups.” Human Relations 17: 99–112.
- Holen, A. 2000. “The PBL Group: Self-Reflection and Feedback for Improved Learning and Growth.” Medical Teacher 22: 485–488.
- Holtgraves, T. 2004. “Social Desirability and Self-Reports: Testing Models of Scial Desirability Responding.” Personality and Social Psychology Bulletin 30: 161–172.
- Huisman, B., N. Saab, J. Van Driel, and P. Van Den Broek. 2018. “Peer Feedback on Academic Writing: Undergraduate Students’ Peer Feedback Role, Peer Feedback Perception and Essay Performance.” Assessment & Evaluation in Higher Education 43: 955–968.
- Hulsman, R. L., and J. Van Der Vloodt. 2015. “Self-evaluation and Peer-Feedback of Medical Students’ Communication Skills Using a web-Based Video Annotation System: Exploring Content and Specificity.” Patient Education and Counseling 98: 356–363.
- Inra, J. A., S. Pelletier, N. L. Kumar, E. L. Barnes, and H. M. Shields. 2017. “An Active Learning Curriculum Improves Fellows’ Knowledge and Faculty Teaching Skills.” Advances in Medical Education and Practice 8: 359–364.
- Jibb, L. A., J. S. Khan, P. Seth, C. Lalloo, L. Mulrooney, K. Nicholson, D. A. Nowak, et al. 2020. “Electronic Data Capture Versus Conventional Collection Methods in Clinical Pain Studies: Systematic Review and Meta-Analysis.” Journal of Medical Internet Research 22: e16480.
- Kirkwood, A., and L. Price. 2014. “Technology-enhanced Learning and Teaching in Higher Education: What is 'enhanced' and how do we Know? A Critical Literature Review.” Learning, Media and Technology 39: 6–36.
- Kozlowski, S. W. J. 2018. “Enhancing the Effectiveness of Work Groups and Teams: A Reflection.” Perspectives. on Psychological Science 13: 205–212.
- Kozlowski, S. W., and D. R. Ilgen. 2006. “Enhancing the Effectiveness of Work Groups and Teams.” Psychological Science in the Public interest 7: 77–124.
- Krause, F., G. Schmalz, R. Haak, and K. Rockenbauch. 2017. “The Impact of Expert and Peer Feedback on Communication Skills of Undergraduate Dental Students - a Single-Blinded, Randomized, Controlled Clincal Trial.” Patient Education and Counseling 2017: 2275–2282.
- Lisa, E., K. Khennelova, and D. Newman. 2019. “Comparison Between Employers’ and Students’ Expectations in Respect of Employability Skills of University Graduates.” International Journal of Work- Integrated Learning 20: 71.
- Liu, N.-F., and D. Carless. 2006. “Peer Feedback: The Learning Element of Peer Assessment.” Teaching in Higher Education 11: 279–290.
- Loughry, M. L., M. W. Ohland, and D. L. Williams. 2014. “Assessing Teamwork Skills for Assurance of Learning Using CATME Team Tool.” Journal of Marketing Education 36: 5–19.
- Merriam, S. B. 2004. “The Role of Cognitive Development in Mezirow's Transfformational Learning Theory.” Adult Education Quarterly 55: 60–68.
- Mezirow, J. 1991. Transformative Dimensions of Adult Learning. San Fransisco: Jossey-Bass.
- Paquet, M., and J. Des Marchais. 1998. “Students’ Acceptance of Peer Assessment.” Education for Health 11: 25–35.
- Park, H. S. 2008. “The Effects of Shared Cognition on Group Satisfaction and Performance: Politeness and Efficiency in Group Interaction.” Communication Research 35: 88–108.
- Pashwan, A. K., and K. Gollakota. 2004. “Dimensions of Peer Evaluation, Overall Satisfaction, and Overall Evaluation: An Investigation in Group Task Environment.” Journal of Education for Business 79: 225–231.
- Ramadi, E., S. Ramadi, and K. Nasr. 2016. “Engineering Graduates’ Skill Sets in the MENA Region: A gap Analysis of Industry Expectations and Satisfaction.” European Journal of Engineering Education 41: 34–52.
- Rodgers, K. J., A. K. Horvath, H. Jung, A. S. Fry, H. A. Diefes-Dux, and M. E. Cardella. 2015. “Students’ Perception of and Response to Teaching Assistant and Peer Feedback.” The Interdisciplinary Journal of Problem-Based Learning 9. https://doi.org/https://doi.org/10.7771/1541-5015.1479.
- Sortland, B. 2020. Experts in Teamwork 2021. Handbook for village supervisors and learning assistants, Trondheim, Norway, NTNU, Section for Experts in teamwork.
- Sortland, B., and H. Løje. 2019. Implementing twenty-first century skills in education at NTNU and DTU. Procedings of SEFI, European Society of Engineering Education, Annual conferende 16–19 September 2019, 1–10.
- Tang, K. H. D. 2020. “Personality Traits, Teamwork Competencies and Academic Performance among First-Year Engineering Students.” Higher Education, Skills and Work-Based Learning 11: 9: 367–385.
- Trede, F., R. Braun, and W. Brookes. 2021. “Engineering Students’ Expectations and Perceptions of Studio-Based Learning.” European Journal of Engineering Education 46: 402–415.
- Uziel, L. 2010. “Rethinking Social Desirability Scales: From Impression Mangagement to Interpersonally Oriented Self-Control.” Perspectives on Psychological Science 5: 243–262.
- Van Gennip, N., M. Segers, and H. Tillema. 2010. “Peer Assessment as a Collaborative Learning Activ ity: The Role of Interpersonal Variables and Conceptions.” Learning and Instruction 20: 280–290.
- Veine, S., M. K. Anderson, N. H. Andersen, T. C. Espenes, T. B. Søyland, P. Wallin, and J. Reams. 2020. “Reflection as a Core Student Learning Activity in Higher Education - Insights from Nearly two Decades of Academic Development.” The International Journal for Academic Development 25: 147–161.
- Williams, D. L., J. D. Beard, and J. Rymer. 1991. “Team Projects: Achieving Their Full Potential.” Journal of Marketing Education 13: 45–53.
- Yardley, S., P. W. Teunissen, and T. I. M. Dornan. 2012. “Experiential Learning: Transforming Theory Into Practice.” Medical Teacher 34: 161–164.