
ABSTRACT
Post-course instructor ratings are a common practice at universities in Europe, Australia, and North America. Rather than solely describing teaching practice, however, such ratings may be associated with a range of non-pedagogical factors. We explored engineering students’ instructor ratings at a large United States institution, investigating relationships between overall instructor rating and some of those non-pedagogical factors, including subject area, class size, and students’ course grades. Instructor ratings were more favourable in humanities courses than in science or math courses, and students gave higher ratings to instructors who taught smaller class sizes. The strongest relationship existed between overall rating and students’ course grades: students who received A’s rated instructors an average 0.84 points higher on a 6-point scale than students who received F’s. Students who withdrew from a course provided the lowest instructor ratings. When instructor ratings are used as metrics of teaching ability in discussions related to promotion, tenure, or salary adjustments, there is an inherent inequity in the system that must be acknowledged beyond already well-documented biases, as non-pedagogical factors often outside of the instructor’s control may be significantly associated with those ratings.
Introduction
In universities in Europe, Australia, and North America, it is common to ask students to complete post-course questionnaires rating their instructor’s teaching effectiveness (Richardson Citation2005; Strumm Citation2019). These questionnaires, often referred to as Student Ratings of Instruction (SRIs), can provide useful formative feedback for instructors, offering insight into their pedagogical strengths and weaknesses (Marsh Citation2007). As no single set of behaviours defines teaching excellence (Baglione and Tucci Citation2019), SRIs often include items specific to a range of pedagogical practices and approaches, such as course organisation, presentation of material, grading, communication, and interactions with students (Medina et al. Citation2019).
These ratings may serve multiple purposes depending on the institution. When used appropriately, a primary goal of SRIs is to provide diagnostic and formative feedback to instructors (Strumm Citation2019) to improve course delivery and student learning. Beyond that goal, departments may merge results among multiple instructors to gain insight into teaching and learning processes across multiple sections of the same course or to compare students’ views of different pedagogical approaches (Hativa Citation2013). Finally, and perhaps most controversially, student ratings also may be included in discussions related to promotion, tenure, and merit-based salary raises, where a single ‘overall rating’ score is used as a metric of teaching ability (Strumm Citation2019)—our paper problematises such an approach by exploring some of the factors beyond teaching practices—and outside of instructors’ control—that may partially drive evaluations of teaching for engineering students.
Literature review
As multiple studies have demonstrated, SRI scores may be associated with a number of non-pedagogical factors unrelated to an instructor’s teaching ability or pedagogical techniques. Much of the work in this area has focused on equity biases related to the race, gender, native language, and disability status of instructors and students. These biases are complex and often lead to more variability in the data and greater difficulty in interpreting results (Strumm Citation2019), but some general patterns are consistent. Students tend to rate male instructors more favourably than female instructors; in experiments involving identical online courses, instructors received lower scores when students believed their instructor was a woman (MacNell, Driscoll, and Hunt Citation2015). Traditional gender roles appear to play a larger role in student biases than does gender itself, whereby female faculty are rated higher if they demonstrate sensitivity and warmth (Freeman Citation1994; Laube et al. Citation2007). Female instructors who did not conform to this ‘feminine’ gender role were rated more negatively by both male and female students (Sprague and Massoni Citation2005). Few studies have directly explored race in SRIs, partly because of the large underrepresentation of faculty of colour in academia (Benton and Cashin Citation2014; Smith Citation2009). In general, instructors of colour receive lower evaluation scores than white colleagues (Chávez and Mitchell Citation2020). Furthermore, instructors with non-English accents receive lower ratings than their native English-speaking counterparts (Fan et al. Citation2019). These equity-associated biases have led some in academia to call for the elimination of student evaluations of instruction (Chávez and Mitchell Citation2020; MacNell, Driscoll, and Hunt Citation2015). A recent literature review of SRI research asserted that no university, and indeed the higher education sector as a whole, can declare to be a gender equal employer or have an interest in growing a safe, inclusive and diverse workforce if they continue using SETs [student evaluations of courses and teaching] to evaluate course and teacher quality (Heffernan Citation2022, 152).
Despite representing the bulk of the prior research on biases associated with SRIs, racial and gender biases are not the only factors potentially affecting students’ ratings of instructors—we explore some of those other variables that fall outside of an instructor’s control within the undergraduate engineering context. Course-related factors, including subject area, course level, and course difficulty, may also be associated with student ratings. Students who self-identify as being interested in a course’s subject area provide higher average instructor ratings for that particular course (Nasser and Hagtvet Citation2006), regardless of the subject, but specific disciplines tend to receive higher ratings than others. In general, instructors of courses in the humanities and the arts often receive the most favourable ratings, whereas instructors in the sciences receive lower ratings (Neumann Citation2001; Ory Citation2001). Furthermore, undergraduate students may rate required, upper-level courses lower than elective or lower-level courses (Nargundkar and Shrinkhande Citation2014). Differences in ratings associated with subject area and course level may relate to course difficulty, where students have a tendency to rate a course less favourably if they felt unprepared for it or if they perceived it to be too challenging (Benton and Ryalls Citation2016). For example, Addison, Best, and Warrington (Citation2006) found that students who thought a psychology class was easier than expected evaluated the instructor more favourably than did students who thought the course was more difficult than expected, regardless of the course grade earned. Overall, course characteristics, such as discipline, course level, and difficulty, can be associated with instructor ratings.
Specific aspects of the course environment have also been shown to relate to instructor ratings. Although some studies have shown that students in online and in-person classes provide similar course ratings (Strumm Citation2019), Young and Duncan (Citation2014) found that students in online courses rated instructors less favourably, primarily because of communication challenges in online courses. With the recent shift to online learning in higher education tied to COVID-19, more research on this topic will likely be published soon. Among in-person classes, differences in instructor ratings relative to class size have been mixed, with most studies showing little or no significant association with class size. However, Bedard and Kuhn (Citation2008) found that economics students in larger classes viewed their instructors less favourably than did students in smaller classes, when responses were controlled for instructor and course effects.
Course grade is another factor shown to be related to instructor rating, with researchers finding that higher grades correlated with higher ratings (Addison, Best, and Warrington Citation2006; Nasser and Hagtvet Citation2006). Some authors noted, however, that instructor ratings were not solely associated with grade (Wright Citation2006). When Addison, Best, and Warrington (Citation2006) controlled for the grade earned, they found that expectations of course difficulty drove course ratings. In general, however, grades and instructor ratings were directly correlated, leading to the question of whether this finding suggests that better teachers help students earn better grades, or if it shows that inflated grades result in higher ratings. Regardless, distribution of grades is an important consideration when evaluating SRIs, particularly when SRIs are used to inform other decision-making practices, such as opportunities for promotion, tenure, or merit-based salary adjustments..
Our study focus
These previous studies have demonstrated that SRI scores can be associated with a wide range of factors beyond the effectiveness of an instructor’s teaching. Much of the previous work on the subject has focused on factors in isolation (such as class size or course grade), and often for specific class subjects or in studies with small sample sizes. Overall, the current literature on this topic is largely a compilation of context-specific case studies focused on single courses (Strumm Citation2019). Furthermore, much of the recent research has focused on equity-related biases related to a teacher’s gender, race, ethnicity, language, and/or disability status. This research is crucial to both understanding and improving the educational system. However, the recent literature has not focused as heavily on the other course-related and grade-related factors that also are associated with ratings biases—our research builds the literature base within this latter set of factors and focuses on the undergraduate engineering context broadly, thus extending the context under investigation from prior work.
In this study, we used a large dataset to explore multiple non-pedagogical factors that could be associated with instructor ratings given by undergraduate students across all of their undergraduate courses at a large research-intensive institution in the United States. Specifically, we investigated how the course subject (i.e. the specific disciplines of the course in which the engineering students enrolled), level, class enrolment size, and students’ course grades related to overall instructor ratings by engineering students—engineering students within the U.S. context tend to enrol in a fairly consistent set of early year courses that have been widely written about as being important for persistence to degree (e.g. Lord and Chen Citation2014; Reeping et al. Citation2019). By viewing these factors concurrently, we quantify the relative contribution of each factor to the overall rating score of instructors. This approach to analyzing non-pedagogical factors concurrently across a wide range of courses for all undergraduate engineering students is a new contribution to the literature base.
Methods
Study population
The study population included undergraduate students at a large land-grant university in the southeastern United States. Only students who were enrolled in the College of Engineering for at least one semester during the study period of September 2011 to December 2018 were included in the study. This scoping enabled us to explore a consistent set of undergraduate courses that stretched across multiple academic departments and colleges for a large sample of undergraduate engineering students. The sample included students who majored in engineering, transferred into or out of engineering majors, or did not matriculate into a degree-granting major but began their paths within the College of Engineering. Engineering students comprised approximately 31% of all undergraduate students at this university during the study period.
Sample characteristics
The sample included data from 18,900 unique undergraduate engineering students, who provided 203,115 instructor ratings. Similar to the population of engineering students nationally and at this institution, the sample of engineering students was predominantly male, was not from racially minoritized subpopulations, and tended to not be from student groups described by the university as underserved ().
Table 1. Demographic characteristics of study population of undergraduate engineering students.
Student ratings of instruction
We constructed a university-level dataset that included course-level information (i.e. course subject, course number, and enrolment), the student’s course grade, and the student’s ratings of the instructor. To build this data set, we followed a series of data security and confidentiality procedures as agreed upon between the researchers and university administration; the university’s institutional review board approved the study. The voluntary SRI was administered near the end of every course at the university prior to students’ final exams and receipt of their final grades. Although students did not have their final grade in the course when completing the SRI, students within this context would have knowledge of the majority of their grade calculation for the semester at the time of completing the SRI (e.g. grades on mid-term assessments, tests, quizzes, homework, projects). The SRI contained seven statements related to the instructor’s preparation, presentation, feedback, and respect demonstrated, as well as how the course affected the student’s understanding of and interest in the subject matter. Students responded to the statements using a six-point Likert scale, from 1 = Strongly Disagree to 6 = Strongly Agree. For this study, we focused our analyses on the survey item, ‘Overall, the instructor’s teaching was effective.’ This focus was motivated by the fact that the results from this single survey item are often used in departmental, college-level, and university-level evaluations of faculty teaching, including promotion and tenure review processes, as this overall rating is assumed to incorporate the attributes of the other survey questions. Focusing on one overall item is also consistent with the ways in which other institutions conduct such evaluations (Strumm Citation2019).
We conducted a robustness check of survey data to quantify the degree to which this ‘overall’ rating accurately summarised the responses to other survey questions, calculating the correlation among the survey questions, as well as the correlation between the ‘overall’ rating and the mean of the other six questions. The mean value of the six specific questions was highly correlated with the ‘overall’ rating we examined in this study (; correlation coefficient = 0.91), thereby demonstrating that the overall rating summarised multiple aspects of the student’s perceptions of the course. However, the overall rating may miss some of the nuances in the data that may best inform improvements to teaching practices (). The overall rating was most highly correlated with the statement, ‘The instructor presented the subject matter clearly,’ but was least correlated with the statement, ‘The instructor fostered an atmosphere of mutual respect,’ for example. Future research and practice could consider more focused analyses, but we elected to centre our analyses on the item used in decision-making, as is the standard practice at other institutions (Strumm Citation2019).
Table 2. Correlation among questions in student ratings of instructors. This study focused on the overall rating, from the survey statement ‘Overall, the instructor’s teaching was effective.’
Analyses
To quantify the relationship between non-pedagogical factors and instructor ratings, we explored patterns and differences in overall instructor rating by: 1) course subject; 2) course level, 3) class enrolment, and 4) course grade. In analyses by subject area, we only included subjects for which the data contained at least 1000 ratings. For course level, we grouped courses by 1000-level increments, where 1000-level courses were introductory courses, and 4000-level courses were the most advanced undergraduate courses. We categorised course enrolment sizes into four levels: 1–30 students, 31–60 students, 61–100 students, or more than 100 students. Course grades were reported on the A-F letter scale, with ‘plus’ and ‘minus’ grades (e.g. B+, C-). Ratings provided by students who received a grade of pass, fail, incomplete, or audit were not included in analyses, although ratings from students who withdrew from a course (W) were included.
We calculated the mean overall instructor rating, number of responses, and response rate for each category of the non-pedagogical factors. ANOVA was used to test for significant differences in ratings among categories, and Tukey tests were conducted to identify which specific means differed (De Winter and Dodou Citation2010). After analyzing each non-pedagogical factor individually, we conducted regression analyses with categorical variables to quantify the relative contribution of each non-pedagogical factor to the overall instructor rating. The data met the assumptions for categorical regression: linearity, independence of errors, equal variance of errors, and normality of errors. All analyses were conducted using R (R Core Team Citation2019), and graphs of the distribution of Likert-scale responses were prepared using the likert package for R (Bryer and Speerschneider Citation2016).
Limitations
We acknowledge that this analysis focused on a single institution within a particular national context. However, our work represents an advance beyond prior work by focusing on a large set of courses taken by students enrolled in a College of Engineering as opposed to prior work that has focused on more limited course contexts. Moreover, the institution under investigation is similar to many other large engineering colleges that have similar educational environments and processes of teaching evaluations.
In addition, we also acknowledge, that the dataset did not include demographic characteristics of the instructors. Thus we limit the scope of our investigation to other non-pedagogical factors associated with the course. Instructor-level demographic information was not accessible according to the university’s data sharing policies pertaining to employee-level data. Moreover, as our review of the literature noted, there is an abundance of research that has explored such biases in SRIs. Our investigation makes a different contribution that is distinct from that prior work that has repeatedly demonstrated biases in SRIs as a function of instructors’ demographics throughout the literature. A preliminary investigation of ratings by student demographic group showed similar SRI ratings by students’ gender, race, or ethnicity; we therefore combined all student demographic groups for analyses and do not disaggregate results by students’ demographics because no new information would be gleaned from a disaggregated presentation of results.
Results
Course subject area
Engineering students’ responses to the statement ‘Overall, the instructor’s teaching was effective’ differed significantly among course subjects on which students reported (). The vast majority of students enrolled in all subjects rated teachers favourably (4, 5, or 6 on Likert scale). However, students gave the lowest instructor ratings in Statistics and Computer Science classes, whereas English and General Engineering instructors received the highest mean ratings (). Overall, courses in the humanities tended to receive higher ratings (and had higher response rates) than courses in the sciences from our sample of engineering students.
Figure 1. Undergraduate engineering students’ overall rating of course instructor, by course subject, where ‘6’ is a highly favourable rating.
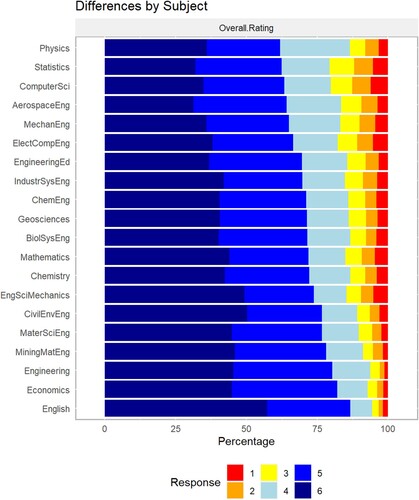
Table 3. Mean overall instructor ratings, sample sizes of instructor reviews, and response rates, by course subject.
Course level
Distributions of student ratings were significantly different among some course levels, where 1000-level courses represent the entry-level courses usually taken by first-year students, and 4000-level courses include specialty courses within a student’s major (). The mid-level courses (2000 and 3000) did not differ from each other, but all other pairs were significantly different, albeit practically quite similar across the course levels (). Students in upper-level courses were less likely to respond to the instructor survey.
Figure 2. Undergraduate engineering students’ overall rating of course instructor, by course level, where ‘6’ is a highly favourable rating.
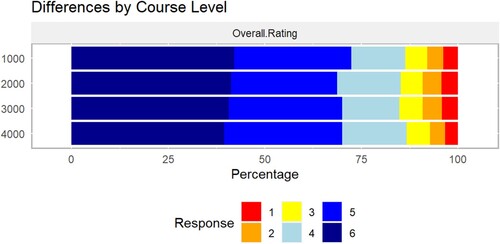
Table 4. Mean overall instructor ratings, sample sizes, and response rates, by course level. Mean ratings followed by different letters are statistically different at p ≤ 0.01 (Tukey’s test).
Class size
Regardless of course subject or course level, students gave significantly higher overall ratings to faculty who taught smaller class section sizes (). On average, instructors with a class section size of 30 or fewer students scored 0.23 points higher (on a six-point scale) than colleagues who taught class sections with more than 100 students (; p < 0.001 for Tukey’s test).
Figure 3. Undergraduate engineering students’ overall rating of course instructor, by class size, where ‘6’ is a highly favourable rating.
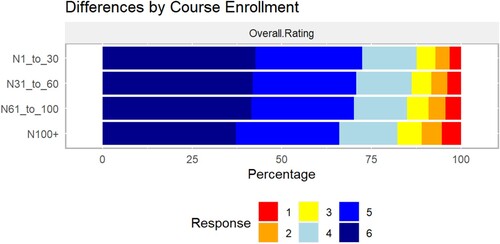
Table 5. Mean overall instructor ratings, sample sizes, and response rates, by class size category. Mean ratings followed by different letters are statistically different at p ≤ 0.01 (Tukey’s test).
Student course grade
The most striking pattern in instructor ratings was related to course grade: students who received better grades provided significantly higher instructor ratings than students who received poor grades or withdrew from the course (). On average, students who received A’s rated their instructors 0.54 points higher than did students who received C’s (p < 0.001 for Tukey’s test) and 0.84 points higher than students who failed the course (; p < 0.001 for Tukey’s test). However, more than half of students who failed a course still ‘Strongly Agreed’ or ‘Agreed’ that the instructor’s teaching was effective. Students who withdrew from a course typically gave the lowest ratings of their instructors. Furthermore, response rates also decreased as course grade decreased, with 55% of A students providing a rating, but only 20% of students who received an F rating their instructor ().
Figure 4. Undergraduate students’ overall rating of course instructor, by course grade, where 6 is a highly favourable rating. ‘W’ designates students who withdrew from the class during the semester.
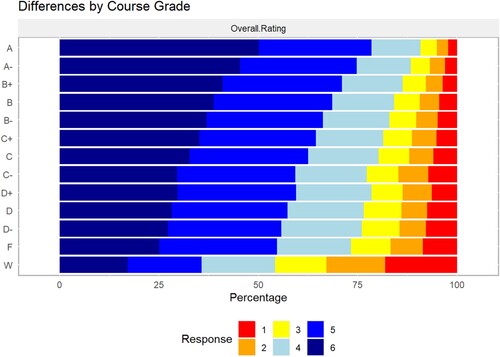
Table 6. Mean overall instructor ratings, sample sizes, and response rates, by final course grade.
Categorical regression
The linear regression of categorical variables identified that subject, course level, enrolment, and student grade were all significant predictors of overall instructor rating when included in the same model (). Of these factors, a student’s grade in the course had the strongest association with overall course rating. The table of contrasts () from the regression model shows the effects of specific values of each categorical variable on overall rating. For example, students rated instructors of statistics courses (STAT) 0.21 points lower (on a 6-point scale) than they rated instructors of Engineering Education (ENGE) courses (i.e. courses taken by all first year engineering students). For the course grade variable, students who withdrew from a course rated their instructors 1.55 points lower than did students who received an A. This multiple regression analysis quantifies the relative impacts of the different non-pedagogical categories and variables that relate to overall instructor ratings.
Table 7. ANOVA table for multiple categorical regression to predict overall instructor rating.
Table 8. Contrasts for multiple categorical regression to predict overall instructor rating.
Discussion
As we note in the review of the literature, a growing body of evidence has shown that students’ evaluations of teaching are rife with biases based on teachers’ demographics. Our analysis explored the extent to which other non-pedagogical factors, including course subject area, course level, enrolment size, and course grade, many of which fall outside of the instructors’ control, related to evaluation scores. Our findings extend the literature base by focusing on this set of non-pedagogical factors for the undergraduate engineering context broadly, thus extending work done on small-scale contexts in previous work.
Course subject area
Student Ratings of Instructions (SRIs) significantly related to a number of non-pedagogical factors, many of which are outside of the instructor’s control. One such factor was the subject area or discipline of the course. Students (and instructors) all have favourite subjects and dreaded subjects, but it is important to recognise that such personal preferences may influence students’ ratings of their course instructors, as has been shown previously in smaller-scale studies (e.g. Neumann Citation2001). In particular, this difference may affect ratings for faculty members who are assigned to teach required engineering courses that reside outside a student’s primary major (i.e. service courses, such as when students from multiple engineering disciplines take a common engineering statics or dynamics course). Furthermore, we see patterns in ratings by general subject area: instructor ratings were most favourable for the humanities, slightly lower for engineering and the sciences, and least favourable for mathematics and statistics courses, which aligns with smaller-scale prior work (Nasser and Hagtvet Citation2006; Ory Citation2001). All of these ratings were made by engineering students across the range of engineering subdisciplines, and so it was a bit surprising that even among students who would likely have a greater affinity toward math courses than students from many other majors, these courses had lower SRI ratings.
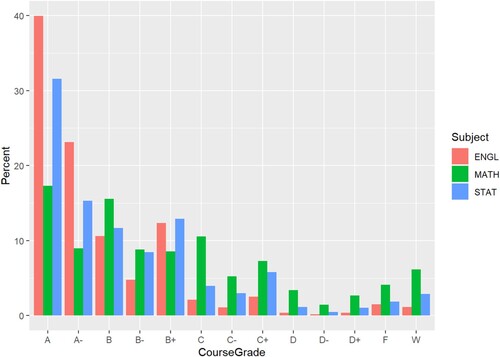
There are a number of potential explanations for these patterns. We found that grades were very closely associated with instructor ratings (), with students who received high grades also giving favourable ratings, a finding that also aligned with prior smaller-scale studies (Addison, Best, and Warrington Citation2006; Nasser and Hagtvet Citation2006). The typical distribution of grades in different disciplines may therefore play a role in the subject-specific differences that we observed in ratings. For example, 63% of students in English courses in this study received a course grade of A or A-, as compared to only 26% of students enrolled in Math classes and 47% of students in Statistics classes (). When grade distributions differ among subject areas, our findings and prior research would anticipate distributions of instructor ratings to differ, as well. Thus, our findings suggest that interpretations of teaching effectiveness scores also should take into account the grade distributions associated with the course, particularly when making comparisons across subject areas.
Figure 5. Distribution of course grades for English (ENGL), Mathematics (MATH), and Statistics (STAT) courses, where ‘W’ denotes course withdrawal.
In addition, subject areas often have different instructional approaches, with each discipline having its own ‘signature pedagogy’ (Shulman Citation2005). A discipline’s concrete acts of teaching and learning are derived from the field’s assumptions about the best ways to teach and the underlying moral beliefs that guide the profession. Whether this involves conducting lab experiments in the sciences, discussing alternative views in the humanities, or calculating proofs in mathematics, a signature pedagogy aims to have students develop the cognitive, physical, and emotional habits that will allow them to succeed in the profession. Students may rate some of these signature pedagogies (and, as a result, the instructors) more favourably than others, particularly in disciplines that may incorporate more active learning, personalised attention, and discussion (Benton and Cashin Citation2014). Disciplines that rely more heavily on lectures (e.g. math, statistics, sciences) may therefore tend to earn less favourable student ratings (Neumann Citation2001).
Course level
In addition to differences in instructor ratings among subject areas, we also observed some differences among course levels, albeit small. After grouping courses into 1000-level (introductory), 2000-level, 3000-level, and 4000-level (advanced) courses, we found significantly lower instructor ratings in the mid-level courses (). This ‘sophomore slump’ in ratings could result from shifting expectations and difficulty levels; these mid-level courses are likely more challenging than introductory courses, thereby potentially affecting instructor ratings (Lord and Chen Citation2014). By the time students reach the advanced 4000-level courses, however, they have gained skills to help them navigate college courses, have adjusted their expectations, or the students who have received lower grades early in the curriculum have not persisted in the major to these upper-level courses. Another potential explanation for differences in rating by course level is that some departments may select their ‘best’ instructors for the introductory and/or advanced courses to boost students’ interest in the discipline and to oversee ‘capstone’ courses in the field, which can happen at the study institution and similar institutions like it. Regardless of the driver, it is important for departments to be aware of systematically slightly lower student satisfaction during mid-level courses.
Class enrollment
Although most previous studies showed little relationship between class size and instructor ratings, we found that instructors of smaller classes received significantly more favourable ratings than did instructors of the largest classes (). In small and mid-sized classes, students may receive more personal attention from the instructor, leading to higher ratings (Bedard and Kuhn Citation2008). Furthermore, students often rate instructors more favourably when active, learner-centered pedagogies are used in the classroom (Bedard and Kuhn Citation2008), and such learner-centered teaching may be more feasible in classes with fewer students (Kinoshita, Knight, and Gibbes Citation2017). Smaller class sizes have other benefits, as well, including greater student achievement and learning (Diette and Raghav Citation2015) and increased student retention and graduation rates (Millea et al. Citation2018). Although large classes are often a logistical necessity, myriad benefits occur when enrolment sizes are smaller—our findings suggest that review committees (e.g. promotion and tenure, annual reviews) should take into account section sizes when evaluating the teaching effectiveness scores.
Course grade
The strongest pattern that we observed in the ratings of instructors was related to course grades. Students who received higher grades in a class provided significantly higher ratings of their instructors (). We would hope that this finding demonstrates that good teachers help students learn and earn good grades, making both the high ratings and good grades accurate measures of achievement. However, it is important to consider an alternative explanation: teachers who award high grades receive favourable ratings, regardless of students’ learning and educational experiences (Clayson Citation2009). Additional research could explore relationships between SRIs and student achievement, such as performance in subsequent courses or on standardised assessments. Without measuring student learning more specifically via a carefully constructed assessment mechanism applied consistently across multiple sections and instructors of the same course (rather than grades that can incorporate a variety of different elements), it is impossible to rule out effects of potential grade inflation on teacher effectiveness scores.
Although students with the highest grades also gave the highest ratings to their instructors, the least favourable SRIs were from students who withdrew from the course, not from students who failed the course. More than half of students who received a failing grade (and submitted SRI responses) still rated their instructor’s teaching as effective (). Does this show that these failing students took responsibility for their failing grades? Or does the finding identify a ‘ratings inflation,’ whereby we have become conditioned to provide positive ratings for services and items, regardless of actual quality? Our data cannot answer those questions but does highlight potential avenues for further inquiry on the topic.
Large differences in response rates by course grades exacerbate this problem. While 55% of students who received A’s responded in the SRI, only 20% of students who failed a class rated their instructors (). Assuming that non-responding students would have rated instructors similarly to others who received the same course grade, mean instructor ratings are biased high –SRIs are undercounting the likely low ratings from students with low grades who did not respond to the request for feedback. If the primary goal of SRIs is to improve instructor teaching and the educational experience, departments need to obtain this information from students who performed poorly or withdrew from the course. These struggling students might provide highly valuable formative assessments for instructors.
Comparison of factors
By looking at subject, course level, enrolment, and grades individually, we identified that each factor significantly relates to overall instructor rating. Building on this finding, we also conducted a categorical regression of these non-pedagogical to quantify the relative contribution of each factor when predicting overall SRI scores (). The level of the course had the least strong relationship with overall ratings, with the rating for 4000-level courses only slightly higher than ratings for lower-level classes. The subject of the course had a substantially larger relationship with SRIs; teaching one of the favoured subject areas was associated with a bump of 0.4 points in an instructor’s rating. Class enrolment was another mid-level relative contributor to overall instructor rating, but differences in class size only translated to about 0.1 points in rating. By far, the non-pedagogical factor most strongly related to overall instructor ratings was the course grade. Students who received a failing grade scored their instructors 0.8 points lower than students who received A’s in the course, with a cascading relationship throughout the grade distribution. Students who withdrew from a course imposed an even larger ‘penalty’ on the teaching effectiveness score: 1.6 points lower than students who received an A. For instructors of challenging courses that traditionally have high withdrawal rates and failure rates, their rating scores may be more reflective of the difficulty of their course than of their teaching skill or effectiveness. This finding raises important implications for how SRI ratings are used for making decisions about faculty members’ career advancement. If a faculty member is assigned to teach a course that has had lower grade distributions historically, institutions should recognise that our findings demonstrate that student evaluations would be expected to be lower on average.
Conclusion
Students’ ratings of their instructors can provide valuable information for faculty and departments, but it is important to recognise that non-pedagogical factors may be associated with those ratings. When these ratings are used as metrics of teaching ability in discussions related to promotion, tenure, or merit-based salary increases, there is an inherent inequity in the system that must be acknowledged; for example, our data from college of engineering students suggest that an instructor of a small, introductory English course will likely receive more favourable ratings than a comparable instructor who is teaching a challenging statistics course in a large lecture hall. When departments and institutions emphasise the importance of high SRI values as indicative of pedagogical skill, they are providing an incentive for instructors to exploit factors that may affect student ratings, such as inflating grades or requesting to teach less-challenging courses. This concern raises additional equity questions of differences among faculty members with respect to their level of agency regarding their teaching assignments. Departments should strive to increase student learning, not instructor ratings, particularly since these two metrics may not even be correlated (Uttl, White, and Gonzalez Citation2017).
To gain the most benefits from SRIs, it is important to remember that the overall goal is to provide formative feedback for instructors. With this in mind, seeking anonymous student feedback in the middle of the semester may be more useful to the instructor than waiting until the course has been completed, and mid-semester student comments and ratings can improve a student’s own experiences in that course. Additionally, obtaining responses from students at all levels of course grades and from those who withdrew from the course might be more successful at this point in the semester, as well, which would provide a more balanced view of instructors. Finally, departments should consider incorporating additional approaches to assessing teaching and finding ways to integrate those approaches into decisions about faculty career advancement. SRIs can provide one data point, but instructors and departments would get a more complete picture of teaching performance by supplementing SRI scores with self-evaluations, peer evaluations, classroom observations, and measurements of student outcomes (Berk Citation2018). As our comprehensive analysis of engineering students’ evaluations of teaching demonstrates, a range of non-pedagogical factors about the characteristics of courses that fall outside of instructors’ control relate to these ratings. Our findings join prior studies of non-pedagogical factors that have focused on instructors’ demographics shown repeatedly to influence students’ ratings of teaching. In combination, institutional decision-makers should critically consider the range of ways that biases can enter students’ evaluations of teaching and the extent to which equity across faculty members can be ensured.
Acknowledgments
This work is based on research supported by the National Science Foundation DUE- 1712089. Any opinions, findings, conclusions, or recommendations expressed are those of the authors and do not necessarily reflect the views of the National Science Foundation. This study was approved by the by the researchers’ Institutional Review Board (17-432). We thank Andrew Katz, Natasha Smith, Matthew Norris, Abdulrahman Alsharif, and Homero Murzi for their input throughout this study.
Disclosure statement
No potential conflict of interest was reported by the author(s).
Data availability statement
Select anonymized data in aggregate are available upon request.
Additional information
Funding
Notes on contributors
Michelle D. Klopfer
Michelle Klopfer is a post-doctoral researcher in the Department of Engineering Education at Virginia Tech. Her research involves exploration of large educational datasets, with a focus on engineering and science pathways.
David B. Knight
David Knight is an Associate Professor in the Department of Engineering Education at Virginia Tech. His research leverages large-scale institutional, state, or national datasets, and considers the intersection between policy and organisational contexts.
Jacob R. Grohs
Jacob Grohs is an Associate Professor in the Department of Engineering Education at Virginia Tech. His research focuses on systems thinking and community engagement as vehicles for positively affecting education.
Scott W. Case
Scott Case is the Reynolds Metals Professor in Structural Engineering and Materials at Virginia Tech. His research interests are in the experimental characterisation and modelling of engineering materials and structures.
References
- Addison, W. E., J. Best, and J. D. Warrington. 2006. “Students’ Perceptions of Course Difficulty and Their Ratings of the Instructor.” College Student Journal 40 (2): 409–416.
- Baglione, S. L., and L. A. Tucci. 2019. “Students’ Perceptions of Teaching Excellence: A Tradeoff Analysis.” Marketing Education Review 29 (3): 154–163. https://doi.org/10.1080/10528008.2019.1642114
- Bedard, K., and P. Kuhn. 2008. “Where Class Size Really Matters: Class Size and Student Ratings of Instructor Effectiveness.” Economics of Education Review 27 (3): 253–265. https://doi.org/10.1016/j.econedurev.2006.08.007
- Benton, S. L., and W. E. Cashin. 2014. “Student Ratings of Instruction in College and University Courses.” In Higher Education: Handbook of Theory & Research, edited by M. B. Paulsen, Vol. 29, 279–326. Dordrecht, The Netherlands: Springer.
- Benton, S. L., and K. R. Ryalls. 2016. Challenging Misconceptions About Student Ratings of Instruction (IDEA Paper No. 58). Manhattan, KS: The IDEA Center. https://www.ideaedu.org/Portals/0/Uploads/Documents/IDEA%20Papers/IDEA%20Papers/PaperIDEA_58.pdf.
- Berk, R. 2018. “Start Spreading the News: Use Multiple Sources of Evidence to Evaluate Teaching.” The Journal of Faculty Development 32 (1): 73–81.
- Bryer, J., and K. Speerschneider. 2016. likert: Analysis and Visualization Likert Items. R package version 1.3.5. https://CRAN.R-project.org/package=likert.
- Chávez, K., and K. M. Mitchell. 2020. “Exploring Bias in Student Evaluations: Gender, Race, and Ethnicity.” PS: Political Science & Politics 53 (2): 270–274. https://doi.org/10.1017/S1049096519001744
- Clayson, D. E. 2009. “Student Evaluations of Teaching: Are They Related to What Students Learn? A Meta-Analysis and Review of the Literature.” Journal of Marketing Education 31 (1): 16–30. https://journals.sagepub.com/doi/10.1177/0273475308324086.
- De Winter, J. F. C., and D. Dodou. 2010. “Five-point Likert Items: T Test Versus Mann-Whitney-Wilcoxon.” Practical Assessment, Research, and Evaluation 15 (1): 11.
- Diette, T. M., and M. Raghav. 2015. “Class Size Matters: Heterogeneous Effects of Larger Classes on College Student Learning.” Eastern Economic Journal 41 (2): 273–283. https://doi.org/10.1057/eej.2014.31.
- Fan, Y., L. J. Shepherd, E. Slavich, D. Waters, M. Stone, R. Abel, and E. L. Johnston. 2019. “Gender and Cultural Bias in Student Evaluations: Why Representation Matters.” PloS one 14 (2): e0209749. https://doi.org/10.1371/journal.pone.0209749.
- Freeman, H. R. 1994. “Student Evaluations of College Instructors: Effects of Type of Course Taught, Instructor Gender and Gender Role, and Student Gender.” Journal of Educational Psychology 86 (4): 627–630. https://doi.org/10.1037/0022-0663.86.4.627
- Hativa, N. 2013. Student Ratings of Instruction: Recognizing Effective Teaching. Charleston, SC: Oron Publications.
- Heffernan, T. 2022. “Sexism, Racism, Prejudice, and Bias: A Literature Review and Synthesis of Research Surrounding Student Evaluations of Courses and Teaching.” Assessment & Evaluation in Higher Education 47: 144–154. https://doi.org/10.1080/02602938.2021.1888075.
- Kinoshita, T. J., D. B. Knight, and B. Gibbes. 2017. “The Positive Influence of Active Learning in a Lecture Hall: An Analysis of Normalised Gain Scores in Introductory Environmental Engineering.” Innovations in Education and Teaching International 54 (3): 275–284. https://doi.org/10.1080/14703297.2015.1114957.
- Laube, H., K. Massoni, J. Sprague, and A. L. Ferber. 2007. “The Impact of Gender on the Evaluation of Teaching: What we Know and What we Can do.” NWSA Journal 19: 87–104. https://www.jstor.org/stable/40071230.
- Lord, S. M., and J. C. Chen. 2014. “Curriculum Design in the Middle Years.” In Cambridge Handbook of Engineering Education Research, edited by A. Johri and B. M. Olds. New York, NY: Cambridge University Press.
- MacNell, L., A. Driscoll, and A. N. Hunt. 2015. “What’s in a Name: Exposing Gender Bias in Student Ratings of Teaching.” Innovative Higher Education 40 (4): 291–303. https://doi.org/10.1007/s10755-014-9313-4
- Marsh, H. W. 2007. “Students’ Evaluations of University Teaching: A Multidimensional Perspective.” In The Scholarship of Teaching and Learning in Higher Education: An Evidence-Based Perspective, edited by R. P. Perry, and J. C. Smart, 319–384. New York: Springer.
- Medina, M. S., W. T. Smith, S. Kolluru, E. A. Sheaffer, and M. DiVall. 2019. “A Review of Strategies for Designing, Administering, and Using Student Ratings of Instruction.” American Journal of Pharmaceutical Education 83(5): 753–764. https://doi.org/10.5688/ajpe7177.
- Millea, M., R. Wills, A. Elder, and D. Molina. 2018. “What Matters in College Student Success? Determinants of College Retention and Graduation Rates.” Education 138 (4): 309–322.
- Nargundkar, S., and M. Shrinkhande. 2014. “Norming of Student Evaluations of Instruction: Impact of Noninstructional Factors.” Decision Sciences Journal of Innovative Education 12 (1): 55–72. https://doi.org/10.1111/dsji.12023
- Nasser, F., and K. A. Hagtvet. 2006. “Multilevel Analysis of the Effects of Student and Instructor/Course Characteristics on Student Ratings.” Research in Higher Education 47 (5): 559–590. https://doi.org/10.1007/s11162-005-9007-y
- Neumann, R. 2001. “Disciplinary Differences and University Teaching.” Studies in Higher Education 26 (2): 135–146. https://doi.org/10.1080/03075070120052071
- Ory, J. C. 2001. “Faculty Thoughts and Concerns About Student Ratings.” New Directions for Teaching and Learning 87: 3–15. https://doi.org/10.1002/tl.23
- R Core Team. 2019. R: A Language and Environment for Statistical Computing. Vienna, Austria: R Foundation for Statistical Computing. URL https://www.R-project.org/.
- Reeping, D., D. B. Knight, J. R. Grohs, and S. W. Case. 2019. “Visualization and Analysis of Student Enrollment Patterns in Foundational Engineering Courses.” International Journal of Engineering Education 35(1A): 142–155.
- Richardson, J. T. E. 2005. “Instruments for Obtaining Student Feedback: A Review of the Literature.” Assessment & Evaluation in Higher Education 30 (4): 387–415. https://doi.org/10.1080/02602930500099193.
- Shulman, L. 2005. “Signature Pedagogies in the Profession.” Daedalus. Summer.
- Smith, B. P. 2009. “Student Ratings of Teaching Effectiveness for Faculty Groups Based on Race and Gender.” Education 129(4): 615–624.
- Sprague, J., and K. Massoni. 2005. “Student Evaluations and Gendered Expectations: What we Can’t Count Can Hurt us.” Sex Roles 53: 779–793. https://doi.org/10.1007/s11199-005-8292-4
- Strumm, B. 2019. Student Ratings of Instruction: A Summary of the Literature. USRI Working Group, University of Calgary. https://www.ucalgary.ca/provost/sites/default/files/teams/2/LiteratureSummaryMay22201
- Uttl, B., C. A. White, and D. W. Gonzalez. 2017. “Meta-analysis of Faculty's Teaching Effectiveness: Student Evaluation of Teaching Ratings and Student Learning are not Related.” Studies in Educational Evaluation 54: 22–42. .9.pdf. https://doi.org/10.1016/j.stueduc.2016.08.007.
- Wright, R. E. 2006. “A Comparative Analysis of Different Models Explaining the Relationship Between Instructor Ratings and Expected Student Grades.” Educational Research Quarterly 30 (2): 3–19.
- Young, S., and H. Duncan. 2014. “Online and Face-to-Face Teaching: How do Student Ratings Differ?” Journal of Online Learning and Teaching 10 (1): 70–79.