
 ?Mathematical formulae have been encoded as MathML and are displayed in this HTML version using MathJax in order to improve their display. Uncheck the box to turn MathJax off. This feature requires Javascript. Click on a formula to zoom.
Abstract
Forecasting major political conflicts is a long-time interest in conflict research. However, the literature thus far has focused almost exclusively on armed conflicts such as civil wars. Attempts to forecast primarily unarmed conflicts have yet to identify a model able to forecast such uprisings with a high degree of accuracy. This thorny forecasting problem may in part be due to the literature’s heavy focus on parametric forecasting methods and relatively rare testing and comparison of a wide range of forecasting algorithms. This paper addresses these gaps in the literature by developing the first unified forecasting model of both major armed and unarmed conflicts at the country-year level based on extensive training, cross-validation, and comparison of eight machine learning algorithms and five forecasting ensembles. We draw on two types of data: slow-moving structural factors such as geography and levels of economic development and short-term political dynamics captured by events data trends, to inform our forecasting models. This approach significantly improves predictive power for both armed and unarmed conflict in comparison to commonly used methods in the literature and suggests that there is significant room for improving forecasts of major political conflicts. However, our algorithms still forecast armed conflict significantly better than unarmed conflict, suggesting the need for continued theory development to inform future forecasting efforts in this area.
El poder predecir los grandes conflictos políticos es un tema que interesa desde hace tiempo dentro del campo de la investigación de conflictos. Sin embargo, hasta ahora, la literatura especializada se ha centrado casi exclusivamente en los conflictos armados, como, por ejemplo, las guerras civiles. Los intentos de predecir conflictos, principalmente no armados, aún no han podido identificar un modelo capaz de pronosticar estos levantamientos con un alto grado de precisión. Este azaroso problema para realizar predicciones puede deberse, en parte, a que la literatura se centra mucho en los métodos predictivos paramétricos y a que las pruebas y comparaciones de una amplia gama de algoritmos de predicción son relativamente escasas. Este artículo aborda estas lagunas en la literatura desarrollando el primer modelo unificado de predicción, tanto de los grandes conflictos armados como de los no armados a nivel de país-año, basado en formación intensiva, validación cruzada y en la comparación de ocho algoritmos de aprendizaje automático y cinco conjuntos predictivos. Recurrimos a dos tipos de datos: factores estructurales de evolución lenta, como la geografía y los niveles de desarrollo económico, así como la dinámica política a corto plazo plasmada en las tendencias registradas en los datos de los acontecimientos, para fundamentar nuestros modelos de predicción. Este enfoque mejora significativamente el poder de predicción, tanto para los conflictos armados como para los no armados, en comparación con los métodos que se usan habitualmente en la literatura y sugiere que hay un margen significativo para mejorar las predicciones de los grandes conflictos políticos. Sin embargo, nuestros algoritmos siguen prediciendo mucho mejor los conflictos armados que los no armados, lo que sugiere la necesidad de seguir desarrollando la teoría para fundamentar los futuros esfuerzos de predicción en este ámbito.
L’anticipation de conflits politiques majeurs est un objet de recherche déjà ancien. Toutefois, à ce jour, la littérature spécialisée existante est presque exclusivement focalisée sur les conflits armés, tels que les guerres civiles. Les efforts de prédiction portant sur des conflits principalement non armés requièrent donc l’identification d’un modèle capable de prévoir les soulèvements, et ce avec un haut degré de précision. Cet épineux problème de prévision est probablement partiellement dû à une littérature fortement axée sur des méthodes de prévision de type paramétrique, laissant peu de place au test et à la comparaison d’un vaste éventail d’algorithmes prédictifs. Cet article a vocation à combler cette lacune en développant le premier modèle prédictif unifié pour des conflits majeurs armés comme non armés, par pays et par année. Ce type de modèle s’appuie sur un entraînement approfondi, une validation croisée et une comparaison portant sur huit algorithmes d’apprentissage automatique et cinq ensembles prédictifs. Pour informer nos modèles, nous nous appuyons sur deux types de données : des facteurs structurels à évolution lente, tels que la géographie ou le niveau de développement économique, d’une part, et sur des dynamiques politiques à court terme, illustrées par des données sur les tendances événementielles, d’autre part. Cette approche permet d’améliorer de manière significative les capacités de prédiction pour les conflits armés comme non armés, par rapport aux méthodes habituellement utilisées dans la littérature, et suggère que la prévision des conflits politiques majeurs peut encore être considérablement optimisée. Toutefois, nos algorithmes restent nettement plus performants pour la prévision des conflits armés que pour les conflits non armés ; un constat reflétant la nécessité de poursuivre ce travail théorique, de manière à mieux informer les futurs efforts de prévision dans ce domaine.
The 2011 “Arab Spring” uprisings have become a stereotypical example of several important phenomena, and of interest to scholars of protest, democratization, civil war, and others. However, perhaps the most defining feature of these uprisings was their unpredictability. It has become an almost stylized fact that these uprisings were not anticipated by either those within the countries in which they occurred or experts observing them from outside.
Some argue that these kinds of events are by nature inescapably unpredictable. Kuran (Citation1991), for example, argues that revolutions cannot be predicted because they rely on the expression of falsified preferences and knowledge of the distribution of these preferences, which is impossible to achieve. Taleb and Blyth (Citation2011) describe the Arab Spring uprisings as “Black Swan” events whose nature belies not just the practical but even the conceptual possibility of prediction. Bowlsby et al. (Citation2020, 1405) also claim, since “the drivers of instability are not constant over time,” forecasting the future of political conflict is possibly insurmountable.
Are these scholars correct? A growing literature on forecasting violent conflict suggests that they may not be (Hegre et al. Citation2017).Footnote1 While the rarity of large-scale violent conflicts makes them difficult to forecast, scholars have developed increasingly sophisticated and reliable means of anticipating their occurrence and onset.Footnote2 Various studies have used structural variables (Fearon and Laitin Citation2003), institutional variables (Goldstone et al. Citation2010), and others. For example, Ward et al. (Citation2013) use hierarchical logistic regression combining events data and structural characteristics of countries to build a model that predicts civil war at the country-month level with a high degree of accuracy. Scholars have leveraged advances in computing power, data mining, artificial intelligence, and textual analysis to predict the onset of several conflict-related events (Chadefaux Citation2014; Mueller and Rauh Citation2018) and moved closer to forecasting conflict in real time (Hegre et al. Citation2019).
In this paper, we identify and address three gaps in this exciting and growing literature. First, conflict forecasting to date has focused almost exclusively on the onset of violent conflict. However, a growing literature has recognized that nonviolent conflict, that is to say, conflicts fought primarily by unarmed civilians using tools such as protests, sit-ins, and strikes, can have political effects just as if not more significant than violent conflict. Major nonviolent resistance campaigns achieve their goals more than twice as often as violent resistance campaigns (Chenoweth and Stephan Citation2011) and lead to democratization much more frequently (Bayer, Bethke, and Lambach Citation2016; Bethke and Pinckney Citation2021; Celestino and Gleditsch Citation2013; Karatnycky and Ackerman Citation2005). Primarily unarmed conflict is thus a critically important alternative to armed conflict. Leaving it out of models that seek to forecast “conflict” or “instability” misses much of the dynamics of contentious politics. Also, there are important differences in the precipitants of nonviolent and violent conflicts (Chenoweth and Lewis Citation2013) that should be counted in building a predictive model of contentious politics.
Scholars have identified several predictors of nonviolent resistance campaigns such as an economy with a high proportion of manufacturing (Butcher and Svensson Citation2016), high levels of globalization (Karakaya Citation2018), and transnational diffusion (Braithwaite, Braithwaite, and Kucik Citation2015; Gleditsch and Rivera Citation2017). Nevertheless, while several statistically significant predictors have been identified, their predictive power remains limited (Chenoweth and Ulfelder Citation2017).
Second, a long tradition in contentious politics has argued that scholars can gain insight from integrating different types of political contention into a single analytical framework (Gurr Citation1970; McAdam, Tarrow, and Tilly Citation2003). Civil war, terrorism, and nonviolent resistance are not entirely distinct phenomena but rather analogous and even in some cases interchangeable methods of achieving political goals. Their occurrence and non-occurrence are not empirically independent. Thus, models that seek only to forecast one and combine all others in a common category of “no events” have significant limitations.
Third, most models in the conflict literature rely on parametric models such as logistic regression. While these models are suitable for drawing causal inferences from null hypothesis significance testing (NHST), they have less ability to accurately forecast complex events, where the relationships between predictors and outcomes are unlikely to follow the assumed parametric relationships. If a researcher is primarily interested in forecasting, there are numerous other algorithms—typically described under the general category of machine learning—specifically designed for this purpose. However, these algorithms have only infrequently and inconsistently been applied to conflict forecasting and, when applied, have typically not been used to their full potential. Training, testing, and comparing a wide range of machine learning algorithms may provide greater forecasting power for both the well-studied forecasting problem of armed conflict and the less well-studied problem of unarmed conflict.
We address these gaps by building a set of models to reliably predict peace, unarmed conflict, and armed conflict. Our modeling strategy incorporates a broad collection of prediction techniques, including traditional regression, machine learning algorithms, and their ensemble. We build on cutting-edge insights from the literature on armed and unarmed conflict. Our models generate annual predictions of both civil war and unarmed conflicts with high out-of-sample predictive accuracy. The best models without including the lag of outcome variablesFootnote3 have out of sample areas under the receiver operating curve (AUC-ROC) of 97.8% for armed conflict, 82.9% for unarmed conflict, and 92.1% for a combined category of both, predictive accuracy that exceeds previous forecasting models of unarmed conflicts and exceeds or is comparable to the state of the art forecasting models of civil war.
The paper proceeds as follows. First, we describe the state of the literature on conflict forecasting, particularly the less-developed literature on forecasting unarmed conflict. Next, we generate a theoretical framework for forecasting major armed and unarmed conflicts, drawing on the insights from this literature. We then present our research design, including the operationalization of our independent variables, dependent variables, and forecasting algorithms. Finally, we discuss the results of the forecasting exercise across different models and algorithms, and then unpack these results by discussing how well or poorly our best forecasting algorithm-model predicted Arab Spring events in 2011. We also examine which variables contribute the most to forecasting accuracy. We conclude by discussing the implications of our findings for the conflict forecasting literature.
Forecasting Contention
While forecasting has only entered the mainstream in the peace and conflict literature in recent years, scholars have long been concerned with predicting conflict (Singer and Wallace Citation1979). From the beginning, scholars of conflict have looked at political contention as not something that scholars should be able to explain ex-post, but something that with the appropriate data and modeling strategy, we should be able to predict ex-ante. Schrodt (Citation2014) goes so far as to deride models with little or no predictive power as “pre-scientific.”
Despite this, very little of the literature on conflict or contentious politics has focused on forecasting. Instead, the scholarly gold standard has been NHST, in which the central focus is on whether the preferred explanatory variable reaches standard thresholds of statistical significance in a traditional parametric model such as ordinary least squares (OLS) or logistic regression. Most seminal studies of conflict do not incorporate any form of out-of-sample testing (see, e.g., Collier and Hoeffler Citation2004), and some do not even include measures of model fit (see, e.g., Fearon and Laitin Citation2003). The NHST approach has significantly advanced our knowledge of conflict. Building a theoretically informed forecasting model would be impossible without a pre-existing list of well-understood conflict correlates. However, this methodological focus has also come with high costs. For instance, Ward, Greenhill, and Bakke (Citation2010) point out that focusing on NHST has driven conflict researchers to focus on increasingly marginal predictors of conflict.Footnote4
The limitations of the NHST approach have motivated a recent renaissance in predictive modeling in the conflict literature, with recent contributions looking at both civil war and broader political instability. Goldsmith et al. (Citation2013) forecast incidents of genocide and politicide using a two-stage probit model building on arguments in the literature. Goldstone et al. (Citation2010) build a model of political instability relying primarily on institutional variables. Similarly, Ward and Beger (Citation2017) have developed a model, updated monthly, that predicts irregular leadership changes 6 months in the future with a high degree of accuracy.
Multiple approaches have been used to predict the onset of civil war specifically. Hegre et al. (Citation2013) use annual level data and simulations to predict the incidence of civil war from 2015 to 2050. Ward et al. (Citation2013) use hierarchical models with random intercepts and a combination of structural factors and event data to predict the onset of conflict at a monthly level. Mueller and Rauh (Citation2018) use annual aggregates of the topics discussed in media sources on a particular country to predict the onset of civil war in the following year.
Earlier forecasting approaches tended to incorporate simple linear or generalized linear regression modeling based on highly aggregated data. However, recently conflict researchers have increasingly employed more complex modeling strategies, big data resources, and machine learning algorithms to classify and predict armed conflict. For instance, the ViEWS project from the Peace Research Institute of Oslo and Uppsala University produces monthly conflict forecasts for multiple types of armed conflict disaggregated at spatial levels as granular as the half-degree grid cell and built using an ensemble of modeling methods (Hegre et al. Citation2019).
These attempts to predict civil war and other forms of political violence have critically advanced the literature. However, they are limited in one important way: nearly all conflict forecasting studies subsume other methods of political struggle beyond armed conflict into the same residual category as no political struggle whatsoever. This limits their ability to give us a full picture of the conditions for political instability.
A longstanding literature has recognized that disadvantaged groups employ forms of political contention other than large-scale political violence (McAdam, Tarrow, and Tilly Citation2003). In particular, the literature on nonviolent resistance has shown that nonviolent action often functions as an alternative “weapons system” through which challengers wage major political struggles (Sharp Citation1973). Nonviolent resistance movements also have major long-term political consequences. Since nonviolent movements for regime change succeed at a much higher rate than violent movements seeking regime change, the occurrence of a nonviolent resistance movement is a much more reliable predictor of major political transformation than a civil war (Celestino and Gleditsch Citation2013; Chenoweth and Stephan Citation2011; Pinckney Citation2020).
Thus, a country amid a nonviolent resistance movement and one in which no contention is occurring are very different categories. To combine them obscures both causal dynamics and our understanding of the consequences of contention. Much can be gained from forecasting armed conflicts, but models that exclude major unarmed conflicts are truncating an important portion of the contentious spectrum.
There is little quantitative literature on major nonviolent resistance movements at a global scale prior to Chenoweth and Stephan (Citation2011). Since then, there has been significant research into their causes and consequences. For example, Butcher and Svensson (Citation2016) find that nonviolent resistance onset is robustly predicted by the share of a country’s economy made up of manufacturing. Suveyda Karakaya (Citation2018) finds that countries with higher levels of globalization are more likely to experience nonviolent resistance movements, and Ches Thurber (Citation2018) finds that ethnic fragmentation makes nonviolent resistance movements less likely. Yet, the existing work almost exclusively relies on NHST.
The only systematic effort to build a predictive model of unarmed conflicts that we are aware of is Chenoweth and Ulfelder (Citation2017). Chenoweth and Ulfelder construct four models based on insights from the social movements and nonviolent resistance literatures and measure their areas under the receiver operating characteristic curve (AUC-ROC). They also measure the contributions to the AUC-ROC from individual variables. They find in general that a model building on a political opportunity approach performs better than the alternatives in having a relatively high AUC-ROC, but that all four models, as well as a “culled” model created by selecting the variables from the four models that contribute the most to the AUC-ROC, perform poorly.
Chenoweth and Ulfelder’s article is a foundational advance in our understanding of the predictors of nonviolent resistance. We build on it in four ways. First, in addition to including armed conflict as a predictor in forecasting nonviolent conflict (as Chenoweth and Ulfelder do) we also construct models that forecast the occurrence of a combined category of both armed and unarmed conflict. Second, while Chenoweth and Ulfelder use the AUC-ROC as their primary means of evaluating model performance, we incorporate metrics for evaluating predictive models tailored to the challenge of predicting relatively rare events, specifically focusing on Precision-Recall curves. Third, we incorporate variables meant to capture more complex shorter-term political precipitants of major conflict (discussed in more detail below).
Fourth, we incorporate a more comprehensive procedure of tuning, cross-validating, and comparing a wide range of machine learning algorithms, including tree algorithms and neural nets. While many of these methods have begun to be used in forecasting armed conflict, they are used infrequently, and only rarely are a wide number of algorithms compared to one another. Doing so, as we lay out below, allows us to examine whether the relatively smaller predictive power of quantitative models in forecasting nonviolent conflict is due to not using more recent prediction algorithms or the theoretical limitations of this literature in explaining nonviolent conflicts. It also gives us greater leverage into the more well-established problem of forecasting violent conflicts.
There are no studies that we are aware of that build predictive models of both armed and unarmed conflicts simultaneously, while incorporating the most recent advances in forecasting methodology that have been recently adopted by the literature on forecasting civil war. Given the inter-connection of these forms of conflict and their importance for long-term political outcomes, such a model will be a significant advance in our understanding of conflict.
Periods of Contention
In this section, we describe the theoretical motivation and underlying structure of our forecasting model. What we are interested in forecasting are periods of significant political conflict. We define these periods through the following criteria: First, contention must be outside of institutional avenues of politics. Second, it must constitute a major political challenge to the incumbent regime. Third, it must articulate goals that fundamentally threaten the political status quo.
The first criterion means that we are interested in political conflicts that are non-routine. Violent political actions such as terrorist attacks and civil war always fall into this category. However, building on the insights of the nonviolent resistance literature (Chenoweth and Stephan Citation2011; Schock Citation2005; Sharp Citation1973), we recognize that primarily nonviolent actions such as strikes, boycotts, and protests, often fall into it as well. The degree to which specific tactics will fall into the “non-routine” category will vary depending on context. For instance, political protest is a routine method of political action in advanced democracies but a very non-routine form of political action in most autocracies.
The second criterion means that we are concerned with conflicts that reach a level of intensity such that they could plausibly threaten current political institutions. There are methodological, theoretical, and practical reasons for adopting this standard. Methodologically, outside observers are more likely to record large incidents of political contention in consistent ways, reducing observation bias. Smaller episodes, such as scattered protests or individual attacks with few casualties, are much more likely to be observed for idiosyncratic reasons and more likely to be observed in countries with well-developed media sectors, introducing non-systematic sources of bias in any attempt to build a predictive model of their occurrence (Weidmann Citation2016). Theoretically, the predictors of minor episodes of contention and major episodes of contention are unlikely to be the same. Practically, aggregating more minor types of conflict into our dependent variable would confound our ability to predict major conflict periods. We discuss our specific operationalization of this criterion in the research design section below.
Even if the intensity of conflict is such that a threat to the current political order is possible, this threat is unlikely to be realized unless the major players behind the conflict also articulate goals that would reshape the political system. Thus, our third criterion limits our focus to those conflicts that are most likely to have major consequences for political stability. The literature typically refers to these conflicts as “maximalist” (Chenoweth and Stephan Citation2011). We include all maximalist episodes where the articulated claims, if granted, would result in fundamental changes to regime structure or personnel (Braithwaite et al. Citation2022).
Maximalist movements frequently do not start with maximalist goals. For instance, the Arab Spring in Tunisia started as an anti-corruption movement (Lynch Citation2013). We consider conflict periods characterized by non-maximalist goals to be distinct from maximalist conflicts and treat them as predictors of maximalist conflicts, rather than falling into the same category. We consider the transition from non-maximalist to maximalist conflicts to have occurred when the major players in the movement have begun to articulate maximalist goals.
Conflict periods are often but not necessarily planned. Often the major actors involved in a significant conflict period are themselves surprised by the events their actions initiate. For instance, the Arab Spring protests in Egypt were initially planned only as a protest against police brutality, and leaders of the protests, such as Google engineer Wael Ghonim, were caught off-guard by the level of response they received (Ghonim Citation2012).
As discussed in the prior section, we divide conflicts into two primary categories: armed and unarmed conflict. We follow existing definitions in the conflict literature in defining these categories. The most well-accepted definition of armed conflict in the literature comes from the Uppsala Conflict Data Program, which defines an armed conflict as a: “contested incompatibility that concerns government and/or territory where the use of armed force between two parties, of which at least one is the government of a state, results in at least 25 battle-related deaths in one calendar year.”Footnote5
Unarmed conflicts are a newer category. We consider unarmed conflicts to be all those periods of conflict where the most common tactics used by challenging groups are performed by unarmed civilians and do not primarily rely on physical violence or the threat of physical violence. Unarmed conflicts as a category are closely analogous to cognate terms such as nonviolent action or civil resistance, and the majority of their mechanisms for mobilization and success have been articulated in literature that relies on these terms (Chenoweth and Cunningham Citation2013). We prefer the term unarmed conflicts for a few reasons: first, to highlight that some of these conflicts do not involve the degree of organization implied by the term “campaigns of nonviolent action,” and also to clarify that the conflicts we are discussing often involve significant incidents of violence (Kadivar and Ketchley Citation2018; RezaeeDaryakenari Citation2021). This violence is typically peripheral and may even be detrimental to the uprisings’ success (Abbs and Gleditsch Citation2021; Chenoweth and Schock Citation2015; Pinckney Citation2016), but nevertheless must be considered.
Armed and unarmed conflicts share a focus on undermining current systems of political authority. They are both forms of contentious politics, and thus we expect them to have certain common predictors. In addition, they are likely to have many common consequences. Both armed and unarmed conflict, for instance, tend to greatly increase the likelihood of regime breakdown. However, the growing literature on unarmed conflicts increasingly recognizes that these two phenomena have distinct predictors. Chenoweth and Lewis (Citation2013) and Cunningham (Citation2013) argue that predictors of civil war do a poor job in explaining the onset of nonviolent action.
This suggests that unarmed conflicts are not merely a “step along the way” to armed conflict, but rather a distinct form of political contention. To this end, our task in this paper is to construct a model that can forecast both conflicts overall and also distinguish between these two primary forms of conflict.
We assume that major periods of conflict, both civil war and unarmed conflicts, come about through a complex, interactive chain of events. Political challengers exercise some degree of agency in initiating these events, but they are also constrained in their choices by social, economic, and political factors in their context. We describe these constraints as the structural risk factors of conflict. Most of these factors can change, but when they do, the pace of change is typically slow. For instance, as the prior conflict literature argues (Collier and Hoeffler Citation2004), lower levels of economic development are likely a risk factor for both armed and unarmed conflict. Much of the past literature on explaining the causes of conflict focuses on these factors. However, on their own, they do little to help us in forecasting conflict because of the rarity of both major periods of conflict and dramatic changes in most structural factors.
Thus, in addition to looking at structural risk factors, we must examine the medium-term political precipitants of conflict. These are patterns of political behavior that regularly and consistently escalate an underlying base level of conflict risk. For instance, ethnic heterogeneity on its own has been argued to be a poor predictor of civil war (Fearon and Laitin Citation2003). But ethnic outbidding cycles in which leaders engage in increasing levels of violence, in connection with an underlying ethnic distinction, may be good predictors of conflict (Lake and Rothchild Citation1996). Economic inequality on its own is a poor predictor of the onset of an unarmed conflict. But if economic inequality triggers labor protests against rising prices, then this can lead to an increased risk of a significant conflict.
Third, there are triggering actions in which these precipitants move from increasing the risk to initiating the period of contention. Whereas political precipitants tend to be similar across different conflict environments, triggering actions are typically specific to one conflict situation. There are a few archetypal examples of these triggering actions. For instance, the assassination of Archduke Franz Ferdinand was the triggering action for World War I. The self-immolation of Mohammed Bouazizi was the triggering action for the Arab Spring uprising in Tunisia and thus indirectly for the series of Arab Spring uprisings around the Middle East (and beyond).
Out of these three, the simplest to observe are structural risk factors. The conflict research scholarship has generated an extensive list of these. Political precipitants are also becoming easier to incorporate into forecasting models since these are typically regular patterns of lower-level political events. Triggering actions are difficult, if not impossible, to observe consistently cross-nationally since they are highly contingent on contexts. Thus, the perfect prediction of major contentious periods is likely to remain elusive. However, as our incorporation of political precipitants becomes more sophisticated, this difficulty should become less consequential. Triggering actions are only likely to shock a country into a major contentious period when a long pattern of political precipitants has brought the political system to a critical point.
Designing a Statistical Learning Model of Conflict Prediction
We build our forecasting model using a country-year unit of analysis, following much of the existing literature on conflict forecasting (Chenoweth and Ulfelder Citation2017; Goldstone et al. Citation2010). Our sample is all country-years from 1995 until 2013.Footnote6 Temporal aggregation to an annual level comes with some analytical downsides. For instance, it limits our ability to capture shorter-term political precipitants. However, it allows us to more directly compare our findings with the existing literature and gives a hard test to the proposition that conflict can be reliably forecast since we are limiting our ability to capture short-term dynamics. Furthermore, the predictive algorithms that we use are computationally intensive, sometimes requiring hours or even days to fully cross-validate using commonly available computational resources.Footnote7 Temporally disaggregating the data would increase the required computational resources by at least an order of magnitude.
Forecasting Targets
Our data on contentious periods come from the Nonviolent and Violent Campaigns and Outcomes (NAVCO) data project, version 2.1 (Chenoweth and Shay Citation2020). NAVCO 2.1 contains annual data on violent and nonviolent resistance campaigns globally from 1945 to 2013 in 141 countries. To be included in the data, a campaign must have at least 1,000 participants, publicly stated maximalist goals, and persist for at least a week. These data thus provide an ideal dataset from which to examine significant armed and unarmed conflicts, as we have defined them above. We draw three outcome variables from NAVCO 2.1 to predict at time using the available data at time
unarmed conflicts, armed conflicts, and any conflict. We code the first and second outcomes respectively as a one when NAVCO 2.1 observes a nonviolent or violent resistance campaign respectively, and otherwise zero. We code the third outcome variable—conflict—as a one whenever a country experiences either a nonviolent or violent campaign, and zero otherwise.
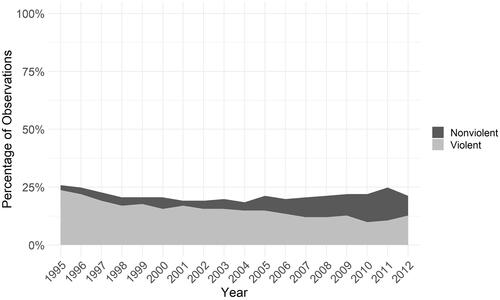
All three outcomes in these data are uncommon. Violent campaigns occur in 15.4% of observations. Nonviolent campaigns are rarer, only occurring in 6% of observations. While a few country-years in the full NAVCO 2.1 data set have concurrent violent and nonviolent campaigns, in our final sample, there are no years with both types of campaign, due to our limitation to more recent country-years and dropping some observations due to missing data. shows the change in this percentage of observations with either a nonviolent or violent campaign by year. The percentage of observations with violent campaigns has declined slightly over this period, while the percentage of observations with nonviolent campaigns has increased. Thus, the total number of observations in conflict (either armed or unarmed) has stayed relatively constant.
Figure 1. Trends in nonviolent and violent conflict over observation period.
Predictors
We estimate models using three different sets of predictors for each of the above outcomes. First, we estimate a model using only structural variables as predictors: population, real GDP per capita, inflation, democracy, ethnic fractionalization, religious fractionalization, and human rights conditions.Footnote8 Population and economic variables come from the Penn World Tables, version 9. We also used the data from Composition of Religious and Ethnic Groups Project to calculate Ethnic and Religious ethnolinguistic fractionalization (ELF).Footnote9 Our measure of democracy is the Polyarchy score from the Varieties of Democracy project (Coppedge et al. Citation2019). We use the human rights protection scores from Fariss (Citation2014, Citation2019) as a proxy for human rights conditions.
Second, we estimate a model including all the above structural variables as well as a list of political precipitant variables extracted from the Integrated Crisis Early Warning System (ICEWS) data set (Boschee et al. Citation2015). ICEWS is a data set of automatically coded conflict events data. Events are generated by an events data pipeline that scrapes a massive number of online media sources and converts the information from these sources into events following the CAMEO event coding framework (Schrodt et al. Citation2005) of a specified actor performing a verb toward a target. We select a wide range of ICEWS verbs and generate country-year counts of their occurrence. Table A1 in the online appendix lists the precipitant variables included in our analysis and provides summary statistics on all variables included in the models.Footnote10
Table 1. Forecasting model summary.
Third, we estimate a model using the structural variables and the lag of armed and unarmed conflict variables. This allows us to explore whether and how much adding information on the status of the conflict in the previous period to structural variables as predictors improves the predictive power of the estimated models. Also, since the lag of conflict outcomes are among the best predictors of conflict, and they significantly improve the predictive power of the model, these lagged models allow exploring whether our method of cross-validation and using machine learning algorithms can help improve the predictive power of conflict models without including their lags. This last group of lagged models gives us a benchmark to investigate how much the predictive power of our suggested models can get close to the models with lagged variables, as the models with commonly accepted best predictive power.
As described above, we depart from most quantitative models of conflict by not focusing on the statistical significance of specific variables. Our primary concern is to estimate a model that has the best possible overall predictive power. In particular, we are interested in creating a model that has the highest possible out-of-sample predictive accuracy. Evaluating the predictive power of a statistical model using the same sample on which we estimate its parameters is problematic. Therefore, we split our sample into training and test data sets and use cross-validation to ensure that we have achieved the lowest possible combination of bias and variance in training our statistical algorithms (Hastie, Tibshirani, and Friedman Citation2009). summarizes the steps we take to train our statistical algorithms and then test their out-of-sample forecasting power. We repeat this process for each set of predictors (structure, structure and process, and structure and lagged conflict outcomes) and each contentious outcome (armed conflict, unarmed conflict, and conflict), for a total of nine repetitions for each algorithm.
Figure 2. Steps to train algorithms and evaluate their out-of-sample predictive power.
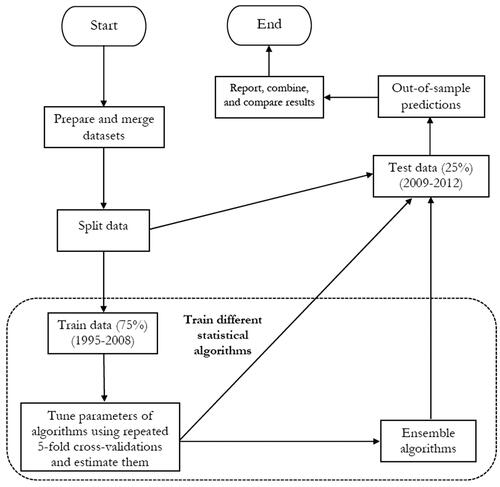
We first split the sample () into a training sample and a test sample. The training sample includes the observations from 1995 to 2008, roughly 75% of the data. The test sample includes observations from 2009 to 2012. Machine learning algorithms often have tuning parameters that control their complexity and fit to the training sample. The more complex a trained algorithm, the lower its bias, but the higher the variance of its predictions. Trained algorithms with less complexity have a smaller prediction variance, but their prediction bias is usually larger. In other words, while simple trained models suffer from under-fitting the train sample, complex trained models over-fit the train sample. Both under-fitting and over-fitting lead to large out-of-sample prediction errors (Hastie, Tibshirani, and Friedman 2013). Therefore, we employ cross-validation to choose the parameters of a trained model that reach the optimal level of complexity and minimize out-of-sample prediction errors.
We employ five-fold cross-validation to train all our prediction algorithms using the 1995 to 2008 training sample. Generally, k-fold cross-validation divides a sample randomly to evenly sized random groups. The first group is put aside, and the model is estimated using the data in the other k − 1 groups. Then, the estimated parameters are used for predicting the outcome in the set-aside group and calculating prediction error. This is repeated for all the remaining k−1 groups until we get a prediction error for each observation in the training data. To ensure that random grouping is not affected by outliers, we repeat the five-fold cross-validation 30 times in the training sample and then average the errors across these trials. In the last step, we use this trained model to predict outcomes in the test sample (data from 2009 to 2012) and calculate the out-of-sample prediction error.
There are a growing number of possible forecasting algorithms, from simple ordinary least squares regression to non-linear models such as logistic regression to non-parametric models such as k-Nearest Neighbors (KNN) and Random Forests. We ignore traditional OLS models due to the binary nature of our dependent variables. Instead, we use logistic regression as a parametric model that is used virtually by all forecasting studies in the conflict literature. We also explore the predictive power of three regularized logistic regression models: Ridge, Lasso, and Elastic Net regression, which shrink or remove coefficients for predictors with low explanatory power to maximize predictive accuracy. In addition to these parametric models, we estimate four non-parametric models: KNN, Random Forest, a Gradient Boosting Machine (GBM), and a single-layer Neural Network. This set of algorithms is by no means comprehensive but represents a broad selection of the most widely used algorithms in the statistical learning field.Footnote11 To our knowledge, our study compares the largest number of predictive algorithms in the conflict forecasting literature.
All these prediction algorithms, except for simple logistic regression, require tuning of key parameters (such as the parameter in a Ridge regression or the number of neighbors in a KNN set-up) to maximize their accuracy. To tune these parameters, we conduct the full 30 times repeated five-fold cross-validation with the parameters set at a comprehensive sequence of reasonable combinations and select the parameters that maximize the area under the precision-recall curve (AUC-PR), a measure of classification accuracy particularly well-suited to evaluating a model’s performance in classifying rare events.Footnote12 Table A2 in the online appendix summarizes the parameters that we tune for each algorithm.
Table 2. Conflict predicted probability in the MENA region in 2011.a
In conflict forecasting, area under the receiver operating curve (ROC) plots, as well as the numeric area under the ROC curve (AUC or AUC-ROC) are the most common evaluation methods (D’Orazio Citation2020). However, ROC plots come with some disadvantages. The ROC plots the model’s false positive rate against its true positive rate across different categorization thresholds. Since significant contentious periods, both armed and unarmed, are rare events, the distributions of both outcomes and their combination are skewed. Any sample of country-years will have a high proportion of true zeros—that is lack of major conflict—and a relatively small proportion of true ones: major conflict periods. A model that simply forecasts no conflict in all observations will thus achieve a high AUC-ROC but does not get at when this rare observation is likely to occur. Thus, while we report AUC-ROC scores for comparison with existing studies, we use the AUC-PR to tune our prediction algorithms and use it as our primary means of evaluating models’ classification performance.Footnote13
Finally, we also use five different ensembles of the above eight prediction algorithms to combine their power to forecast contentious outcomes. An ensemble method combines the predicted probabilities from each individual algorithm by taking their average. Using ensemble algorithms allows us to explore the possibility of achieving a better out-of-sample prediction by combining the outcome of algorithms. We first use a simple unweighted average of predictions from our eight trained algorithms. In addition, as Montgomery, Hollenbach, and Ward (Citation2012) suggest, we use a weighted average of component forecasts to achieve the highest possible predictive power and decrease their share in predicting outcomes where they show a larger prediction error. We calculated the ensemble weights using four methods: Ridge, Lasso, Elastic Net, and a simple Bayesian generalized linear model. We applied our repeated five-fold cross-validation, as described above, to tune the parameters and train our Ridge, Lasso, and Elastic Net algorithms in Ensemble models.
summarizes the full set of conflict forecasting models that we incorporate in our training. We run our repeated five-fold cross-validation procedure at each value of the algorithm’s relevant tuning parameters for each combination of algorithms, dependent variables, and independent variables. We thus train statistical algorithms and evaluate the performance of eight separate estimation methods and five ensembles in forecasting three contentious outcomes using three sets of predictors–structural, structural and process, and structural and lags.
Results and Discussion
compares all 13 algorithms across our nine models, plotting the models’ AUC-PR along the x-axis and more commonly used AUC-ROC along the y-axis. The models with the strongest predictive power fall on the top right side of the plots, while those with weaker predictive power are on the bottom left side. Comparing models and algorithms this way reveals several important patterns. First, across all contentious outcomes, the highest out-of-sample forecasting power belongs to the armed conflict, and the lowest out-of-sample forecasting power is for unarmed conflicts. This is consistent with Chenoweth and Ulfelder’s (Citation2017) findings of the low explanatory power of the quantitative models of nonviolent resistance. However, while unarmed conflicts are always more difficult to predict than armed conflicts, our approach generates several outputs that outperform Chenoweth and Ulfelder’s (Citation2017) algorithms and reduce the gap between these two.
Figure 3. Comparing the AUC-PR and AUC-ROC of the prediction algorithms across different models and outcomes.
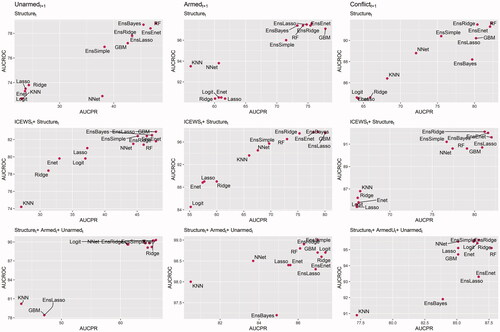
Second, the predictions using logistic regression cluster on the bottom left side of the plot across most model variations when we do not include the lag of armed and unarmed conflict. This means the logit models have the lowest AUC-ROC and AUC-PR among the 13 trained statistical algorithms. Logit predictions only perform relatively well in models that predict any contentious outcome with the lag of both armed and unarmed conflict included. This is a noteworthy finding as most conflict forecasting models in the literature employ logistic regression.Footnote14 In addition, this finding suggests that NHST models of conflict should be cautious that logit models without the lag of outcome variables can be prone to the omitted variable problem, and this needs to be addressed accordingly.
Third, the models with the lag of armed and unarmed conflict variables are among the models with the highest explanatory power. Using lagged outcomes for forecasting, however, causes two major problems. First, the forecasting models that achieve a high level of predictive power using their lags often perform poorly in forecasting conflict onset. Second, one way that studying and improving the predictive power of conflict models can contribute to the scientific research in this area is by identifying the variables which are more important in predicting and explaining the variations in a conflict outcome, so that scholars can study and theorize the mechanisms through which these variables affect conflict. When the lag of the outcome variable is the main contributor in predicting outcomes, this model provides little insight for future research. However, if we achieve a high level of predictive power for conflict models without adding their lags as predictors, then we can focus on the variables contributing more to forecasting conflict outcomes and theorize their association with conflict. Except for the unarmed conflict outcome, the prediction of models without the lag of contentious politics outcomes can be close to the prediction of models with the lagged variables if we use tree-based or Ensemble models. and present the prediction power, measured respectively in AUC-ROC and AUC-PR, across estimated models and applied algorithms. In both plots, the performance of models without lag variables are close to the models with the lag of armed and unarmed conflict variables when we use either decision tree models (RF or GBM) or Ensemble models.
Figure 4. Predictive power measured by AUC-ROC across models (columns) and algorithms (rows).
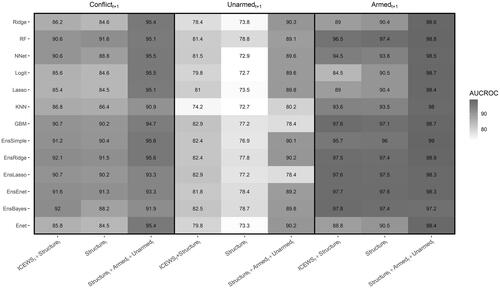
Figure 5. Predictive power measured by AUC precision-recall across models (columns) and algorithms (rows).
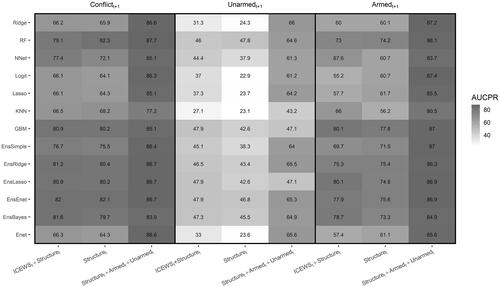
Lastly, the decision tree learning algorithms: random forest and gradient boosting, alongside ensemble algorithms, show the best performance in predicting our three outcomes. These algorithms significantly improve the out-of-sample forecasting power of statistical models in comparison to the previous research. reports the AUC-ROC across models and algorithms. We can clearly see that some algorithms, such as tree and ensemble, using structural and ICEWS process variables as predictors can improve the out-of-sample forecasting of unarmed conflicts by about 7% relative to the logit model used by Chenoweth and Ulfelder’s (Citation2017), whose highest out-of-sample AUC-ROC about 75%. Although using non-parametric statistical models and ensemble prediction algorithms improved the out-of-sample forecasting of unarmed conflicts, armed conflict remains a much easier outcome to forecast. Indeed, our findings across different algorithms indicate that the lower out-of-sample forecasting of unarmed conflicts is not due to relying on more classic estimation approaches such as logit. Instead, the main problem can be the relatively lower explanatory power of the variables commonly used in nonviolent/civil resistance literature.
Discussion: Unpacking the Results
In this section, we unpack the results of our modeling by looking at how well the predicted probabilities produced through the repeated five-fold cross-validation in our training data (1995–2008) map onto the actual occurrence of contention in our test data (2010–2013). We also discuss which of the predictors has the highest importance in forecasting contentious politics.
For simplicity’s sake, we report results here from the algorithm that reports the highest AUC-PR for our most difficult dependent variable—unarmed conflicts—while not relying on the lag of the dependent variable. As shows, this is the GBM model that includes both structural variables and political precipitant variables derived from ICEWS. We first focus on the most remarkable unarmed conflicts during the period covered by our test data: the 2010–2011 “Arab Spring” uprisings, which, as described at the beginning of this paper, have been used as an illustration of the difficulty of predicting unarmed conflicts. How well does our most accurate (overall) algorithm do in predicting the onset of the Arab Spring?
contains the predicted probability of conflict, both unarmed and armed, in 2011 for the 19 countries of the MENA region from the GBM model.Footnote15 The algorithm performs well in identifying any contention. All observations with a greater than 10% predicted probability of conflict experience either violent or nonviolent conflict. When it comes to unarmed conflicts, the most difficult category to predict, the performance is more mixed. The algorithm predicts the revolution in Egypt remarkably well, giving Egypt a 50.7% likelihood of experiencing an unarmed conflict in 2011. The only country that scores higher on the predicted probability of an unarmed conflict is Morocco, which also experienced an “Arab Spring” uprising. The model does not give any of the other countries in the MENA region a high probability of unarmed conflict. Most strikingly, the model gives both Jordan and Bahrain, which had major unarmed conflicts in 2011, infinitesimal chances of experiencing an unarmed conflict.Footnote16
Syria provides a more complex picture. The model gives Syria a probability of an unarmed conflict indistinguishable from zero and about 1% likelihood of civil war. While NAVCO codes the Syrian conflict as primarily nonviolent in 2011 (shifting to violent conflict in 2012) most scholars date the origin of the Syrian civil war as July 2011, with the formation of the Free Syrian Army.
What about the model’s performance in the test sample more broadly? Figures A15, A16, and A17 in the online appendix show separation plots summarizing the model’s performance for each of our three dependent variables. Armed conflict, and conflict in general, are separated well. Unarmed conflicts show a more complex picture, which sheds light on the strengths and weaknesses of the model. The country-year in the test data with the second highest predicted probability of an unarmed conflict according to the GBM model (50.7%) that did not experience one according to NAVCO is Egypt in 2012. While NAVCO does not record an unarmed conflict as taking place this year (it treats 2011 as the end of the Anti-Mubarak movement and 2013 as a single year of an Anti-Morsi movement), major contention did continue through 2012 against the interim regime of Egypt’s Supreme Council of the Armed Forces, which could reasonably be considered if not a full-fledged maximalist civil resistance campaign at least very close to it (Ketchley Citation2017).
The observation that experienced an unarmed conflict with the lowest absolute predicted probability of one is Djibouti in 2011. However, the country that is consistently most poorly predicted by the model is Spain. NAVCO records the ETA campaign for Basque self-determination shifting from primarily violent to primarily nonviolent in 2010 and continuing as an unarmed conflict until the end of the data set in 2013. All four of these country-years are given a very low predicted probability of unarmed conflict.
The GBM model thus appears to do poorly in detecting more subtle shifts in ongoing contentious processes, from maximalist to non-maximalist in Egypt and from primarily violent to primarily nonviolent in Spain. This may be due to the country-year unit of analysis, which necessarily involves losing a great deal of this subtlety, and also to the blunt way in which we have measured political precipitants of conflict, with simple annual counts of conflict-related events from ICEWS. A more fine-grained unit of analysis, or political precipitant variables that were more finely tuned, might do better in predicting these more difficult cases, a matter that we leave for future research.
Looking at the variables with the greatest contribution to the model gives further insight into its strengths and weaknesses. We use Friedman’s (Citation2001)Footnote17 relative importance of input variables procedure to measure the relative influence of variables in a GBM model in , which gives the most influential predictor a value of 100 and measures other predictors relative to it. Ethnic fractionalization, Religious fractionalization, and Population are among the most important variables in both models for predicting violent and nonviolent outcomes.
Figure 6. Variable importance in GBM model.
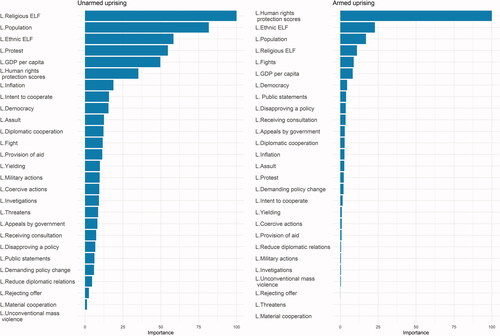
While Chenoweth and Ulfelder have previously identified population as a key predictor of unarmed conflicts, our model shows that some variables not previously examined also appear to be strong predictors of the phenomenon. Religious fractionalization, in particular, is nearly as influential as population in predicting unarmed conflicts. For armed conflicts, the overwhelmingly most influential predictor is Fariss’ (Citation2019) latent human rights protection score. And in both cases, several of the ICEWS count variables are influential predictors, highlighting the importance of moving beyond a purely structural model, particularly for unarmed conflicts.
Conclusion
Our understanding of both violent and nonviolent conflict has grown increasingly rich in recent years, as a wealth of qualitative and quantitative literature has helped point to key predictors of their onset and dynamics. Nevertheless, our ability to perform the basic scientific task of forecasting novel facts remains limited. In this paper, we have built on the conflict forecasting literature to improve our ability to perform this task. We have shown that by correctly accounting for conflict’s ability to take both armed and unarmed forms, incorporating both structural risk factors and short-term political precipitants, and incorporating well-tuned classification algorithms designed for forecasting accuracy, we can forecast major contentious episodes with a high degree of accuracy.
These findings advance the literature in several ways. First, we show that forecasting unarmed conflicts remains significantly more difficult than predicting armed conflicts. Our most effective algorithms for forecasting unarmed conflicts are several points less effective than the most effective algorithms for predicting armed conflicts, measured either using the AUC-ROC or AUC-PR. However, while a significant gap remains between our ability to predict unarmed and armed conflicts, we find that it is possible to significantly improve the prediction of unarmed conflicts over prior efforts. With an appropriate, carefully tuned algorithm and set of predictors, one can forecast these conflicts with a higher degree of accuracy.
Second, we show that it is possible to achieve a high level of performance in predicting conflict outcomes without including the lag of dependent variables. We do it in this paper using more computationally intensive cross-validation as well as employing non-parametric machine learning algorithms, which have not been commonly used previously.
Third, we provide evidence of the significant advantages to be gained from expanding the forecasting toolkit to methods beyond logistic regression and other simple parametric models. Some earlier work has been skeptical of the value-added from more complex machine learning methods. Our findings suggest that when paired with an appropriate level of cross-validation, and when sufficient attention is given to tuning model parameters, machine learning methods, particularly tree-based classification methods such as Random Forests and GBMs, can significantly improve predictive accuracy, providing AUC-PR scores from 12 to 26 points higher than logistic regression models with the same predictors. Several of our ensembles also have some of the strongest predictive power, though interestingly none can consistently outperform the GBM. Exploring the most effective ensemble weighting methods is an important area for future research.
Fourth, our findings show that combining structural factors that affect a country’s base level of risk for conflict with short-term patterns of political precipitants (captured in our case through ICEWS country-year event counts) takes us farther toward reliably forecasting major political conflict, particularly for the much trickier task of forecasting unarmed conflicts. Yet country-year event counts in year t are a very blunt instrument for capturing the precipitants of conflict at year t + 1. In some cases, they may simply reflect that conflict is already ongoing at time t. Thus, another critical area for future research will be more fine-tuned data collection and modeling to capture these precipitating processes.
The specific triggering actions that turn structural risk factors and political precipitants into full-on conflict periods are likely to remain mysterious, both to outside observers and even to those within countries on the verge of conflict. We do not discount the possibility that even better data and more sophisticated modeling methods might be able to comprehensively identify even short-term triggering actions, but we expect this possibility to be slight. However, we do not believe that our models come close to the upper possible limit in forecasting political conflicts. As the field advances and our ability to code such events with greater precision increases, we expect the field’s forecasting ability to similarly increase, particularly when it comes to unarmed conflicts.
The significant advance in forecasting accuracy for unarmed conflicts that we reach in this paper, and the attendant likely future increases in forecasting accuracy raise significant ethical questions. If we can forecast an unarmed conflict with a high degree of accuracy, might a dictator with access to our models or similar modeling efforts violently suppress the nascent political opposition in their country to prevent such an uprising from occurring?
At this stage, such a concern is not directly applicable. Our empirical testing has explicitly focused on forecasting power rather than causal links. While the model reliably indicates that a conflict is likely, it does not make any causal claims about the reasons why, nor does it make any specific suggestions for policy interventions that could either increase or decrease the likelihood of an uprising occurring. Nevertheless, as our ability to forecast improves and the level of detail that our forecasts can achieve similarly improves, considering the potential uses and abuses of our research is a crucial question to consider. Anticipating the future is not merely an academic question, it is one central to the most important aspects of maintaining political order.
Supplemental Material
Download MS Word (7.5 MB)Acknowledgment
The authors are grateful for feedback from Matthew DiGiuseppe, John Gledhill, Joop van Holsteyn, Corinna Jentzsch, Daniel C. Thomas, and participants in our panels at the Conflict Research Society annual conference, the Tinbergen European Peace Science Conference, The Hague, The Netherlands, and Political Studies Association Political Methodology Group Annual Conference. We also would like to thank three anonymous reviewers and the editors for their invaluable comments.
Correction Statement
This article has been corrected with minor changes. These changes do not impact the academic content of the article.
Notes
1 We follow the distinction in Hegre et al. (Citation2017, 113) between forecasting as “prediction about unrealized outcomes given model estimates from realized data” and prediction as “the assignment of probability distributions to realized or unrealized outcomes.”
2 See the articles in the special issue of the Journal of Peace Research edited by Hegre et al. (Citation2017).
3 If we consider the models with the lag of outcome variables, the models perform even better. See the empirical section for further details.
4 A focus on statistical significance as measured through low p-values also puts conflict research in danger of p-hacking, in which the researcher’s biases lead them to manipulate findings to achieve their preferred result. For seminal articles on p-hacking, see Bruns and Ioannidis (Citation2016) and Ioannidis (Citation2005).
5 See complete definition as well as the definition of all these specific terms at https://www.pcr.uu.se/research/ucdp/definitions/.
6 This timeframe was determined based on limitations in data availability.
7 Running the reported trained algorithms took about 12 hours on an Amazon Web Services virtual machine with 36 CPU cores and 72 gigabytes of RAM.
8 The number of possible structural variables to employ in conflict forecasting is rapidly proliferating. We selected the variables for our models as well-supported predictors commonly used across a wide variety of influential sources and with relatively little missing data. For studies that employ similar structural predictors, see Chenoweth and Ulfelder (Citation2017) and Hegre et al. (Citation2019).
9 where
group i’s population share.
10 Similarly aggregated event counts of various types (both from ICEWS and from other sources) have been used in conflict forecasting by Blair and Sambanis (Citation2020), Chenoweth and Ulfelder (Citation2017), Chiba and Gleditsch (Citation2017), and Ward et al. (Citation2013), among others.
11 For a detailed discussion of these methods, see Hastie, Tibshirani, and Friedman (2013).
12 Specifically, precision-recall curves plot the number of true positives divided by the sum of true positives plus the false negatives (recall) along the x-axis and the number of true positives divided by the sum of true positives and false positives along the y-axis.
13 For a detailed discussion of the advantages of the AUC-PR over the AUC-ROC, see Beger (Citation2016). Alternate measures of model performance include Brier and F1 scores. We chose the AUC-PR over these measures for ease of comparability to the commonly employed and well-understood AUC-ROC. For a discussion of the advantages and disadvantages of various performance measures in conflict forecasting, see D’Orazio (Citation2020).
14 One exception is Muchlinski et al. (Citation2016).
15 Countries in MENA determined by the countries included in the MENA politico-geographic category by the Varieties of Democracy project.
16 NAVCO 2.1 codes the revolution in Syria as primarily nonviolent in 2011 and shifting to a violent civil war in 2012.
17 Friedman’s (Citation2001) relative importance of input variables sums marginal improvements over all boosted trees. These values are then normalized to give us a ranking of features. We also perform, Breiman’s (Citation2001) permutation feature importance is an alternate method of measuring the importance of individual predictors, which we discuss and present results from in the online appendix (Figures A17 and A18). The findings of these methods are not substantially different.
References
- Abbs, Luke, and Kristian Skrede Gleditsch. 2021. “Ticked off, but Scared off? Riots and the Fate of Nonviolent Campaigns.” Mobilization: An International Quarterly 26 (1): 21–39. doi:10.17813/1086-671X-26-1-21.
- Bayer, Markus, Felix S. Bethke, and Daniel Lambach. 2016. “The Democratic Dividend of Nonviolent Resistance.” Journal of Peace Research 53 (6): 758–771. doi:10.1177/0022343316658090.
- Beger, Andreas. 2016. Precision-Recall Curves (SSRN Scholarly Paper). Rochester, NY: Social Science Research Network.
- Bethke, Felix S., and Jonathan Pinckney. 2021. “Nonviolent Resistance and the Quality of Democracy.” Conflict Management and Peace Science 38 (5): 503–523. doi:10.1177/0738894219855918.
- Blair, Robert A., and Nicholas Sambanis. 2020. “Forecasting Civil Wars: Theory and Structure in an Age of ‘Big Data’ and Machine Learning.” Journal of Conflict Resolution 64 (10): 1885–1915. doi:10.1177/0022002720918923.
- Boschee, Elizabeth, Jennifer Lautenschlager, Sean O’Brien, Steve Shellman, James Starz, and Michael Ward. 2015. “ICEWS Coded Event Data.” doi:10.7910/DVN/28075.
- Bowlsby, Drew, Erica Chenoweth, Cullen Hendrix, and Jonathan D. Moyer. 2020. “The Future Is a Moving Target: Predicting Political Instability.” British Journal of Political Science 50 (4): 1405–1417. doi:10.1017/S0007123418000443.
- Braithwaite, Alex, Jessica Maves Braithwaite, and Jeffrey Kucik. 2015. “The Conditioning Effect of Protest History on the Emulation of Nonviolent Conflict.” Journal of Peace Research 52 (6): 697–711. doi:10.1177/0022343315593993.
- Braithwaite, Jessica Maves, Charles Butcher, Jonathan Pinckney, Ingrid Vik Bakken, Marius Swane Wishman, and Eirin Haugseth. 2022. “Introducing the Anatomy of Resistance Campaigns (ARC) Dataset.” Journal of Peace Research 59 (3): 449–460.
- Breiman, Leo. 2001. “Random Forests.” Machine Learning 45 (1): 5–32. doi:10.1023/A:1010933404324.
- Bruns, Stephan B., and John P. A. Ioannidis. 2016. “P-curve and p-Hacking in Observational Research.” PLoS One 11 (2): 1–13. doi:10.1371/journal.pone.0149144.
- Butcher, Charles, and Isak Svensson. 2016. “Manufacturing Dissent: Modernization and the Onset of Major Nonviolent Resistance Campaigns.” Journal of Conflict Resolution 60 (2): 311–339. doi:10.1177/0022002714541843.
- Celestino, Mauricio Rivera, and Kristian Skrede Gleditsch. 2013. “Fresh Carnations or All Thorn, No Rose? Nonviolent Campaigns and Transitions in Autocracies.” Journal of Peace Research 50 (3): 385–400. doi:10.1177/0022343312469979.
- Chadefaux, Thomas. 2014. “Early Warning Signals for War in the News.” Journal of Peace Research 51 (1): 5–18. doi:10.1177/0022343313507302.
- Chenoweth, Erica, and Christopher Shay. 2020. “NAVCO 2.1 Dataset.” Harvard Dataverse. Accessed 12 February 2020. https://dataverse.harvard.edu/dataset.xhtml?persistentId= doi:10.7910/DVN/MHOXDV.
- Chenoweth, Erica, and Jay Ulfelder. 2017. “Can Structural Conditions Explain the Onset of Nonviolent Uprisings?” Journal of Conflict Resolution 61 (2): 298–324. doi:10.1177/0022002715576574.
- Chenoweth, Erica, and Kathleen Gallagher Cunningham. 2013. “Understanding Nonviolent Resistance: An Introduction.” Journal of Peace Research 50 (3): 271–276. doi:10.1177/0022343313480381.
- Chenoweth, Erica, and Kurt Schock. 2015. “Do Contemporaneous Armed Challenges Affect the Outcomes of Mass Nonviolent Campaigns?” Mobilization: An International Quarterly 20 (4): 427–451. doi:10.17813/1086-671X-20-4-427.
- Chenoweth, Erica, and Maria J. Stephan. 2011. Why Civil Resistance Works: The Strategic Logic of Nonviolent Conflict. New York: Columbia University Press.
- Chenoweth, Erica, and Orion A. Lewis. 2013. “Unpacking Nonviolent Campaigns: Introducing the NAVCO 2.0 Dataset.” Journal of Peace Research 50 (3): 415–423. doi:10.1177/0022343312471551.
- Chiba, Daina, and Kristian Skrede Gleditsch. 2017. “The Shape of Things to Come? Expanding the Inequality and Grievance Model for Civil War Forecasts with Event Data.” Journal of Peace Research 54 (2): 275–297. doi:10.1177/0022343316684192.
- Collier, Paul, and Anke Hoeffler. 2004. “Greed and Grievance in Civil War.” Oxford Economic Papers 56 (4): 563–595. doi:10.1093/oep/gpf064.
- Coppedge, Michael, John Gerring, Carl Henrik Knutsen, Staffan I. Lindberg, Jan Teorell, David Altman, Michael Bernhard et al. “V-dem codebook v9.” (2019).
- Cunningham, Kathleen Gallagher. 2013. “Understanding Strategic Choice: The Determinants of Civil War and Nonviolent Campaign in Self-determination Disputes.” Journal of Peace Research 50 (3): 291–304. doi:10.1177/0022343313475467.
- D’Orazio, Vito. 2020. “Conflict Forecasting and Prediction.” In Oxford Research Encyclopedia of International Studies, edited by Nukhet Sandal and Renee Marlin-Bennett. New York: Oxford University Press. doi: https://doi.org/10.1093/acrefore/9780190846626.013.514
- Fariss, Christopher. 2019. “Latent Human Rights Protection Scores Version 3.” https://doi.org/10.7910/DVN/TADPGE,HarvardDataverse,V1,UNF:6:0sWy9tSpQVpzz2xGoGLtkA==[fileUNF]
- Fariss, Christopher J. 2014. “Respect for Human Rights Has Improved over Time: Modeling the Changing Standard of Accountability.” American Political Science Review 108 (2): 297–318. doi:10.1017/S0003055414000070.
- Fearon, James D., and David D. Laitin. 2003. “Ethnicity, Insurgency, and Civil War.” American Political Science Review 97 (1): 75–90. doi:10.1017/S0003055403000534.
- Friedman, Jerome H. 2001. “Greedy Function Approximation: A Gradient Boosting Machine.” Annals of Statistics 29 (5): 1189–1232.
- Ghonim, Wael. 2012. Revolution 2.0: The Power of the People is Greater than the People in Power. New York: Houghton Mifflin Harcourt.
- Gleditsch, Kristian S., and Mauricio Rivera. 2017. “The Diffusion of Nonviolent Campaigns.” Journal of Conflict Resolution 61 (5): 1120–1145. doi:10.1177/0022002715603101.
- Goldsmith, Benjamin E., Charles R. Butcher, Dimitri Semenovich, and Arcot Sowmya. 2013. “Forecasting the Onset of Genocide and Politicide: Annual Out-of-sample Forecasts on a Global Dataset.” Journal of Peace Research. 50 (4): 437–452. doi:10.1177/0022343313484167.
- Goldstone, Jack A., Robert H. Bates, David L. Epstein, Ted Robert Gurr, Michael B. Lustik, Monty G. Marshall, Jay Ulfelder, and Mark Woodward. 2010. “A Global Model for Forecasting Political Instability.” American Journal of Political Science 54 (1): 190–208. doi:10.1111/j.1540-5907.2009.00426.x.
- Gurr, Ted Robert. 1970. Why Men Rebel. Abingdon-on-Thames: Routledge.
- Hegre, Håvard, Joakim Karlsen, Håvard Mokliev Nygård, Håvard Strand, and Henrik Urdal. 2013. “Predicting Armed Conflict.” International Studies Quarterly 57 (2): 250–270. doi:10.1111/isqu.12007.
- Hegre, Håvard, Marie Allansson, Matthias Basedau, Michael Colaresi, Mihai Croicu, Hanne Fjelde, Frederick Hoyles, et al. 2019. “ViEWS: A Political Violence Early-warning System.” Journal of Peace Research 56 (2): 155–174. doi:10.1177/0022343319823860.
- Hegre, Håvard, Nils W. Metternich, Håvard Mokleiv Nygård, and Julian Wucherpfennig. 2017. “Introduction: Forecasting in Peace Research.” Journal of Peace Research 54 (2): 113–124. doi:10.1177/0022343317691330.
- Hastie, Trevor, Robert Tibshirani, Jerome H. Friedman, and Jerome H. Friedman. 2009. The Elements of Statistical Learning: Data Mining, Inference, and Prediction. Vol. 2. New York: Springer.
- Ioannidis, John P. A. 2005. “Why Most Published Research Findings Are False.” PLoS Medicine 2 (8): 696–701. doi:10.1371/journal.pmed.0020124.
- Kadivar, Mohammad Ali, and Neil Ketchley. 2018. “Sticks, Stones, and Molotov Cocktails: Unarmed Collective Violence and Democratization.” Socius: Sociological Research for a Dynamic World 4: 1–15. doi:10.1177/2378023118773614.
- Karakaya, Süveyda. 2018. “Globalization and Contentious Politics: A Comparative Analysis of Nonviolent and Violent Campaigns.” Conflict Management and Peace Science 35 (4): 315–335. doi:10.1177/0738894215623073.
- Karatnycky, Adrian, and Peter Ackerman. 2005. How Freedom Is Won: From Civic Resistance to Durable Democracy. Washington: Freedom House.
- Ketchley, Neil. 2017. Egypt in a Time of Revolution. New York: Cambridge University Press.
- Kuran, Timur. 1991. “Now out of Never: The Element of Surprise in the East European Revolution of 1989.” World Politics 44 (1): 7–48. doi:10.2307/2010422.
- Lake, David A., and Donald Rothchild. 1996. “Containing Fear: The Origins and Management of Ethnic Conflict.” International Security 21 (2): 41–75. doi:10.1162/isec.21.2.41.
- Lynch, Marc. 2013. The Arab Uprising: The Unfinished Revolutions of the New Middle East. New York: Public Affairs.
- Montgomery, Jacob M., Florian M. Hollenbach, and Michael D. Ward. 2012. “Improving predictions using ensemble Bayesian model averaging.” Political Analysis 20 (3): 271–291.
- McAdam, Doug, Sidney Tarrow, and Charles Tilly. 2003. Dynamics of Contention. New York: Cambridge University Press.
- Muchlinski, David, David Siroky, Jingrui He, and Matthew Kocher. 2016. “Comparing Random Forest with Logistic Regression for Predicting Class-imbalanced Civil War Onset Data.” Political Analysis 24 (1): 87–103. doi:10.1093/pan/mpv024.
- Mueller, Hannes, and Christopher Rauh. 2018. “Reading between the Lines: Prediction of Political Violence Using Newspaper Text.” American Political Science Review 112 (2): 358–375. doi:10.1017/S0003055417000570.
- Pinckney, Jonathan. 2016. Making or Breaking Nonviolent Discipline. Washington: ICNC Press.
- Pinckney, Jonathan. 2020. From Dissent to Democracy: The Promise and Perils of Civil Resistance Transitions. New York: Oxford University Press.
- RezaeeDaryakenari, Babak. 2021. “The Dilemma of Violence.” Political Research Exchange 3 (1). doi:10.1080/2474736X.2021.1910048.
- Schock, Kurt. 2005. 22 Unarmed Insurrections: People Power Movements in Nondemocracies. Minneapolis: University of Minnesota Press.
- Schrodt, Philip A. 2014. “Seven Deadly Sins of Contemporary Quantitative Political Analysis.” Journal of Peace Research 51 (2): 287–300. doi:10.1177/0022343313499597.
- Schrodt, Philip A., Deborah J. Gerner, Omur Yilmaz, and Dennis Hermreck. 2005. “The CAMEO (Conflict and Mediation Event Observations) Actor Coding Framework.” Paper presented at Annual Meeting of the American Political Science Association. Washington, DC, September 1–4. http://eventdata.parusanalytics.com/papers.dir/APSA.2005.pdf.
- Sharp, Gene. 1973. The Politics of Nonviolent Action. Boston: Porter Sargent.
- Singer, Joel David, and Michael David Wallace, eds. 1979. To Augur Well: Early Warning Indicators in World Politics. Thousand Oaks: SAGE Publications.
- Taleb, Nassim Nicholas, and Mark Blyth. 2011. “The Black Swan of Cairo: How Suppressing Volatility Makes the World Less Predictable and More Dangerous.” Foreign Affairs 90 (3): 33–39.
- Thurber, Ches. 2018. “Ethnic Barriers to Civil Resistance.” Journal of Global Security Studies 3 (3): 255–270. doi:10.1093/jogss/ogy018.
- Ward, Michael D., and Andreas Beger. 2017. “Lessons from near Real-time Forecasting of Irregular Leadership Changes.” Journal of Peace Research 54 (2): 141–156. doi:10.1177/0022343316680858.
- Ward, Michael D., Brian D. Greenhill, and Kristin M. Bakke. 2010. “The Perils of Policy by P-value: Predicting Civil Conflicts.” Journal of Peace Research 47 (4): 363–375. doi:10.1177/0022343309356491.
- Ward, Michael D., Nils W. Metternich, Cassy L. Dorff, Max Gallop, Florian M. Hollenbach, Anna Schultz, and Simon Weschle. 2013. “Learning from the Past and Stepping into the Future: Toward a New Generation of Conflict Prediction.” International Studies Review 15 (4): 473–490. doi:10.1111/misr.12072.
- Weidmann, Nils B. 2016. “A Closer Look at Reporting Bias in Conflict Event Data.” American Journal of Political Science 60 (1): 206–218. doi:10.1111/ajps.12196.