
ABSTRACT
We use PIAAC data to study the relationship between parental education and educational success among adults from 23 advanced economies. We consider educational success in terms of both educational attainment (formal qualifications) and educational achievement (competencies) and in both absolute and relative terms (i.e. as the individual’s rank in the distribution of educational success). Parental education effects are stronger for educational attainment than for achievement in all countries. Cross-national variation in the strength of social background effects follows broadly similar patterns for the different ways of measuring success, but a few countries combine relatively strong achievement with relatively weak attainment effects and vice versa. Tracking in secondary education is associated with stronger background effects for educational attainment but not for achievement. Greater prevalence of formal (non-formal) AET is associated with stronger (weaker) background effects for both attainment and achievement, while vocational orientation of upper secondary education does not matter much.
Introduction
Educational success is crucial for life outcomes. However, what educational success means has been defined quite differently in previous research. Some studies look at educational certificates, others at competencies – and while related, they capture distinct dimensions of educational success. Moreover, labour market research shows that both certificates and competencies predict labour market attainment, even after accounting for the respective other dimension of educational success (e.g. Heisig and Solga Citation2017). According to Checchi and van de Werfhorst (Citation2018, 137), competencies might even be ‘a more important predictor of earnings inequality than educational attainment.’ Hence, education and labour market research should be interested in both educational attainment (educational degrees) and educational achievement (competencies).
The dual focus on attainment and achievement also characterises the literature on social background effects, which has demonstrated that social origin – in terms of parental education or class – is an important determinant of educational success. In recent years, this literature has increasingly investigated how background effects vary according to national education systems and other contextual factors. A first group of studies uses data on adults and typically measures educational success as educational attainment (e.g. Bernardi and Ballarino Citation2014; Breen et al. Citation2009; Pfeffer Citation2015). A second group uses data on school-aged children (e.g. from the PISA studies) and analyses social background effects on competencies or test scores, that is, on educational achievement (e.g. Horn Citation2009; Marks Citation2005). So far it has not been thoroughly investigated if cross-national differences in social background effects are robust across these different conceptualisations of educational success (an exception is the 2007 study by Brunello and Checchi discussed below).
Why might the measure of educational success affect our conclusions concerning the strength of social background effects? First, background effects might be systematically stronger for educational degrees than for actual competencies; for example, because parents may find it easier to optimise their children’s level of formal qualifications than their level of competencies (Erikson and Jonsson Citation1996; Breen and Goldthorpe Citation1997). Second, while higher degrees tend to be associated with higher competencies, studies show that the strength of the relationship varies considerably across countries (Heisig and Solga Citation2015; Park and Kyei Citation2011). Whether these differences in the degree-competency-relationship translate into differences in the magnitude of social background effects remains an open question. Third, national education systems (e.g. in terms of tracking, vocational orientation, or adult education and training) might be differently associated with social inequalities in attainment vs. achievement. For example, Brunello and Checchi (Citation2007) find that tracking in secondary education reinforces family background effects for educational attainment but not for literacy proficiency. This is a somewhat puzzling result that deserves re-examination, if only because serious problems with Brunello and Checchi’s primary source of competency data, the mid-1990s IALS (International Adult Literacy Survey), have emerged in recent years (for details, see Gesthuizen, Solga, and Ralf Citation2011; Solga Citation2014).
Against this backdrop, we use data from the Programme for the International Assessment of Adult Competencies (PIAAC) to study the strength of social background effects on attainment and achievement. We investigate, a), whether cross-country differences in background effects are larger for attainment or achievement and, b), how the strength of background effects on attainment/achievement is related to national education systems. In addition to tracking and vocational orientation in secondary education, both of which feature prominently in previous research, we explore the role of country differences in the prevalence of (formal and non-formal) adult education and training. As a further contribution, c), we not only study inequalities in individuals’ absolute level of educational success but also in their relative rank in the distributions of degrees and competencies. We thus take up recent debates about the ‘positionality’ of education (Shavit and Park Citation2016; see also Hirsch Citation1978).
Theoretical considerations and previous research
We study cross-national variation in social background effects on educational attainment (e.g. years of education) and achievement (e.g. numeracy skills). In this section, we discuss why the strength of background effects might be different for the two dimensions of educational success and how national education systems might moderate the importance of social background.
Attainment vs. achievement
There are at least four reasons why social background might be more strongly related to degrees than to cognitive skills such as numeracy competencies: (i) educational choices (e.g. whether to pursue a college degree) are easier to manipulate by means of parental cultural and economic resources (e.g. educational aspirations, interactions with teachers, or financial resources) than children’s cognitive development (Bills Citation2016; Rotman, Shavit, and Shalev Citation2016); (ii) parents might consider educational degrees more important for class reproduction because in so-called meritocratic societies certificates serve as entitlements to certain occupational positions on labour markets and as signals for employers’ hiring decisions (Bills Citation2003; Bukodi and Goldthorpe Citation2016; Rotman, Shavit, and Shalev Citation2016); (iii) certificates are not only more easily observable for employers but also for parents and children and thus might attract greater attention; (iv) attainment not only depends on cognitive skills, but also on non-cognitive traits (e.g. conscientiousness, perseverance, or self-control) that children from higher social backgrounds are better equipped with (e.g. Heckman and Rubinstein Citation2001).Footnote1
Based on these considerations, we expect social background effects to be stronger for educational attainment than for educational achievement. While this prediction may seem straightforward, it has, to our knowledge, not been thoroughly tested. Thus, a first goal of our study is to do so using consistent samples and methods for a large set of advanced economies. Our analysis will reveal how closely social background effects on formal qualifications and actual competencies are aligned within countries, but the strength of this alignment will also have implications for patterns of cross-country variation: a weak alignment implies that country rankings are sensitive to how educational success is conceptualised. A second goal of our analysis therefore is to examine whether patterns of cross-national variation in the strength of social background effects depend on, a), whether educational success is conceptualised in terms of attainment or achievement and, b), whether it is measured in absolute or relative terms (see below).
Our analysis is concerned with the total effects of parental background on educational attainment and educational achievement in adulthood. While we analyse both outcomes separately, this does not mean that we consider them independent. In fact, the two are likely strongly interdependent. On the one hand, achievement and competencies influence attainment, for example, by affecting enrolment decisions and eligibility for educational programmes. On the other hand, educational attainment and learning in schools can be expected to affect the development of competencies. For attainment, the total background effect thus encompasses both an indirect channel that operates through educational achievement and a direct channel that does not.Footnote2 Similarly, the total background effect for educational achievement comprises an indirect channel that operates through attainment and a direct channel that does not.
A comprehensive empirical analysis of the life-course processes that link family background to educational outcomes in adulthood would model the mutual and dynamic feedback effects between educational attainment and achievement. However, estimating such a model requires either very strong assumptions or much richer data than we have at our disposal. Our aim therefore merely is to assess the total effects of family background on the different educational outcomes. Attainment and achievement, while closely related, are not the same thing. It therefore is an empirical question whether the total family background effect is systematically stronger for one than the other (above, we discussed why it might be stronger for attainment). It is also an empirical question to what extent countries with strong total background effects for attainment show similarly strong ones for achievement. These are the questions that motivate our analysis and that have also motivated previous studies like Brunello and Checchi (Citation2007).
Relative vs. absolute attainment/achievement
Our goal of comparing the strength of social background effects across the two dimensions of educational success is complicated by the fact that attainment and competencies are measured on different scales. One way to address this issue at least partially is to focus on the relative rank of individuals in the respective distributions (Tam Citation2016).
The distinction between absolute and relative levels of education is not merely a measurement issue, however. Education in absolute terms refers to the intrinsic value of education as cognitive development and socialisation, while education in relative terms focuses more strongly on status competition (Shavit and Park Citation2016; Sørensen Citation1979; Thurow Citation1975; Ultee Citation1980). Recent studies have increasingly looked at educational success in relative terms because education may partly function as a ‘positional good’ (Bills Citation2016; Bol Citation2015; Di Stasio, Bol, and van de Werfhorst Citation2016; Shavit and Park Citation2016; Tam Citation2016). According to this perspective, status attainment depends not only on the absolute level of educational success but also on one’s rank in the overall educational distribution.
This positional perspective is still rare in research on social background effects, with most studies focusing on absolute differences in educational outcomes (e.g Brunello and Checchi Citation2007; Horn Citation2009; Marks Citation2005; Pfeffer Citation2015). There are a few exceptions, however, including Bukodi and Goldthorpe (Citation2016) and Rotman, Shavit, and Shalev (Citation2016). These studies show that cohort trends in social background effects may look quite different for absolute and relative measures of educational success. Our second goal therefore is to explore if patterns of cross-national variation in social background effects depend on whether educational success is measured in absolute or relative terms.
The role of education systems
As a third goal, we (re-)examine how the strength of social background effects relates to three education system characteristics. The first two, tracking and vocational orientation in upper secondary education, have received considerable attention in previous research. Tracking refers to the separation of students into different tracks or programmes, usually according to (perceived) academic abilities (van de Werfhorst and Mijs Citation2010). Tracking may reinforce social inequality in educational attainment because it raises ‘information requirements for students to successfully navigate their educational careers’ (Pfeffer Citation2015, 353). Moreover, when allocation to different tracks is based on (prior) academic achievement, higher class children should be more likely to attend higher tracks because their families ‘are more likely to provide a better environment for the development of talent in the early stages of individual life’ (Brunello and Checchi Citation2007, 796). Attendance of different tracks may then further reinforce social background effects, for example, due to differences in school environments, curricula, or peer effects.
Previous research confirms that tracking increases the influence of family background on educational achievement in adolescence (e.g. Horn Citation2009; van de Werfhorst and Mijs Citation2010). Brunello and Checchi (Citation2007) find that tracking is also associated with stronger social background effects on educational attainment among adults. Strikingly, they find no such relationship for literacy skills; by contrast, ‘earlier tracking even seems to reduce the impact of family background on the development of these skills’ (821; emphasis added). This finding is surprising enough to warrant re-examination, especially since educational degrees for the Czech Republic, Germany, Poland, and the UK were more recently found to be classified incorrectly in IALS, the dataset used by Brunello and Checchi (see Gesthuizen, Solga, and Ralf Citation2011; Solga Citation2014).
Vocational orientation refers to the extent to which upper secondary education emphasises occupation-specific/vocational as opposed to general competencies (Bol and Van de Werfhorst Citation2016). One line of argument suggests that vocational orientation amplifies social inequalities by ‘diverting’ working-class children from tertiary education (Mayer, Müller, and Pollak Citation2007, 264; Shavit and Müller. Citation2000). Other scholars suggest an inequality-reducing effect. Soskice, for example, argues that vocational programmes in upper secondary education provide students with an ‘incentive structure […] to work hard at school, independent of their ability level’ (Soskice Citation1994, 33), whereas in (non-vocational) general education systems ‘the incentives to work hard academically are […] limited for young people with little chance of getting into higher education’ (55).
Previous findings for the relationship between the vocational orientation of upper secondary education and inequalities in educational success are inconclusive. Brunello and Checchi's (Citation2007) analysis of working-age adults suggests that a stronger vocational orientation reduces background effects on both attainment and achievement. Other studies, including studies of student achievement (Horn Citation2009) and adult attainment (Pfeffer Citation2015), find no clear effects. Given these inconsistent results, our analysis revisits the role of vocational orientation.
As a new contribution to the literature, we examine the role of formal and non-formal adult education and training (AET), since we consider adults in our study and know that participation rates in AET vary widely across countries (Cedefop Citation2015). Participation in AET during the work career may contribute to adults’ educational attainment in terms of degrees (especially formal AET) and also to their educational achievement in terms of skills (both formal and non-formal AET). The net effect of AET on the strength of social background effects could in principle go either way. The predominant conclusion in the rather small empirical literature seems to be that AET participation increases rather than reduces social inequalities (Boudard and Rubenson Citation2003; Cincinnato et al. Citation2016; Müller and Jacob Citation2008).
However, previous research has mostly looked at social inequalities in AET participation – and not at the relationship between AET and inequalities in educational outcomes. Many studies also fail to differentiate between formal and non-formal AET. There are reasons to expect that formal AET is inequality-enhancing, especially regarding educational attainment. Formal AET programmes may function as ‘second chances’ for children from privileged families who failed to realise their own and/or their parents’ educational goals in their initial cycle of studies (Hillmert and Jacob Citation2005). Non-formal AET, especially when work(place)-related or provided in non-market settings (e.g. public training programmes for the unemployed), might be more inclusive and reduce initial skills inequalities (Müller and Jacob Citation2008). Against this background, we will investigate whether a country’s AET regime, measured as the prevalence of formal and non-formal AET among 30-to-49-year-olds, is related to social background effects on educational success in adulthood.
Data and methods
Individual-level data and sample restrictions
Our individual-level data come from the first and second rounds of PIAAC, conducted in 2011/12 and 2014/15, respectively (OECD Citation2013a, Citation2016).Footnote3 PIAAC provides high-quality measures of educational attainment and internationally comparable data on the literacy and numeracy proficiency of working-age adults (OECD Citation2013a). The proficiency measures are based on an assessment component consisting of generic cognitive test items (OECD Citation2013b). We use 23 of the 33 countries that participated in PIAAC (see for a list). Ten countries are excluded because of missing information and/or problems with the data.Footnote4 We restrict the analysis to respondents aged 30 to 49. The lower bound ensures that most respondents have completed their initial educational biography whereas the upper bound guarantees a good match with the education system measures. We exclude respondents who did not obtain their highest degree in the country where they participated in the survey. After applying these sample restrictions and dropping so-called literacy-related non-respondents (OECD Citation2013a, Citation2013b) as well as a small share of cases with missing information (less than seven percent of those meeting the sample restrictions), we end up with a total of 51,920 cases.
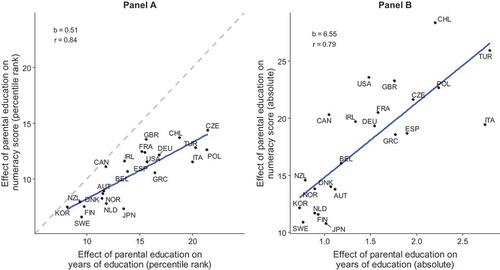
Figure 1. Social background effects on years of education (attainment) and numeracy (achievement) in 23 countries. Countries included: Austria (AUT), Belgium (BEL), Canada (CAN), Chile (CHL), Czech Republic (CZE), Denmark (DNK), Finland (FIN), France (FRA), Germany (GER), Great Britain (GBR), Greece (GRC), Ireland (IRL), Italy (ITA), Japan (JPN), Korea (KOR), Netherlands (NLD), New Zealand (NZL), Norway (NOR), Poland (POL), Spain (ESP), Sweden (SWE), Turkey (TUR), USA (USA).Source: PIAAC, own calculations.
Individual-level variables
Educational attainment is measured in terms of the number of years of education typically required to attain a person’s highest degree. Educational achievement is measured using the PIAAC competency scores. We focus on numeracy proficiency, which tends to be a stronger predictor of labour market outcomes than literacy (Hanushek et al. Citation2015). We also reran the analysis with literacy, with qualitatively similar results (see Online Appendix, Section C).
For educational achievement, we use the PIAAC competency scores. They are quite uncertain because each respondent completed only a relatively small number of test items. To account for this uncertainty, we use the ten ‘plausible values’ (OECD Citation2013b) provided in the PIAAC data: we run all analyses involving a competency measure ten times, once for each plausible value, and obtain final point estimates and standard errors using the appropriate rules (Little and Rubin Citation2002). The numeracy scale ranges from 0 to 500, with a mean of approximately 274 and a standard deviation of approximately 53 points for our sample.
To assess social background effects on absolute levels of education, we use the untransformed measures of attainment (years of education) and achievement (numeracy). To capture relative inequalities, we compute the respondent’s percentile rank in the attainment/achievement distribution for the country-cohort that he/she belongs to (see, e.g. Bol Citation2015).
The only measure of social background available in the PIAAC data is parents’ educational attainment, which is provided in three categories: neither parent has completed upper secondary education; at least one parent has completed upper secondary or non-tertiary post-secondary education; at least one parent has completed tertiary education. We code these categories as 0, 1, and 2, respectively, and treat the predictor as continuous in the regressions. This has the advantage of capturing the magnitude of social background effects in a single parameter. Our approach follows that of Brunello and Checchi (Citation2007, 809 and note 36).
We include a set of standard controls in the regression models: the respondent’s sex, age (five-year groups), and foreign-birth/foreign-language status. The latter is a four-category measure indicating whether the respondent was born in the country where they participated in the survey and whether the language of the test was their first language. Online Appendix Table A1 shows country-specific means and proportions for these variables.
Country-level variables
To investigate whether tracking and vocational orientation moderate social background effects on educational success, we use the education system measures provided in Brunello and Checchi (Citation2007). The extent of tracking is measured as the fraction of the total length of primary and secondary education that is spent in tracked programmes or school types. Vocational orientation is measured as the share of students in upper secondary education who attend vocational programmes.
We match the education system measures for the mid-1980s and mid-1990s to individual respondents based on their year of birth (2012/2014 minus age at the time of the interview for first-/second-round countries).Footnote5 We assign the mid-1980s values of the education system measures to respondents born between 1963 and 1974 and the mid-1990s values to respondents born from 1975 to 1984. For Chile and Korea, we exclude the older birth cohort from the analysis because the values for the mid-1980s are unknown.
We measure the prevalence of adult education and training (AET) at the country level, differentiating between formal and non-formal AET. These are calculated from the PIAAC data as the proportion of respondents aged 30 to 49 who had participated in a measure of the given type within the 12 months preceding the interview. The AET measures thus capture the overall prevalence of AET in a country. We prefer the country-level measure to including AET participation at the individual level because participation in the last 12 months is a potentially noisy measure of an individual’s longer-term (cumulative) AET participation. This noise would lead to an underestimation of the importance of AET for educational outcomes.
Table A2 in the Online Appendix lists the values of the education system measures in the original metric. For the regression analyses, we z-standardise them (mean of 0 and standard deviation of 1). Table A3 shows pairwise correlations between the country-level variables. The correlation between tracking and vocational orientation is quite high (.61 for the mid-1980s and .67 for the mid-1990s). Moreover, participation in formal AET tends to be lower in countries with early tracking (r ≈ −.45). The correlation between participation rates in formal and non-formal AET is .53. Thus, countries with higher participation in formal programmes tend to show higher non-formal AET participation, but the relationship is far from perfect.
Analytical strategy and statistical methods
The coefficient of primary interest in our analysis is the one on parental education. To address our first research question – whether social background effects are stronger for attainment or for achievement – we can only analyse relative educational success, that is, an individual’s percentile rank in the distribution of years of schooling and competencies because the absolute levels of the two dimensions of educational success are not comparable (Tam Citation2016). Concerning our second research question, we compare patterns of country variation in the strength of background effects across the four outcome measures (attainment vs. achievement and absolute vs. relative). To answer our third research question, we study whether country(-cohort) differences in tracking, vocational orientation, and AET participation moderate the relationship between parental education and the four outcome measures. Here, we focus on cross-level interactions between the education system measures and the parental education measure.
Our data have a hierarchical structure where individuals are nested in cohorts, countries, and combinations of countries and cohorts (country-cohorts). Taking the resulting interdependencies among observations into account is essential for achieving correct statistical inference. We therefore estimate mixed-effects (multilevel) models with random effects at the country and country-cohort levels to capture unexplained similarities among respondents from the same country/country-cohort. At both levels, we include a random intercept term as well as a random slope on parental education, the latter being crucial for inference about the cross-level interactions (Heisig and Schaeffer Citation2019). One might suggest that we include another layer of random effects at the cohort level to model similarities among respondents who belong to the same cohort, but come from different countries (e.g. due to common supranational shocks). With two cohorts, such cohort-level random effects are difficult to estimate, however. We therefore capture potential common shocks (and age effects) by including age among the predictors in the fixed part of the model (Schmidt-Catran and Fairbrother Citation2016).
We estimate all models in R (R Core Team Citation2017) using the lme4 (Bates et al. Citation2017) and lmerTest (Kuznetsova, Brockhoff, and Rune Citation2017) packages. We use Restricted Maximum Likelihood estimation and the Satterthwaite method to approximate degrees of freedom for calculating p-values (Elff et al. CitationForthcoming). While we have taken great care to achieve accurate statistical inference, we note that our estimation approach does not allow us to use the replication weights provided with the data. We therefore cannot fully account for the country-specific sampling designs, so the standard errors and p-values reported below should be taken with a grain of salt.
Results
Social background effects in attainment vs. achievement
The first set of results concerns the relationship between social background effects on attainment vs. achievement. We use four different outcome measures: the within-country-cohort percentile rank for years of education and numeracy as relative measures, and the number of years of education and the numeracy score as absolute measures. We regress each of these measures on parental education and the controls, including a random intercept and a random slope for parental education at the country and the country-cohort levels. Combining the fixed and random parts of each model yields four sets of country-specific coefficients on parental education, which are plotted in . For simplicity, we ignore variation of the background effects at the country-cohort level (which is generally very small) and plot a single predicted slope per country.
Panel A of shows social background effects for the relative measures, which are directly comparable. If social background effects were similarly strong for both attainment and achievement, we would expect the two measurements to be more or less identical. This scenario is represented by the dashed diagonal line with a slope of 1. The actual empirical pattern deviates systematically from this scenario. It is summarised by the flatter solid line with a slope of .5. Crucially, the influence of parental education is weaker for educational achievement than for attainment in all countries. This confirms our first expectation.
The differences in effect sizes across the two dimensions are meaningful. As an example, consider the predicted background effects for Spain, which is located in the middle of the range of background effects and close to the regression line. For years of education, the predicted slope of parental education is 15.7, implying that children of high-educated parents are, on average, placed 31.4 percentile points above children of low-educated parents in the distribution of attainment (because the parental education variable ranges from 0 to 2 and 15.7*2 = 31.4). For numeracy, the predicted difference is ‘only’ 23 (= 2*11.5) percentile points.
Panel A also shows that countries differ substantially in the size of social background effects. The Nordic countries, Korea, New Zealand, Austria and the Netherlands cluster in the lower-left half of the plot, indicating comparatively low social background effects on both dimensions. The Mediterranean and Western European countries, as well as the U.S., cluster in the middle. The largest social background effects, especially in terms of attainment, are found in the Eastern European countries.
Panel B of repeats the analysis for the absolute measures of educational success. The x-axis is now interpreted as the predicted difference in the (adult) child’s years of education between low and middle (or middle and high) educated parents. The y-axis shows the predicted difference in numeracy proficiency. Taking the example of Spain (which again falls into the middle of the range for both outcomes), the predicted slopes imply that adults with high-educated parents have, on average, 3.8 (= 2*1.9) additional years of education relative to adults with low-educated parents. For numeracy, the difference is 37.4 (2*18.7) points, which corresponds to more than 70 percent of a standard deviation.
Because of the different scales, the coefficients cannot be compared directly. The correlation remains high (.79), however. More importantly and related to our second research goal, we see that the overall ordering of countries is quite similar to Panel A. However, there are some interesting outliers: For Canada, the U.S., Great Britain, Ireland, and Chile we see surprisingly strong background effects on numeracy, given the strength of background effects on attainment in these countries (i.e. these cases are located substantially above the regression line). In a second group of countries, background effects on numeracy are unexpectedly weak, given the strength of background effects on attainment. The most noteworthy case is Italy, which shows the strongest background effect on years of education but falls into the middle of the distribution when it comes to the background effect on numeracy.
To ascertain the robustness of these results, we repeated the analysis in with an alternative measure of the association between the four outcome measures and parental education: the proportion of variance in the outcomes that is explained by parental education. Results were similar to those in (for details, see Section B of the Online Appendix).
The role of education systems
We now address our third research question: whether education system characteristics moderate the strength of social background effects. We estimate five models for each for the four outcome measures. All models include all individual-level control variables, together with random intercepts and slopes for parental education at the country and country-cohort levels. The first model only includes parental education and the controls. This is the baseline specification underlying . The second to fourth models include the different education system characteristics one at a time, while the fifth model includes all characteristics simultaneously. Coefficient estimates for the control variables are shown in Section D of the Online Appendix.
displays coefficient estimates for the relative measures, with the percentile rank of years of education (Models 1 to 5) and of numeracy (Models 6 to 10) as dependent variables.Footnote6 At 14.49 percentile points, the coefficient for parental education is higher in the baseline model for years of education (Model 1) than in the corresponding model for numeracy (10.60 percentile points, Model 6). Again, this is consistent with our first expectation (and ).
Table 1. Education systems and educational success, relative (percentile) measures.
Models 2 and 7 add the tracking measure and its interaction with parental education. The interaction term is of central interest, as it shows how the strength of the social background effect changes with the extent of tracking. In Model 2, the sign of the coefficient for years of education is positive and significant. We find a smaller and statistically insignificant positive effect for numeracy in Model 7. Substantively, the estimate in Model 2 implies that a standard deviation increase in tracking strength raises the percentile gap in years of education between adults with low- and high-educated parents by about 2.6 (2*1.31) percentile points. This finding is consistent with previous evidence that tracking exacerbates social inequalities in educational success. However, we only find a significant effect for years of education (and not for numeracy), and even the effect for years of education is not robust to the inclusion of the vocational orientation and AET measures (Model 5).
Models 3 and 8 repeat these analyses for vocational orientation. Qualitatively, the coefficients show a similar pattern as in the case of tracking: The main effects of vocational orientation suggest that a larger vocational education sector is associated with lower relative attainment and achievement for adults with low-educated parents, and the interactions with parental education are positively signed, indicating an inequality-increasing effect of vocational education. The coefficient estimates are smaller than for tracking, however, and do not reach statistical significance.
Models 4 and 9 include the shares of formal and non-formal AET participation and their interactions with parental education. We find a similar pattern for both years of education and numeracy: For formal AET participation, we find positive interaction effects suggesting that a higher share of formal AET participation is associated with increased social background effects. The coefficient estimates are not statistically significant, however. For non-formal AET participation, we find statistically significant and sizeable negative interactions, indicating that higher shares of non-formal AET are associated with weaker background effects for both (relative) years of education and numeracy.
Models 5 and 10 include all education system measures simultaneously. All coefficient estimates retain the same sign as in the preceding specifications. The interaction of non-formal AET with parental education retains its large coefficient size and statistical significance. Apart from this, there are no further statistically significant effects in the full model.
shows equivalent models for the absolute measures of educational success. The interaction between tracking and parental education is statistically significant only for years of education as the outcome. Here, the effect size indicates a moderate, but substantively meaningful inequality-exacerbating effect: According to the full model (Model 5), a one standard deviation increase in tracking raises the gap in years of education between adults with high- and low-educated parents by about one third of a school year (2*.17 = .34). This implies that the predicted difference between children with high- and low-educated parents is approximately 1.2 years larger in the most strongly tracking than in the least strongly tracking countries.Footnote7 For numeracy, the gap between adults with high and low parental education is predicted to grow by 0.52 (2*.26) points per standard deviation increase in the tracking measure, which equates to a very modest 1% of the overall standard deviation of 53 points.Footnote8 For vocational orientation, the point estimates in Models 3 and 8 suggest a very modest inequality-increasing effect. None of the effects is statistically significant, however. These results are qualitatively similar to those for the relative outcomes.
Table 2. Education systems and educational success, absolute measures.
Results for the AET participation measures also resemble those from . Focussing on the interaction effects in the full models (Models 5 and 10), we again find that a higher share of formal AET participation is associated with increased social background effects, while the opposite is true for non-formal AET. For non-formal AET, both the main effect and the interaction with parental education are statistically significant; for formal AET the interaction is significant in three out of four models.Footnote9 The magnitude of the coefficient estimates is substantial, especially for non-formal AET. To see this, compare the predicted difference in numeracy according to Model 10: In a country with average tracking, vocational orientation, formal- and non-formal AET, children with high-educated parents are predicted to score 36 points (2*17.88) higher on the numeracy scale than children with low-educated parents (recall that we treat parental education as a continuous variable that ranges from 0 to 2). Compare this to an otherwise similar country with a share of non-formal AET participation that is one standard deviation above the mean. In this case, the predicted gap is ‘only’ 27 points (2*17.88 + 20.53 + 2*–4.33–20.53). This reduction of 9 (= 36–27) points corresponds to 17% of a standard deviation for the numeracy scores.
As a robustness check, we computed DFBETA and Cook’s D statistics for the full specifications (Models 5 and 10 in and 3) to assess the possibility that individual country cases have an undue influence on the regression results. These checks, reported in Section F of the Online Appendix, indicate that the qualitative conclusions concerning the interactions between the education system measures and parental education do not hinge on the inclusion of individual countries.
We also explored whether our findings are robust to the inclusion of two additional education system characteristics, the prevalence of private school attendance (e.g. Brunello and Checchi Citation2007) and the centralisation of exit exams (e.g. Bol and Van de Werfhorst Citation2016). We report these results in Section E of the Online Appendix. Overall, private school attendance and central exit exams are only weakly related to the strength of background effects. Only for educational attainment do we find some evidence that the association between parental education and educational attainment is weaker when the prevalence of private schools is low. Importantly, the main results from and above continue to hold when we add the two additional education system characteristics (and their interactions with parental education) to the regressions.
Discussion and conclusions
Our analysis provides clear evidence that social background effects are systematically stronger for educational attainment (formal qualifications translated into years of education) than for educational achievement (actual competencies in terms of numeracy skills). Among a set of 23 diverse economies, we do not find a single case where the association between parental education and educational success – measured in terms of the percentile rank advantage of adults with higher-educated parents – is stronger for competencies than for years of education. This result is consistent with the idea that the advantages enjoyed by socially privileged children are more readily converted into degrees than into competencies (Rotman, Shavit, and Shalev Citation2016). Further research is needed to illuminate the mechanisms underlying this striking result.
We also investigated whether patterns of cross-national variation in the strength of social background effects depend on the dimension of educational success under study (attainment vs. achievement) and/or on whether success is measured in absolute or relative terms. In general, the extent of co-variation in the estimated social background effects is substantial (see ), indicating that country rankings should not depend too strongly on how educational success is measured. However, some countries exhibit unusually large or small background effects on numeracy given the strength of background effects for years of education. Canada, the U.S., and Chile – and, to a lesser extent, Ireland and Great Britain – belong to the first group where social background effects on competencies are surprisingly large given inequalities in schooling. A tentative explanation of this result is that the payoff to formal schooling (in terms of the actual competency gain) is higher for children from privileged backgrounds in these countries. This would seem consistent with the relatively large variation in the quality of schools (partly due to residential segregation) and higher education institutions in those countries. At the other end of the spectrum, we have Italy – and, to a lesser extent, Finland and Japan – where the competency advantage associated with a more privileged background is small given the magnitude of attainment differentials. In these countries, the additional years of education acquired by privileged children seem to have only limited returns in terms of competencies. Future research could shed light on the dynamics underlying these interesting cross-sectional patterns, ideally using individual-level longitudinal data on competency development.
A further goal of our analysis was to (re-)examine the role of education systems in shaping social background effects on educational outcomes. Most previous studies, many of which focus on school-aged children and adolescents, conclude that tracking reinforces background effects. Our results are consistent with this result, as the interaction between tracking and parental education is consistently positive. The size of the interaction appears modest, however. It is most consistent and robust for absolute years of education (, Model 5). The predicted difference between children with high- and low-educated parents is approximately 1.2 years larger in the earliest-tracking than in the latest-tracking countries. We cannot replicate Brunello and Checchi’s result that tracking reduces social background effects on competencies, as we find weak positive and statistically insignificant interactions when numeracy skills are the outcome. Our findings are thus somewhat less ‘paradoxical’ than those of Brunello and Checchi, who find the effect of tracking to run in opposite directions for attainment and achievement. However, it remains surprising that larger inequalities in attainment in strongly tracking countries do not seem to translate into equally large inequalities in achievement. Our findings indicate that this counterintuitive pattern is at least partly due to the Anglo-Saxon countries: if tracking exacerbates social inequalities, we should expect to see weak background effects in these countries with their comprehensive school systems. As noted above, the data fit this prediction much better for educational attainment than for numeracy skills.
We find no clear results for the vocational orientation of upper secondary education. Its interaction effects with parental education, while small, are consistently positive, hinting at the possibility that vocational education is associated with somewhat stronger background effects. The incentive mechanism emphasised by Soskice (Citation1994), which suggests an inequality-reducing effect, is not supported by our analysis. Heisig and Solga (Citation2015) found that vocational orientation is associated with higher competencies for less-educated adults, and hence with a smaller skills gap between less- and intermediate-educated adults. Interestingly, this smaller gap does not seem to coincide with weaker social background effects. Further research is needed to better understand how these findings fit together.
Given our focus on adults, we also explored the role of a country’s adult education and training regime, a factor that has received only limited attention in previous research. Results are very different for formal and non-formal AET. A higher country-level share of formal AET is associated with larger social background effects in terms of absolute outcomes, while the effects for relative outcomes are positive but insignificant. The opposite is true for non-formal AET participation: Here, we consistently find that non-formal AET is associated with smaller inequalities by social background. Despite concerns about endogeneity and reverse causality (see below), these strong and divergent results for formal and non-formal AET are intriguing and worthy of further investigation. One possible explanation for the divergence is that formal AET may often be initiated by individuals themselves, thus providing a ‘second chance’ primarily for those from privileged backgrounds. Non-formal AET, by contrast, may be more often organised by employers or public agents such as employment agencies. We cannot further pursue these possibilities due to space and data constraints, but our results suggest that AET institutions may play an important role in accounting for the effect of social background on educational outcomes in adulthood.
An obvious limitation of our study lies in its cross-sectional country-comparative design. We therefore note that the ‘effects’ of the education system measures should not be interpreted causally. A first caveat is that we cannot rule out the possibility that the relationships are at least partly attributable to unobserved country- and individual-level factors. Second, the causal pathways are by no means clear-cut, especially for AET participation. For instance, the fact that we find a positive, significant effect of the share of non-formal AET on years of education is puzzling given that non-formal programmes do not lead to recognised educational degrees. It is possible that non-formal measures serve as stepping stones on the way to formal degrees, but another plausible explanation is that the observed association is due to reverse causality. If those with higher levels of education are more likely to participate in AET (because of self-selection and/or because employers are more likely to select them), then higher educational success among adults from disadvantaged backgrounds may be a source as much as a consequence of higher AET participation rates. Future research should employ alternative designs that allow for a more credible identification of causal effects (e.g. effects of policy changes).
Despite these caveats, our study has produced several noteworthy findings. The result that social background is more strongly related to educational attainment than to achievement has, to our knowledge, not been demonstrated as clearly and for as large and diverse a set of countries. It could be viewed as a ‘stylised fact’ that theories of educational decision-making and competence development should be able to explain. We could not confirm Brunello and Checchi’s paradoxical finding of an inequality-reducing effect of tracking on competencies in adulthood; but neither did we find the inequality-increasing effect that one might expect. Finally, our results indicate that AET participation is an important factor to consider if we want to understand the long-term effects of social origins on educational outcomes in adulthood.
OnlineAppendix.docx
Download MS Word (482.8 KB)Disclosure statement
No potential conflict of interest was reported by the authors.
Supplementary material
Supplemental data for this article can be accessed here: https://doi.org/10.1080/03057925.2019.1677455
Notes
1. It is worth noting that the ‘key information-processing skills’ (OECD Citation2013a, 3) assessed in PIAAC, the data base for our empirical analysis, do not fully coincide with curricular notions of academic performance in formal education. This discrepancy between the notions of skills embedded in school curricula and in the PIAAC assessments is another reason why the strength of social background effects might depend on the measure of educational success. It does not seem clear, however, whether it should lead to systematically stronger or weaker background effects for attainment rather than achievement.
2. We use the term ‘direct’ in a relative sense (i.e. relative to the achievement channel) to denote any effect of background on attainment that does not operate via achievement. The direct effect thus defined may of course be indirect in the sense that the parental background effect may be mediated by other factors, for example, by differential educational decision-making conditional on academic performance.
3. For all countries except Germany and the U.S., we use the latest version of the public use files released on 28 June 2016, and available at http://www.oecd.org/skills/piaac/publicdataandanalysis/. For the U.S., we use the Combined 2012/2014 U.S. International PUF, which is available under the same address and includes additional cases from a second round of data collection. For Germany, we use version 1.1.0 of the so-called ‘Prime Age’ data, which include more fine-grained information than the German PUF and additional cases from an oversample of East German respondents (Solga and Heisig Citation2015).
4. We exclude Australia and the Philippines because they do not provide public-use files, Cyprus because of a very high share of literacy-related non-respondents (OECD Citation2013a), and Russia because of concerns about data quality. Estonia, Israel, Lithuania, Singapore, Slovakia, and Slovenia were dropped because our source for the tracking and vocational orientation measures (Brunello and Checchi Citation2007) provides no values for the cohorts we study.
5. For the few countries for which the PIAAC public-use files provide age only in terms of five-year groups, we used the midpoints of the age categories.
6. The variance components give some cause for concern (e.g. the spike in the intercept variance at the country-cohort level and the concomitant drop in the intercept variance at the country level in Model 8). These issues appear to stem from the fact that there is very little variation in the parental education slope at the country-cohort level. Reassuringly, the coefficients of interest (in particular, the cross-level interactions between the education system measures and parental education) are very similar when we drop the random slope on parental education at the country-cohort level (available upon request). We prefer to present results based on models that include the random slope at the country-cohort level because these tend to be slightly more conservative (larger standard errors).
7. The standardised tracking measure ranges from −1.6 to 1.9, so the increase in the high-low gap per unit (i.e. standard deviation) increase in the tracking measure has to be multiplied by 3.5 to obtain the predicted difference in the gap between the earliest and latest tracking countries, and 3.5 * .34 ≈ 1.2.
8. Using the natural logarithm of numeracy as the dependent variable, as done by Brunello and Checchi (Citation2007), yields qualitatively similar results (available upon request).
9. The main effect of formal AET participation is surprisingly large and negative, suggesting that numeracy skills tend to be lower in countries with higher formal AET participation. Robustness checks presented in Section F of the Online Appendix (see Figure F4) indicate that a good portion of this counterintuitive result is attributable to an influential country case: Chile.
References
- Bates, D., M. Maechler, B. Bolker, and S. Walker. 2017. Lme4: Linear Mixed-Effects Models Using Eigen and S4. R Package Version 1.1-15. https://CRAN.R-project.org/package=lme4
- Bernardi, F., and G. Ballarino. 2014. “Participation, Equality of Opportunity and Returns to Tertiary Education in Contemporary Europe.” European Societies 16 (3): 422–442. doi:10.1080/14616696.2012.750729.
- Bills, D. B. 2003. “Credentials, Signals, and Screens.” Review of Educational Research 73 (4): 441–469. doi:10.3102/00346543073004441.
- Bills, D. B. 2016. “Congested Credentials: The Material and Positional Economies of Schooling.” Research in Social Stratification and Mobility 43: 65–70. doi:10.1016/j.rssm.2016.03.002.
- Bol, T. 2015. “Has Education Become More Positional?” Acta Sociologica 58 (2): 105–120. doi:10.1177/0001699315570918.
- Bol, T., and H. G. Van de Werfhorst. 2016. “Measuring Educational Institutional Diversity: Tracking, Vocational Orientation and Standardisation.” In Education Systems and Inequalities. International Comparisons, edited by A. Hadjar and C. Gross, 73–94. Bristol: Policy Press.
- Boudard, E., and K. Rubenson. 2003. “Revisiting Major Determinants of Participation in Adult Education with a Direct Measure of Literacy Skills.” International Journal of Educational Research 39: 265–28. doi:10.1016/j.ijer.2004.04.007.
- Breen, R., and J. H. Goldthorpe. 1997. “Explaining Educational Differentials.” Rationality and Society 9: 275–305. doi:10.1177/104346397009003002.
- Breen, R., R. Luijkx, W. Müller, and R. Pollak. 2009. “Nonpersistent Inequality in Educational Attainment.” American Journal of Sociology 114: 1475–1521. doi:10.1086/595951.
- Brunello, G., and D. Checchi. 2007. “Does School Tracking Affect Equality of Opportunity?” Economic Policy 22 (52): 782–861. doi:10.1111/j.1468-0327.2007.00189.x.
- Bukodi, E., and J. H. Goldthorpe. 2016. “Educational Attainment – Relative or Absolute – As a Mediator of Intergenerational Class Mobility in Britain.” Research in Social Stratification and Mobility 43: 5–15. doi:10.1016/j.rssm.2015.01.003.
- Cedefop. 2015. “Job-Related Adult Learning and Continuing Vocational Training in Europe.” Cedefop research paper 48. Luxembourg.
- Checchi, D., and H. G. van de Werfhorst. 2018. “Policies, Skills and Earnings: How Educational Inequality Affects Earnings Inequality.” Socio-Economic Review 16: 137–160. doi:10.1093/ser/mwx008.
- Cincinnato, S., B. De Wever, H. Van Keer, and M. Valcke. 2016. “The Influence of Social Background on Participation in Adult Education.” Adult Education Quarterly 66 (2): 143–168. doi:10.1177/0741713615626714.
- Di Stasio, V., T. Bol, and H. G. van de Werfhorst. 2016. “What Makes Education Positional? Institutions, Overeducation and the Competition for Jobs.” Research in Social Stratification and Mobility 43: 53–63. doi:10.1016/j.rssm.2015.09.005.
- Elff, M., J. P. Heisig, M. Schaeffer, and S. Shikano. Forthcoming. “Multilevel Analysis with Few Clusters: Improving Likelihood-based Methods to Provide Unbiased Estimates and Accurate Inference.” British Journal of Political Science.
- Erikson, R., and J. O. Jonsson. (eds). 1996. Explaining Class Inequality in Education: The Swedish Test Case. In Can Education Be Equalized?, 1–63. Boulder: Westview Press
- Gesthuizen, M., H. Solga, and K. Ralf. 2011. “Context Matters: Economic Marginalisation of Low-Educated Workers in Cross-National Perspective.” European Sociological Review 27: 264–280. doi:10.1093/esr/jcq006.
- Hanushek, E. A., G. Schwerdt, S. Wiederhold, and L. Woessmann. 2015. “Returns to Skills around The World: Evidence from Piaac.” European Economic Review 73: 103–130. doi:10.1016/j.euroecorev.2014.10.006.
- Heckman, J. J., and Y. Rubinstein. 2001. “The Importance of Noncognitive Skills.” American Economic Review 91: 145–149. doi:10.1257/aer.91.2.145.
- Heisig, J. P., and H. Solga. 2015. “Secondary Education Systems and the General Skills of Less- and Intermediate-educated Adults.” Sociology of Education 88: 202–225. doi:10.1177/0038040715588603.
- Heisig, J. P., and H. Solga. 2017. “How Returns to Skills Depend on Formal Qualifications: Evidence from PIAAC.” OECD Education Working Papers, No. 163. Paris: OECD Publishing.
- Heisig, J. P., and M. Schaeffer. 2019. “Why You Should Always Include a Random Slope for the Lower-Level Variable Involved in a Cross-Level Interaction.” European Sociological Review 35: 258–279. doi:10.1093/esr/jcy053.
- Hillmert, S., and M. Jacob. 2005. “Zweite Chance Im Schulsystem? Zur Sozialen Selektivität Bei ‚späteren’ Bildungsentscheidungen.” In Institutionalisierte Ungleichheiten, edited by P. A. Berger and H. Kahlert, 155–176. Weinheim: Juventa.
- Hirsch, F. 1978. Social Limits to Growth. Cambridge: Harvard University Press.
- Horn, D. 2009. “Age of Selection Counts: A Cross-country Analysis of Educational Institutions.” Educational Research and Evaluation 15: 343–366. doi:10.1080/13803610903087011.
- Kuznetsova, A., P. B. Brockhoff, and H. B. Rune. 2017. “lmerTest: Tests in Linear Mixed Effects Models.” R package, version 2.0-36.
- Little, R. J. A., and D. B. Rubin. 2002. Statistical Analysis with Missing Data. Hoboken, NJ: Wiley.
- Marks, G. N. 2005. “Cross-national Differences and Accounting for Social Class Inequalities in Education.” International Sociology 20 (4): 483–505. doi:10.1177/0268580905058328.
- Mayer, K. U., W. Müller, and R. Pollak. 2007. “Germany: Institutional Change and Inequalities of Access in Higher Education.” In Stratification in Higher Education, edited by Y. Shavit, R. Arum, and A. Gamoran, 240–265. Stanford, CA: Stanford University Press.
- Müller, W., and M. Jacob. 2008. “Qualifications and the Returns to Training across the Life Course.” In Skill Formation, edited by K. U. Mayer and H. Solga, 126–172. Cambridge: Cambridge University Press.
- OECD. 2013a. OECD Skills Outlook 2013. Paris: OECD.
- OECD. 2013b. Technical Report of the Survey of Adult Skills (PIAAC). Paris: OECD.
- OECD. 2016. Skills Matter. Further Results from the Survey of Adult Skills. Paris: OECD.
- Park, H., and P. Kyei. 2011. “Literacy Gaps by Educational Attainment.” Social Forces 89: 879–904. doi:10.1093/sf/89.3.879.
- Pfeffer, F. T. 2015. “Equality and Quality in Education.” Social Science Research 51: 350–368. doi:10.1016/j.ssresearch.2014.09.004.
- R Core Team. 2017. R: A Language and Environment for Statistical Computing (version 3.4.3). Vienna: R Foundation for Statistical Computing.
- Rotman, A., Y. Shavit, and M. Shalev. 2016. “Nominal and Positional Perspectives on Educational Stratification in Israel.” Research in Social Stratification and Mobility 43: 17–24. doi:10.1016/j.rssm.2015.06.001.
- Schmidt-Catran, A. W., and M. Fairbrother. 2016. “The Random Effects in Multilevel Models.” European Sociological Review 32: 23–38. doi:10.1093/esr/jcv090.
- Shavit, Y., and H. Park. 2016. “Introduction to the Special Issue: Education as a Positional Good.” Research in Social Stratification and Mobility 43: 1–3. doi:10.1016/j.rssm.2016.03.003.
- Shavit, Y., and W. Müller. 2000. “Vocational Secondary Education: Where Diversion and Where Safety Net?” European Societies 2: 29–50. doi:10.1080/146166900360710.
- Solga, H. 2014. “Education, Economic Inequality, and the Promises of the Social Investment State.” Socio-Economic Review 12: 269–297. doi:10.1093/ser/mwu014.
- Solga, H., and J. P. Heisig 2015. “Programme for the International Assessment of Adult Competencies (PIAAC), Germany – Prime Age (2012).” GESIS Data Archive, Cologne, Germany. Study number ZA5951, version 1.1.0.
- Sørensen, A. B. 1979. “A Model and A Metric for the Analysis of the Intra-generational Status Attainment Process.” American Journal of Sociology 85: 361–384. doi:10.1086/227014.
- Soskice, D. 1994. “Reconciling Markets and Institutions: The German Apprenticeship System.” In Training and the Private Sector, edited by L. M. Lynch, 25–60. Chicago, IL: University of Chicago Press.
- Tam, T. 2016. “Academic Achievement as Status Competition: Intergenerational Transmission of Positional Advantage among Taiwanese and American Students.” Chinese Journal of Sociology 2 (2): 171–193. doi:10.1177/2057150X16638600.
- Thurow, L. C. 1975. Generating Inequality. London: Macmillan.
- Ultee, W. C. 1980. “Is Education a Positional Good?” Netherland’s Journal of Sociology 16: 135–153.
- van de Werfhorst, H. G., and J. B. Mijs. 2010. “Achievement Inequality and the Institutional Structure of Educational Systems.” Annual Review of Sociology 36: 407–428.