
ABSTRACT
Tracking change in rural communities over time is difficult. It is also important. If we are to understand what forms of peasant poverty persist, or how and in what ways peasant communities can become richer, then we require longitudinal studies. These are however few. It is difficult to access the data required for them. I present one case using assets to track growing prosperity. I examine why exclusions in other data make tracking assets important, and the limitations of longitudinal research for capturing contemporary conditions.
Introduction
The problem of persistent peasant poverty has been a leitmotif of peasant studies for decades. The question typically has two dimensions – why are peasants poor, and why do they persist in their poverty? Understanding these issues is fundamental to understanding the operation of rural capitalism and accumulation, and the welfare of billions of people.
A number of recent contributions to debates about peasant poverty generally, and to Tanzanian rural poverty in particular, are significant for the data sources on which they have based their arguments. They have relied upon changes in the number of people below poverty lines as determined by records of expenditure. This is a problem because these data necessarily exclude forms of peasant prosperity (specifically investment in productive assets) which can be particularly important in local measures of wealth and poverty.
I argue in this paper that assets matter to rural smallholders and that investment in assets is systematically and deliberately excluded from calculations of poverty lines based on consumption data. These arguments should not surprise readers of this journal, however, there is a risk that they have been overlooked in recent debates. These observations are based on an unusual longitudinal dataset that follows the fortunes of rural families over a 16 year period. This shows that there has been change to infrastructure and commodity markets which has brought improvements for specific rural families. Yet I then show that village society has changed substantially such that only a minority of villagers are now in a position to benefit from the new changes to the economy.
Assets, economic transformation and persistent peasant poverty
The central premise of the recent edited collection Peasant poverty in the twenty-first century (Boltvinik and Mann Citation2016b) is that there is no doubt that peasant poverty has persisted, if not increased, in recent decades. The editors establish the basic facts of peasant poverty succinctly. They used global poverty line data (derived from expenditure), and well known critiques of them (Ravallion Citation2010; Reddy and Pogge Citation2010), to argue that current poverty lines are set too low. The World Bank’s poverty line ($1.90 per day) shows that poverty has fallen. But under the more realistic measures of $2.50 per day the proportion of people in that category increased by 13 percentage points between 1980 and 2005 (Boltvinik and Mann Citation2016a).
A similar approach is found in Mashindano and colleagues’ investigation of persistent rural poverty in Tanzania (Mashindano et al. Citation2013). They found that the number of people living beneath the low poverty lines set by the World Bank and Tanzanian government (again using consumption data) had not declined despite years of economic growth. They concluded that this growth, rooted in the mining, infrastructure and tourist sectors, was simply not benefiting rural areas (Nord et al. Citation2009; Robinson, Gaertner, and Papageorgiou Citation2011; Adam, Collier, and Ndulu Citation2017). The lead authors concluded that
[i]n Tanzania the critical question is why has rapid growth in Tanzania not been accompanied by a corresponding fall in poverty? Why have the numbers of impoverished risen? (Mashindano and Shepherd Citation2013, 3)
A brief aside is necessary here on the techniques used in constructing poverty lines from consumption data. The poverty lines we refer to are drawn from Household Budget Surveys. These data are cleaned of outliers and used to calculate the average daily per capita expenditure. It is from such statistics that we derive the proportion of the population who spend less than $1.90, or $2.50, per day.
But these calculations deliberately exclude all production costs, that is the costs entailed in creating any income. If a farmer is managing a 100 acre farm, then the survey will not try to capture her costs of ploughing, planting, weeding or harvesting it. It captures use of the income resulting from such activity. The survey would also similarly not record any purchase of new land, or ploughs or oxen, or seeds or labour for smaller farmers. These too are production costs.
The instructions with respect to production costs are unambiguous. The World Bank’s guidance states that:
Care must be taken not to interpret spending on inputs into household production, including outlays for tools or other inputs like fertilizer, water, or seed in agricultural production, as spending for consumption or as income. If we included spending on in-puts in the consumption or income aggregate, we would overstate the actual welfare levels achieved by households. (Coudouel, Hentschel, and Wodon Citation2002: 32)
Investment in productive assets is not the only thing that would be missed. As we have pointed out elsewhere (Brockington et al. Citation2018), expensive purchases are excluded because they are outliers, and skew the data. Indeed in the published COICOP codes there is no entry for house construction. So if a family invests in building a new house, or putting a new roof on it, then that cannot be captured in this survey.Footnote2
This means therefore that a frugal family, which was restricting day-to-day expenditure in order to save for assets, would appear poor, even if it was also purchasing land, oxen, ploughs and diverse inputs.Footnote3 It is therefore problematic to use Tanzanian poverty line data to track poverty dynamics in rural areas because it cannot see some changes in rural prosperity that are important for rural people.
Does this matter? I believe it does. As we have argued in the companion papers, and elsewhere (Östberg et al. Citation2018; Brockington et al. Citation2019; Howland, Noe, and Brockington Citation2019) productive assets are crucial to local definitions of wealth and poverty. In Tanzania rural wealth and poverty are measured in terms of lands worked, livestock owned and used, houses built (and these days children educated). There is a rich literature, discussed in more depth in the companion papers, which shows that assets are crucial for understanding poverty traps, investment decisions and long term poverty dynamics (Carter and Barrett Citation2006; Scott Citation2010; Liverpool-Tasiea and Winter-Nelson Citation2011; Carter and Lybbert Citation2012; Naschold Citation2012; Barrett and Carter Citation2013).
As I will show in this paper, investment in assets is central to peasant strategies of self-improvement. The seasonal income in many peasant households makes asset purchase sensible, lest it be stolen or frittered away on ephemeral needs. As one focus group member put it:
We get money seasonally. Some people … after the harvest they buy a TV, or solar panels, or all manner of things and they have a good life. But [later] although she’s got her television, if she … needs 50,000 shillings she’ll have to wait 5 months. In July if you want to borrow a million shillings she will give it, but go to them in November and ask to borrow 200,000 … and they will tell you I have nothing, I have bought a TV, I’ve bought a plot, I’ve bought bricks. (Focus Group Kilwa 22 February 2017; 50,000 shillings is about $20)
However given that such investments are so important in rural eyes, and given their importance to many families’ strategies to become richer, we need debates about rural poverty dynamics to consider these changes. This is certainly apparent in some debates, including the pages of this journal (Assies Citation2009; Garikipati Citation2009; Singh Citation2009; Ribot Citation2014). But discussion of assets is not prominent in recent debates about the diverse forms of dispossession, primitive accumulation, rural differentiation and growing inequality afflicting many African countries following economic growth strategies that privilege overseas investment (Hall Citation2011; Scoones et al. Citation2013; Wolford et al. Citation2013; Ansoms and Hilhorst Citation2014; Greco Citation2015).
The critics of these processes are unambiguous. Just over 30 years ago Shivji predicted that the consequences of economic transformation and capital investment in Tanzania would include concentration of prime agricultural land into the hands of foreign corporations, rapid development of a landless rural class, massive migration to urban areas, and high inequality with ‘sprawling cities full of luxury consumer goods’ with ‘millions of marginalised unemployed masses on the verge of starvation’ (Shivji Citation1987, 128; cited in Shivji Citation2017, 5–6.). Looking back at the prediction now, he thinks he was too close to the mark ‘[o]ne wishes … one would have proved wrong!’ (Shivji Citation2017, 6). He feels these predictions have ‘come close’ to fulfilment in Tanzania and are uncannily close to reality for Africa as a whole. Elsewhere he speaks of the peasantry being ‘flushed’ out of land, and of processes of primitive accumulation driving marginalisation (Wuyts Citation2008, 1088).
Shivji’s arguments emphasise that it is possible that rural poverty may be enhanced because of the growth strategies being pursued. The problems of land alienation are marked in Tanzania, where green grabs for wildlife conservation (Fairhead, Leach, and Scoones Citation2012) and REDD+ (Benjaminsen and Bryceson Citation2012; Svarstad and Benjaminsen Citation2017) are combining with mining concessions and agricultural investment corridors to render large swathes of the country inhospitable to rural residents (Bluwstein et al. Citation2018). The Tanzanian government’s boast that it has surveyed nearly 400 villages to identify 900,000 hectares that can be alienated to foreign investors (Hon Minister for Lands Citation2012) alarmed observers.
In sharp contrast Jayne and colleagues have recently described a general economic transformation of numerous (but not all) poor African countries that is built-in increased rural productivity and associated prosperity (Jayne, Chamberlin, and Benfica Citation2018). Alwyn Young has suggested that trajectories in numerous assets give grounds to speak of an ‘African growth miracle’ (Young Citation2012).Footnote4 In Tanzania specifically the economy has averaged 7% annual growth (Nord et al. Citation2009, 1). That growth has been accompanied by macro-economic stability and increased public spending (Robinson, Gaertner, and Papageorgiou Citation2011). It is celebrated as part of a rising continent.
It is in this context of rapidly changing rural economies, apparent economic growth and disputed consequences of this growth that I call for more attention to rural people’s assets. Exploring this aspect of peasant livelihoods adds flesh to Henry Bernstein’s objection to Boltvinik’s work on persistent peasant poverty. Bernstein argued that:
there is little in the way of empirical illustration, especially an exploration of patterns and dynamics of rural class relations and poverty and the challenges of investigating them … the assumption of generalised persistent/’permanent’ rural poverty, … gives no analytical purchase on such questions as: why are some farmers/rural people not poor? Which and why? What are the trends in rural poverty? (Bernstein Citation2016, 173, emphasis in the original)
Exploring asset dynamics over time in Tanzania
Tracing change in assets in rural Tanzania is difficult. It is possible to conduct separate surveys of the same place over different time periods. But this suffers from the obvious disadvantage that we do not know whether or not we are surveying the same people. A village may appear richer simply because the poorer residents have moved away, or even died, because of their poverty.
To speak about change with authority requires panel or longitudinal research. This entails visiting the same families and communities over a sustained period of time and seeing what has changed for specific individuals and domestic units (Baulch and Hoddinott Citation2000; Baulch Citation2011a, Citation2011b; Vandergeest and Rigg Citation2012).Footnote5
However, the central difficulty in Tanzania, and many African countries, is that there are simply hardly any panel data, or longitudinal datasets. The Living Standards Measurement Survey of Tanzania does provide a panel of several thousand families. But it is only nationally representative, it does not follow individual places in sufficient depth to examine the detail of particular contexts. More importantly it only began in 2008 and cannot provide insights into how rural fortunes changed during the long period of economic growth that began in the early 1990s. The Kageera study (of north-east Tanzania) does cover that period, and with authority, covering several thousand homes that were visited three times between the early 1990s and 2004 (De Weerdt Citation2010; Beegle, De Weerdt, and Dercon Citation2011). However it is only available for that one region.
Given this dearth in data we need more studies exploring change over time in rural Tanzania. It is this gap that the present paper seeks to fill. It is part of a broader research project which has tried systematically to co-ordinate the development of longitudinal research into livelihood change and asset dynamics across the country (Brockington and Noe CitationForthcoming; Brockington Citation2019). The central technique here is to identify communities that were surveyed by researchers in the past. We then revisit these communities, and the same families that were originally surveyed, to explore how their lives have changed.
The methods of this project combine quantitative surveys with qualitative interviews and focus groups. Surveys uses a mixture of standard questions, across all study sites, and others that were specific to researchers’ interests. More qualitative interviews then examine how families fortunes have changed, and reflect on what has caused any changes found between the present visit and the original survey. In particular we consider changes to the constitution and nature of the domestic unit we were re-visiting. We discuss how changes experienced have might have been distributed within them. This same question we discuss at village-level focus groups (men and women separately), which examine the history of change in the village over time, and how the understanding and meaning of wealth has altered. We also conduct participatory wealth rankings of the village in order to compare our re-visited sample to the profile of the contemporary village population. Finally, after we have analysed the findings of the first visit, we return to the village to discuss what we found and ask members of the community to reflect on the findings.
In the research reported here, I re-visited Mtowisa, in Rukwa region. Mtowisa is found in the Rift Valley, close to the regional capital of Sumbawanga. I had lived there for a year in 1999–2000 as part of a post-doctoral research fellowship in which I studied the consequences of the immigration of wealthy Sukuma agro-pastoralists, who brought with them large herds, new crops and farming methods and who had been integrating into the area for over 20 years (Brockington Citation2001, Citation2008, Citation2006).
I made two return trips to Mtowisa, in August 2016 and April 2018. The first was to conduct the resurvey, the second to follow up and present findings to villagers. In the course of these trips, I revisited with assistants and 64 families, and interviewed local shopkeepers and district government officials. I also interviewed businessmen who were based in Dar es Salaam and who purchased crops in Rukwa. I travelled to neighbouring villages and fishing camps with friends, visited new irrigation schemes, held three village meetings (for women and men in 2016 and a collective feedback meeting in 2018) as well as meetings with local leaders. I now remain in touch by phone and WhatsApp with friends who live there.
This work produced a survey that is more robust than most. Normally, longitudinal re-visits have no choice as to which families they include in their surveys. They have to go back to the sample originally selected in the first round of the survey. A typical sample size of many surveys is only 30 families (see for example Ellis and Mdoe Citation2003; Andersson-Djurfeldt, Dzanku, and Isinika Citation2018). Being confined to the same 30 families can introduce problems of attrition (Dercon and Shapiro Citation2007; Baulch Citation2011b). It can be necessary to abandon re-visits because we cannot find enough of the original families to merit continuing with the enterprise.
However, the great advantage of the original survey that I conducted in Mtowisa is that it was not a sample. I surveyed the entire village, covering just over 400 families.Footnote6 To conduct the revisit I then sampled families from that original survey, stratifying the population into groups according to key aspects of wealth relevant in 2000. This made it easier to deal with the problem of attrition because, if I was unable to visit a particular family, I could then re-select a different representative of that group from the original population. The nature and targets for each group, and the actual numbers achieved, are shown in .
Table 1. Sampling of different social groups.
Since I was able to replace missing families the problem of attrition recedes, but note the patterns in it. First there are older families who’s heads had died, and had dispersed by the time of the revisit (). A second group were those who had been younger, and who had moved away by the time of the revisit. These two groups had opposite tendencies with respect to ownership of herds and ploughs, with the younger groups tending to be poorer, and the older groups richer.
Table 2. Characteristics of surveyed, deceased, moved and unsurveyed families from 2000 data.
A key assumption of our methods, discussed in a companion paper which reviews these methods, is that domestic units were sufficiently stable to make a re-survey of assets owned by families worthwhile (Brockington et al. Citation2019). This proved to be the case here as there were only four incidences of divorce. The sample however contains a larger than normal group of domestic units headed by single women (18 out of 64 or 28%), whereas only 14% had this characteristic in 2000. This is because I interviewed a relatively large number of widows whose husbands had died; I also interviewed 3 widowers.
There is one a crucial difference between the sample taken in 2016 and the survey of 2000: all the domestic units heads I re-visited are now 16 years older. None was under 35 years old. The findings that I report below are therefore not representative of younger families in the village. To control for this difference all the comparisons of asset ownership reported below compare domestic unit heads who are over 35 now, with domestic unit heads who were over 35 in 2000. If I simply compared the sample of 2016 with the entire village in 2000 I would be comparing the condition of an older sample in 2016, with that of a much younger population from 2000. The latter could appear poorer because if its relative youth, the former wealthier due its seniority (as implies). This would mean I would be comparing a population that is more likely to be poor because of its stage in the domestic cycle, with one that is more likely to be rich for the same reason. This would lead to a false impression of improving prosperity.
Changes from 2000 to 2016
Initial poverty and subsequent transformation
If ever there was an archetypal place to examine persistent peasant poverty, then it would be Mtowisa. The village is not far, as the crow flies, from the regional capital of Sumbawanga, which is barely 15 km away. But the flying crow has an easier route than humans, as it can soar over the 1200 m escarpment that separates the town from the village. In 2000, residents had to walk between the two, headloading baskets of fish or fruit for sale. The road between them was poor, and in the wet season would be cut off by the rivers draining the Fipa plateau. This was a village that felt far from anywhere.
Its residents felt they were poor. It was expensive to transport crops and so prices were low. Productivity was also low, with most people being only small-scale farmers, cultivating 2 acres or so. Despite abundant unused lands, farming activity increased only marginally with the age of the domestic unit head, or with family size. It was difficult to sell surplus and some feared ‘bad jealousy’ i.e. retribution from neighbours that success might occasion (cf. Foster Citation1965). Visible signs of wealth were few. Most lived in simple grass-roofed houses. Only 20% of families owned cattle and then but small herds; there were few ploughs.
I must not paint a picture of abject poverty. Just over half of resident adult men (54%) had owned cattle at some point in their lifetimes. The place was blessed by fertile soils, plentiful lands, reasonably reliable rains, a lake full of fish, grasslands with low tick burdens, and a game reserve that was not well guarded on the other side of the lake. Mtowisa may have been hard to get to from the regional capital, but it was still only a (long) day’s walk there and back, and it was possible to headload up a basket of dried fish or chickens and earn enough in a day to pay the various government taxes required at the time for a whole year. Some farmers cultivated rice as a cash crop when the rivers flooded in the wet season, and one or two had constructed their own irrigation ditches to channel river water to their farms more reliably. Moreover, there was a particularly wealthy group of farmers in the region, Sukuma immigrants from further north, who managed huge herds of cattle (numbering into the thousands) and large areas of land (Brockington Citation2001, Citation2008, Citation2006). Their arrival had brought changes to farming practices (encouraging ploughing) as well as changes to the crops grown: maize had recently replaced finger millet as the main staple, sunflowers and rice were being grown more frequently. It had also brought tensions and greater risks for smaller farmers as their farms were vulnerable to livestock damage for which there was rarely compensation.
But the main point remains. Most people were poor. They did not have the means to cultivate much land, and could not earn good prices for their produce.Footnote7 Many people remained orientated to subsistence rather than commercial production.
What happened to such poverty in the 16 years between my visits? This was a period of strong economic growth nationally, and, as we have seen, the benefits of that growth are thought not to have filtered down to rural areas. Does Mtowisa exemplify these trends or defy them?
At first sight the changes to the village appeared remarkable. The village centre was transformed. I had known it as a sleepy place with a few shops and a small hospital, where cars came infrequently (barely once a month), and motorbikes were rare. Now there were numerous shops, nearly 20 motorbike taxis, gas and electric welding (the latter run on a powerful generator), several phone shops and a well-equipped hardware store. The hospital had an operating theatre and there were solar powered lights.
The village was much less isolated. There is a large phone tower in the village (since 2008). The road between Mbeya and Sumbawanga had just been metalled (completed in 2014); there was also now an improved road between Sumbawanga and Mtowisa with good bridges across the rivers that could be used all year round (this was completed in 2007). There was a regular bus service in the dry season along the length of the valley, and a daily bus service to Sumbawanga (which had started in 2013) as well as smaller hiaces throughout the day (since 2015).
There was an abundance of metal roofed homes, and many single rooms were rented. Numerous pigs roamed the streets or were kept in small compounds near people’s houses (these had been unusual in 2000). The small irrigation furrows I had encountered had expanded in number. In the dry season they were now used (since about 2012) to cultivate tomatoes, cabbage and onions and there were around 10 petrol powered pumps which withdrew river water for nearby farms.
But these first impressions can be misleading. We cannot be sure if the people enjoying these trappings of wealth were poor or not without a more detailed revisit. It is not reasonable to assume that the wealth that was so conspicuous in the town centres is shared by all residents. This is precisely the sort of road-based bias against which Robert Chambers (Citation1981) warned so many years ago. 20 motorbike taxis would not indicate that Mtowisa’s peasants have become richer. It just indicates that 20 people now own (or rent) motorbikes. Does this appearance of wealth reflect real change for the village’s residents?
The sesame seed cash injection
The brief answer to that question is a resounding ‘yes’, but only for some. The survey data shows substantial improvements in productive assets over the sixteen year period. The research into asset history and acquisition shows that this prosperity has been driven by changing farming practices. Residents are selling more cash crops, specifically sunflower seeds and sesame, with the latter providing the most substantial change.
The evidence for this change is as follows. First, with respect to key measures of herd and plough ownership the sample visited is wealthier than it was in the past and compared to the group of similar aged domestic unit heads in 2000 (). Oxen ownership has increased by half (and if we include oxen borrowed from wealthy patrons it doubles to 41%). Pig ownership has increased dramatically, and ownership of ploughs has more than doubled.
Table 3. Key assets, 2000 and 2016.
Second, with respect to farming activity, people are simply farming more. Farming activity increases more with family size than it did previously (). All families are farming more cash crops, with proportionally less maize grown than before ().
Figure 1. Family size and farming activity 2000 and 2016.
Notes: Comparing farm size by family size category shows a statistically significant difference χ2 = 24.34, df = 8, p = 0.005. Source: Author’s data.
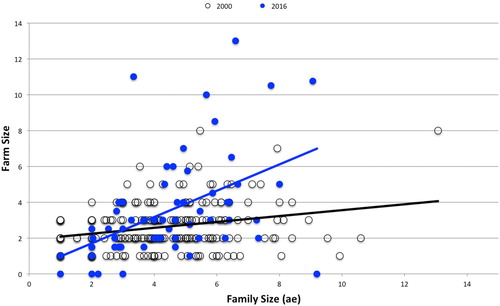
Table 4. Land put to different crops in 2000 and 2016 (acres).
Third, housing quality has improved, particularly with the spread of metal roofing.Footnote8 This may not just reflect a preference for metal roofing, or greater ability to buy it. The increased cattle numbers in the region, combined with loss of grassland over several decades to forest regrowth, and the increase in farmed area means that good thatching grass (which lasts 5–10 years) is hard to get. People instead are reliant on rice straw (which lasts one year) or lake reeds (lasting two). Moreover thatched houses are more likely to catch fire and they harbour vermin. They are also, perforce, smaller than metal roofed houses, to reduce the effort of collecting the thatch required for large houses. Houses with metal roofs can be subdivided into a family home and rentable rooms.Footnote9 Finally a metal roof is a status symbol, a visible sign of prosperity.
Asset histories repeatedly brought out the fact that people had been able to invest in homes and farming equipment because of better returns on crops, particularly since 2010 (). The main reason for that growth in investment, as shows, is the increased sales of sesame and sunflower seed. Sesame appeared in small quantities in 2007 and 2008, but takes off significantly from 2010 onwards (). Transfers and support from relatives was only rarely mentioned by respondents (by just two) as being a source of asset investment.
Figure 2. Sources of investment in assets.
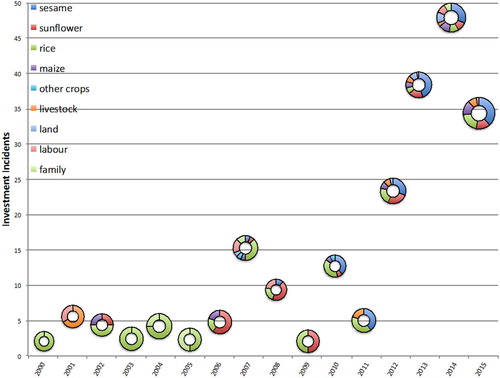
Table 5. Net asset investment.
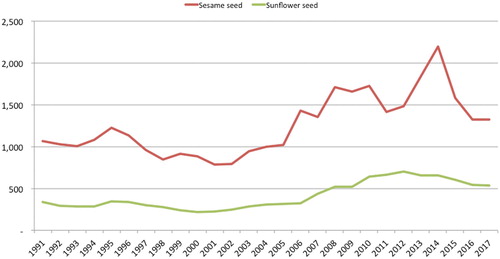
These price rises were driven by international demand and global rises in these commodity prices, not by changes in the marketing system (). Other studies have shown that sesame seed marketing arrangements in Lindi and Mtwara region, which use respectively the District Stakeholders’ Price Setting Forum and the Warehouse Receipt System, have been instrumental in fostering demand (Mashindano and Kihenzile Citation2013). However, in the case of Rukwa, there was no organisation of the marketing arrangements by government officials. There has been no organisation of producers into Agricultural Marketing Co-operatives (they were first established in 2018). There was merely a willing buyer in the form of a major agricultural exporter (the Export Trading Company).
Figure 3. Global producer prices for sesame and sunflower (USD/tonne).
Source: FAOSTAT accessed 14th March 2019.
I was able to interview the pioneer farmer of modern varieties of sesame in Mtowisa. He described a situation of gradual prices rises in the 2000s with demand kicking off in 2009 when many sesame seed buyers appeared in the village. From that point on prices sky-rocketed reaching as much as 2000/= (around 1 USD) per kilo. This meant that farmers were able to yield fantastic returns, of, I was told, between 250,000/= and 300,000/= per sack.Footnote10 This is more than enough for a roll of metal roofing, and only two rolls would complete a standard sized house.
One story illustrates well the joy and surprise that these returns caused to farmers. I was told that one farmer (we will call him Darius), who I met in the survey work and who had not been particularly industrious or wealthy in 2000, went up to Sumbawanga to sell his sesame in 2011. This was a collective enterprise, with many farmers loading their harvest onto the lorry of the local shop owner to take it to the weighing depot. On receiving his payment for two sacks of sesame (500,000/=) Darius was simply left in shock.Footnote11 He sat down in a corner of the weighing room, still full of the hustle and bustle of heavy sacks being moved, weighed and paid for, because he had never in his life expected to have so much money. His friends had to guide him to a guest house where he could safely spend the night. The next day he had recovered sufficiently to buy metal sheets for a new house. He built it that year and extended it the year after following further sales.
It is because of repeated stories like Darius’ that the appearance of Mtowisa, and the daily lives of so many of its residents have been so thoroughly changed. Higher sesame seed prices have given a substantial cash injection to many people’s livelihoods. Moreover, regional production data suggest that this was not merely a local phenomenon. This crop was scarcely grown when I was working there in 1999-2000. Yet, if the regional production data are to be believed then, in the last four years, it has injected more than US $20 million into the local economy ().
Table 6. Sesame seed sales in Rukwa region.
Patterns in improvement
Altogether 66% of the sample had experienced an increase in assets in some way over the previous 16 years – but what subtler changes does this bald statistic conceal? There are two general trends to note. First, the improvement in assets is general across most wealth groups, but richer, more productive families have tended to be able to benefit from the cash crop returns more than families who were poorer and farming less in 2000.
The evidence for that is visible in the slightly different performance of the different categories of farmers I identified in 2000. Those who did not engage in kibarua work (casual labour), or who only performed kibarua work for other people, are least likely to have improved their asset base. Those with more assets and more engagement in kiabrua work (as sellers or buyers) are most likely to have improved their assets ().Footnote12 These differences are only tendencies, and do not denote contours of disadvantage. At least 50% of the members of every group improved their assets.
Table 7. Asset growth performance by 2000 wealth group.
The second trend is that female headed domestic units and smaller families tended to improve their asset base less than dual-headed larger units. This trend reflects changes in the lifecycle of domestic units where families with fewer dependents farm less, where widows also farm less, and where both tend to support fewer dependents.
In addition, across the sample, in the midst of all this prosperity there were repeated, if infrequent, incidents of continued poverty or impoverishment. Some families seem to have been unable to benefit from the changes transforming their neighbours. My friends and informants explained this as an inability to plan affairs (kupanga maisha) such that their expenditure matched their means. Conversely, those who had been able to improve their assets spoke also of restricting expenditure (bana matumizi, literally clamp down on uses) to do so.
Others, although they had gained in assets, had lost in other ways, suffering from divorce or death of partners, or simply the travails of old age, such that life now was decidedly unhappier. A couple of families had lost assets with which they began (land and/or livestock) because they had been forced to sell because of various hardships. Building an asset base requires good luck as well as wise decision making. There are some incidents of altering asset portfolios. This applied to older families who sold land, or subdivided their house plots, to fund house-building.
But if the general perspective across domestic units has been positive, what about within them? What changes within families does the rising prosperity documented above conceal? Within domestic units the changes experienced because of the investment in assets seem to be reasonably well shared by men and women. Fipa society is one where both men and women can own and dispose of land and livestock. Men also take more of a role in child care than other Tanzanian societies. Weeding work loads, I was told (and saw), are equally shared. The move to cash crops did not appear to have increased men’s income, but women’s work.
Women have been disadvantaged, however, by the growing population of the village, and the failure of water supplies to keep pace with people’s needs. Women, not men, collect water, and there were repeated complaints about the time it took. Cooking (also women’s work) now requires charcoal, as there are fewer trees on farms. There were also three cases of female-headed households who had lost access to land through family or neighbour disputes, or because their husbands had died leaving them childless, and therefore with no access to their husband’s family land.
Finally, it bears repeating that assets are but one aspect of prosperity. The families I visited, in the main, had enjoyed a recent cash injection from which they had invested in assets. But there are many other dimensions of poverty that remain untouched by this welcome change. The standards and ease of accessing health and educational services, expenditure, care for the long term sick and elderly, basic measures of dignity and so on are all ignored by this survey. Likewise, changes in nutrition, which are likely in a move from subsistence to more commercial farming, are not mentioned. Our methods and sources do not allow us to make the long term comparisons required to document the changes that have occurred here.
The restrictions of looking at assets are best illustrated by our question ‘has life improved for you now compared to 2000?’ In response some 44% of respondents felt that life was improving, 41% felt that it had gotten worse, and 15% of people felt it was as hard as ever. When 56% of a sample insist that life is worse now, or as bad, as it was 16 years ago, and when life was indeed hard 16 years ago, then that majority is an important finding. Particularly because, when answering that question, even those who felt life had got better usually qualified that by insisting that the improvement was marginal at best.
Growing poverty and inequality
The other crucial difference between the state of the village now and earlier is that there are trends towards class formation and inequality that indicate that the fortunes of new cash crops are not universally enjoyed. The primary evidence for this is that there is now a substantial group of households – around 44% of the village – who are characterised as not having their own lands and working for other people (). In 2000 only 27% of the population were borrowing or renting farms.
Table 8. Wealth groups and their distribution in the study site.
Casual labourers earn relatively low sums. With board and lodging included it can be just 2000/= per day, less than one dollar. Otherwise labourers are paid piece rates, which means that weeding an acre of rice for 50,000 shillings can be 5 days work, or 10 days, depending on the weed load. These are not sums that will make people wealthy quickly.
This large group exists in Mtowisa partly because the village has a relatively large collection of housing stock to rent rooms in. There is often casual work to be had, and the recent boom in sesame seed created a good deal of work. It has attracted immigrants who rent rooms in the new houses sesame seed farmers have built. There are also migrants who are drawn to the fishing industries around Lake Rukwa. Nevertheless, it is plain that the sesame seed boom is not a universally experienced blessing. Those farmers with the land and means to farm it have profited. But it is creating new forms of differentiation. The sesame seed cash injection is concomitant with an incipient process of class formation in the village which has seen the differentiation of families into those who own their own land and those who can subsist by renting out their labour.
Ironically, however, at the same time as inequality appears to be increasing, local tolerance of it also appears to be growing. Focus groups at the feedback meeting in 2018 suggested that the ‘bad jealousy’ that used to hold people back is decreasing. The same was discussed more informally in bars and during casual conversation. Commentators noted that the elders used to have the power to control where and when rain fell, which was advantageous, but that these same elders would curse, and thus kill, people who became too successful. Now both powers are gone. Wealth accumulation that was once controlled by curses, death threats and fears now faces fewer impediments.Footnote13
Conclusion
The changes I have recorded here – both the increased wealth and the attendant rise in inequality – derive in part because this village has become more closely integrated into the global economy. The improved roads and communications infrastructure have seen crop prices rise at the farm gate.
The developments at Mtowisa thus fit with the fifth element of Hall’s typology of forms of land grabbing, that of ‘commercialisation in situ’ (Hall Citation2011). She describes this as small-scale producers being incorporated into commercial value chains The attendant consequence, in the context of a closed land frontier, is a new prevalence of landlessness that is the obverse of the local forms of accumulation that I have documented here. As Hall and colleagues later observed, the important issue for understanding poverty dynamics in such developments is not whether this shows that small or large farms are better but rather ‘how different farming models co-exist and the ways in which poor people can navigate opportunities among them’ (Hall, Scoones, and Tsikata Citation2017, 532). Accordingly as these forms of commercialisation and in situ accumulation spread throughout Tanzania we need to understand how the opportunities and the misfortunes they present are negotiated.
In this instance we must note that the driving forces of change are also fickle. Sesame seed in Rukwa has been hit by a disease which did not respond to treatment and which has made the crop too unreliable to be farmed any more. The crop price fluctuates considerably and there is no government support mechanism to tide farmers over the vicissitudes of global demand. Cash hungry farmers are now turning to more reliable cash crops (sunflowers) as well as irrigated vegetables for their money. The mechanisms which allowed some farmers to grow their asset base have not allowed sustained reduction in poverty.
Notwithstanding the mechanisms, the point is that assets matter if we are to understand local poverty dynamics. They matter both as a means of external observers to record change, and to local determinations of a good life. Understandings of poverty dynamics in peasant populations have to take account of the local definitions and meanings of wealth and the things that peasants themselves count as important. They are not well-served by measures of prosperity which preclude the possibility of counting investment which matters to rural people – which is clearly the case with commonly used consumption-based surveys. These are not well placed to track the ‘mores of consumption and the utilities of wealth’ in Tanzanian contexts.Footnote14
Many of the families with whom I spoke place considerable significance on the major purchases that they will need to make in order to have a good life and provide for their children. They will need to buy a plot (150,000/=), build a good house (300,000–500,000/=), buy land (400,000/= an acre for unirrigated land), and buy oxen (200,000/= a head) and a plough (150,000/=).Footnote15 And most of the revisited families in this sample were taking significant steps in building that asset base. These purchases, so vital in local notions of progress, are not captured in poverty line data.
Or to put this more generally, understanding investment in productive assets and houses will be central to answering three of the four questions of Bernstein’s haiku – ‘Who owns what? Who does what? Who gets what? And, what do they do with it?’ (Bernstein Citation2010, 22). This will require more longitudinal studies which track and explain change in asset portfolios. Doing so will help us to understand what forms of poverty persist amongst whom.
Acknowledgements
The author gratefully acknowledges the support of the DfID ESRC Growth Research Programme (ES/L012413/2) which has funded this research project and of the Research Council of Norway which has supported this work through the Greenmentality project. I am grateful for the support of the ODI and in particular the critical engagement of Steve Wiggins and Louise Shaxson throughout. Many thanks to the anonymous reviewers for their hard work and critical commentary.
Disclosure statement
No potential conflict of interest was reported by the author.
Correction Statement
This article has been republished with minor changes. These changes do not impact the academic content of the article.
Additional information
Funding
Notes on contributors
Dan Brockington
Dan Brockington directs the Sheffield Institute of International Development. He studied for his thesis at University College London with Kathy Homewood and has worked on aspects of natural resource management and livelihood change in East Africa based on long term fieldwork in remote locations. His books include Celebrity Advocacy and International Development, Fortress Conservation and Nature Unbound (with Rosaleen Duffy and Jim Igoe). He has recently published (with Peter Billie Larson) The Anthropology of Conservation NGOs.
Notes
1 COICOP refers to ‘Classification of Individual Codes by Purpose’ for the purposes of recording consumption (see UN Statistics Division Citation2019). A copy of the list of COICOP codes used is in the author’s possession.
2 I must correct here a mistake made in that earlier publication where I stated that investment in assets, such as land or large livestock, might be excluded if the asset was expensive, and so the expenditure would appear as an outlier. They would be excluded, but for the prior reason that any expenditure on such assets would be classified as productive.
3 Investment in agricultural assets is recorded elsewhere in the survey, but these are not assigned COICOP codes and are not included in the indices of family consumption.
4 For critiques of this work see Johnston and Abreu (Citation2016) and our companion paper (Howland, Noe, and Brockington Citation2019).
5 Panels are, strictly speaking, visited relatively frequently, every two to three years. Longitudinal studies entail longer breaks between the research visits.
6 We did not capture, however, the wealthy Sukuma agro-pastoral households who lived out beyond the margins of the village with large cattle herds. This re-study has therefore not been able to track the changing fortunes of the families who were the wealthiest in this area in 1999–2000 and who appeared, anecdotally, to have remained wealthy in 2016. However given the focus of this paper on the impact of economic growth on the rural poor this gap in the survey does not vitiate the findings.
7 As shows it was possible to accumulate livestock, land and other assets, but this required time - and good luck. I had many records of people who would spend a year or more of their youth as herd boys for Sukuma cattle owners, and receive in return one cow or ox in payment (an annual salary of about $50), only then to lose the animal to disease or overworking it.
8 On Google Earth I counted the appearance of metal roofs from 8/10/2003 (the first image available) to 7/10/13 (the last image). In Mtowisa in 2003 there were 91 metal roofed structures. A further 442 new metal roofed structures were built by October 2013.
9 Providing a useful extra income of 8000–12,000/= per month (US$3.5–$4.5).
10 This is a standard measure in Tanzania. It comprises 6 ‘debe’, which are 20 litre buckets of grain.
11 Expressed by my respondent as ‘Amekaa bubuwazi’. This is a local version of ‘amepigwa mbumbuwazi’
12 Casual labour is a contested aspect of peasant studies. Performing such labour can be associated with demeaning work and be an aspect of class formation (Mueller Citation2011). I found that in Rukwa in 2000 performing kibarua work was not necessarily associated with low status – it merged with reciprocal labour relations. It was possible to perform kibarua for one person, and employ vibarua yourself at a later date. Kibarua can also be undertaken in order to save and invest in a particular project. These days kibarua can be a sign of poverty – if it is the only means of support – and a means of accumulation.
13 Whether or not this is actually true, it is a social fact, people believed it and that belief constrained their own personal improvement plans.
14 The phrase is Steve Wiggins, pers comm. 14th March 2019. Consumption surveys are useful if they track the economic utility (or benefits) of expenditure, but less useful if they miss such expenditure.
15 To convert to US dollars divide by 2000.
Related Research Data
References
- Adam, Christopher S., Paul Collier, and Benno Ndulu. 2017. Tanzania: The Path to Prosperity. Oxford: OUP.
- Andersson-Djurfeldt, Agnes, Fred Mawunyo Dzanku, and Aida Cuthbert Isinika. 2018. Agriculture, Diversification and Gender in Rural Africa. Longitudinal Perspectives from Six Countries. Oxford: OUP.
- Ansoms, An, and Thea Hilhorst. 2014. Losing Your Land. Dispossession in the Great Lakes, African Issues. Woodbridge: James Currey, Boydell and Brewer.
- Assies, W. 2009. “Legal Empowerment of the Poor: With a Little Help from their Friends?” Journal of Peasant Studies 36 (4): 909–924. doi:10.1080/03066150903354155.
- Barrett, Christopher B., and Michael R. Carter. 2013. “The Economics of Poverty Traps and Persistent Poverty: Empirical and Policy Implications.” Journal of Development Studies 49 (7): 976–990. doi: 10.1080/00220388.2013.785527
- Baulch, Bob. 2011a. “Overview: Poverty Dynamics and Persistence in Asia and Africa.” In Why Poverty Persists. Poverty Dynamics in Asia and Africa, edited by Bob Baulch, 1–28. Cheltenham: Edward Elgar.
- Baulch, Bob. 2011b. Why Poverty Persists. Poverty Dynamics in Asia and Africa. Cheltenham: Edward Elgar.
- Baulch, Bob, and John Hoddinott. 2000. “Economic Mobility and Poverty Dynamics in Developing Countries.” Journal of Development Studies 36 (6): 1–24. doi: 10.1080/00220380008422652
- Beegle, Kathleen, Joachim De Weerdt, and Stefan Dercon. 2011. “Migration and Economic Mobility in Tanzania: Evidence from a Tracking Survey.” Review of Economics and Statistics 93 (3): 1010–1033. doi: 10.1162/REST_a_00105
- Benjaminsen, Tor A., and Ian Bryceson. 2012. “Conservation, Green/Blue Grabbing and Accumulation by Dispossession in Tanzania.” Journal of Peasant Studies 39 (2): 335–355. doi: 10.1080/03066150.2012.667405
- Bernstein, Henry. 2010. Class Dynamics of Agrarian Change. Halifx and Winnipeg: Fernwood Publishing.
- Bernstein, Henry. 2016. “Agriculture/Industry, Rural/Urban, Peasants/Workers: Some Reflections on Poverty, Persistence and Change.” In Peasant Poverty and Persistence in the 21st Century. Theories, Debates, Realities and Policies, edited by Julio Boltvinik and Susan Archer Mann, 171–205. London: Zed Books.
- Bluwstein, Jevgeniy, Jens Friis Lund, Kelly Askew, Howard Stein, Christine Noe, Rie Odgaard, Faustin Maganga, and Linda Engström. 2018. “Between Dependence and Deprivation: The Interlocking Nature of Land Alienation in Tanzania.” Journal of Agrarian Change 18: 806–830. doi: 10.1111/joac.12271
- Boltvinik, Julio, and Susan Archer Mann. 2016a. “Introduction.” In Peasant Poverty and Persistence in the 21st Century. Theories, Debates, Realities and Policies, edited by Julio Boltvinik and Susan Archer Mann, 1–42. London: Zed Books.
- Boltvinik, Julio, and Susan Archer Mann. 2016b. Peasant Poverty and Persistence in the 21st Century. Theories, Debates, Realities and Policies. London: Zed Books.
- Brockington, D. 2001. “Communal Property and Degradation Narratives. Debating the Sukuma Immigration into Rukwa Region, Tanzania.” Cahiers D'Afrique 20: 1–22.
- Brockington, D. 2006. “The Politics and Ethnography of Environmentalisms in Tanzania.” African Affairs 105 (418): 97–116. doi: 10.1093/afraf/adi071
- Brockington, D. 2008. “Corruption, Taxation and Natural Resource Management in Tanzania.” Journal of Development Studies 44 (1): 103–126. doi: 10.1080/00220380701722332
- Brockington, D. 2019. “Longterm Livelihood Change in Tanzania.” Accessed August 15, 2019. http://livelihoodchangeta.wixsite.com/tanzania/project-summary.
- Brockington, Dan, Ernestina Coast, Olivia Howland, Anna Mdee, and Sara Randall. 2019. “Assets and Domestic Units: Methodological Challenges for Longitudinal Studies of Poverty Dynamics.” Journal of Peasant Studies. doi:10.1080/03066150.2019.1658079.
- Brockington, Dan, Olivia Howland, Vesa-Mati Loiske, Moses Mnzava, and Christine Noe. 2018. “Economic Growth, Rural Assets and Prosperity: Exploring the Implications of a 20-Year Record of Asset Growth in Tanzania.” The Journal of Modern African Studies 56 (2): 217–243. doi: 10.1017/S0022278X18000186
- Brockington, Dan, and Christine Noe. forthcoming. Prosperity in Rural Africa? Insights from Longitudinal Studies in Tanzania. Oxford: OUP.
- Carter, M. R., and C. B. Barrett. 2006. “The Economics of Poverty Traps and Persistent Poverty: An Asset-Based Approach.” Journal of Development Studies 42 (2): 178–199. doi: 10.1080/00220380500405261
- Carter, Michael R., and Travis J. Lybbert. 2012. “Consumption Versus Asset Smoothing: Testing the Implications of Poverty Trap Theory in Burkina Faso.” Journal of Development Economics 99: 255–264. doi: 10.1016/j.jdeveco.2012.02.003
- Chambers, Robert. 1981. “Rural Poverty Unperceived: Problems and Remedies.” World Development 9 (1): 1–19. doi: 10.1016/0305-750X(81)90073-5
- Coudouel, Aline, Hentschel, Jesko S. and Wodon, Quentin .T. 2002. ‘Poverty Measurement and Analysis’. In A Sourcebook For Poverty Reduction Strategies edited by Jeni Krugman Washington DC: The World Bank.
- De Weerdt, Joachim. 2010. “Moving Out of Poverty in Tanzania: Evidence from Kagera.” Journal of Development Studies 46 (2): 331–349. doi: 10.1080/00220380902974393
- Dercon, Stefan, and S. Joseph Shapiro. 2007. “Moving on, Staying Behind, Getting Lost: Lessons on Poverty Mobility from Longitudinal Data.” GPRG-WPS-075, Global Poverty Research Group, Oxford.
- Ellis, Frank, and Ntengua Mdoe. 2003. “Livelihoods and Rural Poverty Reduction in Tanzania.” World Development 31 (8): 1367–1384. doi: 10.1016/S0305-750X(03)00100-1
- Fairhead, James, Melissa Leach, and Ian Scoones. 2012. “Green Grabbing: A New Appropriation of Nature?” Journal of Peasant Studies 39 (2): 237–261. doi: 10.1080/03066150.2012.671770
- Foster, George M. 1965. “Peasant Society and the Image of Limited Good.” American Anthropologist 67 (2): 293–315. doi: 10.1525/aa.1965.67.2.02a00010
- Garikipati, S. 2009. “Landless but not Assetless: Female Agricultural Labour on the Road to Better Status, Evidence from India.” Journal of Peasant Studies 36 (3): 517–545. doi:10.1080/03066150903142774.
- Greco, Elisa. 2015. “Landlords in the Making: Class Dynamics of the Land Grab in Mbarali, Tanzania.” Review of African Political Economy 42 (144): 225–244. doi: 10.1080/03056244.2014.992403
- Hall, Ruth. 2011. “Land Grabbing in Southern Africa: The Many Faces of the Investor Rush.” Review of African Political Economy 38 (128): 193–214. doi: 10.1080/03056244.2011.582753
- Hall, Ruth, Ian Scoones, and Dzodzi Tsikata. 2017. “Plantations, Outgrowers and Commercial Farming in Africa: Agricultural Commercialisation and Implications for Agrarian Change.” Journal of Peasant Studies 44 (3): 515–537. doi: 10.1080/03066150.2016.1263187
- Himanshu, Peter Lanjouw, and Nicholas H. Stern. 2018. How Lives Change. Palanpur, India and Development Economics. Oxford: OUP.
- Hon Minister for Lands, Housing & Human Settlements Development. 2012. “SAGCOT Investment Partnership Program. Initiatives to Ensure Full Community Involvement and Environmental Safeguards While Putting Underutilised Land to Productive Use.” Presentation to the Tanzania Agribusiness Investment Showcase Event. https://landportal.org/fr/library/resources/sagcot-investment-partnership-program-1.
- Howland, Olivia, Christine Noe, and Dan Brockington. 2019. “The Multiple Meanings of Prosperity and Poverty. A Cross-Site Comparison from Tanzania.” Journal of Peasant Studies. doi:10.1080/03066150.2019.1658080.
- Jayne, T. S., Jordan Chamberlin, and Rui Benfica. 2018. “Africa’s Unfolding Economic Transformation.” Journal of Development Studies 54 (5): 777–787. doi: 10.1080/00220388.2018.1430774
- Johnston, D., and Alexandre Abreu. 2016. “The Asset Debates: How (Not) to Use Asset Indices to Measure Well-Being and the Middle Class In Africa.” African Affairs 115 (460): 399–418. doi: 10.1093/afraf/adw019
- Liverpool-Tasiea, Lenis Saweda O., and Alex Winter-Nelson. 2011. “Asset Versus Consumption Poverty and Poverty Dynamics in Rural Ethiopia.” Agricultural Economics 42: 221–233. doi: 10.1111/j.1574-0862.2010.00479.x
- Mashindano, Oswald, Kim Kayunze, Lucia da Corta, and Festo Maro. 2013. “Growth without Poverty Reduction in Tanzania—Reasons for the Mismatch.” In Translating Growth into Poverty Reduction. Beyond the Numbers, edited by Flora Kessy, Oswald Mashindano, Andrew Shepherd, and Lucy Scott, 121–142. Dar es Salaam: Mkuki na Nyota.
- Mashindano, Oswald, and Patrick Kihenzile. 2013. “Assessment of Practices of Agricultural Production, Marketing and Domestic Trade Policies in Tanzania.” ESRF Discussion Paper 45. Dar es Salaam: Economic and Social Research Foundation.
- Mashindano, Oswald, and Andrew Shepherd. 2013. “Introduction: Translating Growth into Poverty Reduction.” In Translating Growth into Poverty Reduction. Beyond the Numbers, edited by Flora Kessy, Oswald Mashindano, Andrew Shepherd, and Lucy Scott, 1–10. Dar es Salaam: Mkuki na Nyota.
- Mueller, Bernd E. T. 2011. “The Agrarian Question in Tanzania: Using New Evidence to Reconcile an Old Debate.” Review of African Political Economy 38 (127): 23–42. doi: 10.1080/03056244.2011.552589
- Naschold, Felix. 2012. “‘The Poor Stay Poor’: Household Asset Poverty Traps in Rural Semi-Arid India.” World Development 40 (10): 2033–2043. doi: 10.1016/j.worlddev.2012.05.006
- Nord, Roger, Yuri Sobolev, David Dunn, Alejandro Hajdenberg, Niko Hobdari, Samar Maziad, and Stéphane Roudet. 2009. Tanzania. The Story of an African Transition. Washington, DC: IMF.
- Östberg, W., O. Howland, J. Mduma, and D. Brockington. 2018. “Tracing Improving Livelihoods in Rural Africa Using Local Measures of Wealth: A Case Study from Central Tanzania, 1991–2016.” Land 7 (44): 1–26.
- Pogge, Thomas. 2008. “Where the Line is Draw. A Rejoinder to Ravallion.” International Poverty Centre. One Pager 69 (October): 1.
- Ravallion, Martin. 2010. “How Not to Count the Poor? A Reply to Reddy and Pogge.” In Debates on the Measurement of Global Poverty, edited by Sudhir Anand, Paul Segal, and Joseph E. Stiglitz, 86–101. Oxford: OUP.
- Reddy, Sanjay G., and Thomas Pogge. 2010. “How Not to Count the Poor.” In Debates on the Measurement of Global Poverty, edited by Sudhir Anand, Paul Segal, and Joseph E. Stiglitz, 42–85. Oxford: OUP.
- Ribot, J. 2014. “Cause and Response: Vulnerability and Climate in the Anthropocene.” Journal of Peasant Studies 41 (5): 667–705. doi:10.1080/03066150.2014.894911.
- Robinson, David O., Matthew Gaertner, and Chris Papageorgiou. 2011. “Tanzania: Growth Acceleration and Increased Public Spending with Macroeconomic Stability.” In Yes Africa Can. Success Stories from a Dynamic Continent, edited by Punam Chuhan-Pole and Manka Angwafo, 21–50. Washington, DC: The World Bank.
- Scoones, Ian, Ruth Hall, Saturnino M. Borras, Ben White, and Wendy Wolford. 2013. “The Politics of Evidence: Methodologies for Understanding the Global Land Rush.” Journal of Peasant Studies 40 (3): 469–483. doi: 10.1080/03066150.2013.801341
- Scott, Lucy. 2010. Giving Assets: An Effective Approach for Reducing Vulnerability and Building Livelihoods? The Case of the Chars Livelihoods Programme. PhD. Diss. The University of Manchester.
- Shivji, Issa G. 1987. “The Roots of Agrarian Crisis in Tanzania: A Theoretical Perspective.” Eastern African Social Science Review 3 (1): 111–131.
- Shivji, Issa G. 2017. “The Concept of ‘Working People’.” Agrarian South: Journal of Political Economy 6 (1): 1–13.
- Singh, N. 2009. “Fighting Rural Poverty, Inequality and low Productivity Through Legal Empowerment of the Poor.” Journal of Peasant Studies 36 (4): 871–892. doi:10.1080/03066150903354072.
- Svarstad, Hanne, and Tor A. Benjaminsen. 2017. “Nothing Succeeds Like Success Narratives: A Case of Conservation and Development in the Time of REDD.” Journal of Eastern African Studies 11 (3): 482–505. doi: 10.1080/17531055.2017.1356622
- UN Statistics Division. 2019. Accessed March 14, 2019. https://unstats.un.org/unsd/class/revisions/coicop_revision.asp.
- Vandergeest, Peter, and Jonathan Rigg. 2012. “The Restudy ‘Problem’ and Agrairan Change: Revisiting Rural Places in Southeast Asia.” In Revisiting Rural Places: Pathways to Poverty and Prosperity in Southeast Asia, edited by Jonathan Rigg and Peter Vandergeest, 1–24. Singapore: Singapore University Press and Hawaii University Press.
- Wolford, Wendy, Saturnino M. Borras Jr, Ruth Hall, Ian Scoones, and Ben White. 2013. “Governing Global Land Deals: The Role of the State in the Rush for Land.” Development and Change 44 (2): 189–210. doi: 10.1111/dech.12017
- World Bank, The. 2016. Accessed March 14, 2019. http://web.worldbank.org/WBSITE/EXTERNAL/TOPICS/EXTPOVERTY/EXTPA/0,,contentMDK: 20242876∼menuPK:492130∼pagePK:148956∼piPK:216618∼theSitePK:430367∼isCURL:Y∼isCURL:Y∼isCURL:Y∼isCURL:Y,00.html.
- Wuyts, Marc. 2008. “Issa Shivji. Interviewed by Marc Wuyts.” Development and Change 39 (6): 1079–1090. doi: 10.1111/j.1467-7660.2008.00520.x
- Young, Alwyn. 2012. “The African Growth Miracle.” Journal of Political Economy 120 (4): 696–739. doi: 10.1086/668501