
ABSTRACT
A basic research has been carried out using four probes to develop an electronic tongue able to discriminate three different kinds of natural waters, i.e. rain, river and groundwater. Several natural water samples were analysed to this purpose using a pH glass electrode, a digital (thermistor) thermometer, an amperometric gaseous diffusion oxygen sensor for measuring the dissolved oxygen and a direct methanol fuel cell enzymatic probe for measuring the concentration of alcoholic traces. Data were processed by means of principal component analysis, obtaining three well differentiated clusters, that demonstrate how the use of only four different sensors can discriminate in an inexpensive and effective way three different classes of natural waters.
1. Introduction
The study and the analysis of natural waters is a very current topic, especially related to the problems of pollution, to which natural waters are very exposed [Citation1]. The collection for analytical purposes, of many and different samples of natural waters, of different origins, made some times without a careful discrimination, often creates additional difficulties, also for the purposes of further programming more in-depth and targeted analysis of various natural water samples [Citation2], on the other hand, it is sometimes necessary to discriminate the type of water contained in basins, open wells or tanks, etc. In the present research, it was therefore addressed the problem of recognising, in a very simple, rapid and safe way, three different types of natural waters (rain, river and groundwater) by means of common and low-cost sensors and using moreover a most popular chemometric elaboration method, such as the principal components analysis (PCA). In literature, they are already reported several articles to discriminate different natural waters, that use arrays of conventional Ion-Selective Electrodes (ISEs) selective to different inorganic cations and anions, or based redox [Citation3–Citation7], lastly potentiometric membrane Ion-Sensitive Field-Effect Transistors (ISFETs) [Citation8]. In addition to other papers concern particular probes which employ special lipid polymeric membranes [Citation9], or several voltammetric methods [Citation10] using also pulse voltammetry [Citation11,Citation12], or sensor array [Citation13,Citation14], lastly optical and/or electrochemical sensors [Citation15]. Furthermore, in the majority of these articles, chemometric methods for the elaboration of experimental measurements, have been used, classic [Citation4,Citation6–Citation15] or quite complex [Citation3,Citation5,Citation11]. The present research on the contrary was conducted using easy, but proved effective methodologies, more in particular have been employed: a glass potentiometric electrode for the pH measurement, an amperometric gaseous diffusion electrode (Clark type) for measuring the dissolved oxygen content, a temperature sensor and, finally, a sensor for measuring the concentration of alcoholic traces of ethanol (and methanol, if eventually present), that we have recently developed, consisting of a small enzymatic catalytic fuel cell for methanol and ethanol [Citation16,Citation17]. This latter type of sensor has been chosen by us because, the pollution from ethanol of natural waters, especially the groundwater, is now an increasingly sensitive problem. Since ethanol was used as biofuel for gasoline and diesel engines, containing relevant percentages of ethanol, even higher than the allowed limit, i.e. 10% (but up to 80% in some cases, despite now completely prohibited) in countries such as Brazil, or also Australia [Citation18], and sometimes USA [Citation19]. In this research, it was shown as the simultaneous use of only four above cited sensors, applied to several rain, river and groundwater samples and the processing all obtained data using a simple PCA chemometric method, easily available on the market, makes it possible to distinguish and correctly separate three different classes of natural waters considered in this research. Although PCA is not a classification method, but its peculiarity, if well calculated, is to create groups, clusters of objects and predictors [Citation20], that can be used to separate the series of objects under examination. This study can therefore represent a basic investigation for the development of a suitable, effective and inexpensive ‘electronic tongue’.
2. Experimental
2.1. Apparatus
For measurement of oxygen content, pH and temperature, the equipment used was respectively: the dissolved oxygen in the analysed water samples was measured using an O2 probe Amel (332/P), connected to an Amel microprocessor apparatus for oxygen measurements, model (360), both produced by Amel (Milan, Italy); pH measurement was carried out by a combined pH electrode produced by Crison instruments (Barcelona, Spain) (52-02), connected by a digital pH metre Amel Instruments (Milan, Italy) (338). The temperature measurements were performed by a thermometer, provided with thermistor and digital display (HI 98501-1), produced by Hanna Instruments (Villafranca Padovana (PD), Italy).
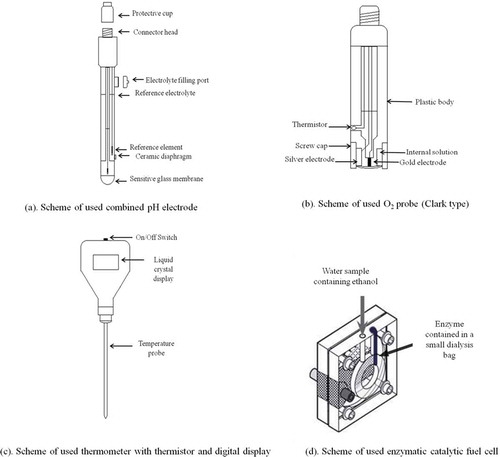
Lastly for alcohol content measures, a very small direct methanol catalytic fuel cell (DMFC) H-TEC Model F111 ()), obtained from the Fuel Cell Store (College Station, TX, USA), has been used. The electrode area was about 4 cm2 and maximum generated power 10 mW. The fuel cell frame was made in Plexiglas®, while the electrode end plate was made in Pt–Ru black catalyst assembled with Nafion™ membrane. For potentiostatic format measurement [Citation16,Citation17], Palmsens mod. EmStat potentiostat was used, connected to the fuel cell. The current supplied to the cell was recorded until the steady state and collected with data interface by PSTrace Software ver. 4.6 to a Compaq Presario PC with AMD Athlon XP 2400+ (1.5 GHz), 2 GB RAM and Windows XP Professional as operating system.
Figure 1. Representation of four used probes.
2.2. Samples
The natural water samples analysed were directly sampled and tested, as is ‘without any pretreatment’ or to carry out on them further tests: rain samples, collected by us in several places of the city of Rome (Italy) at different times; river waters, sampled by us in the Tiber river in the city of Rome and near Rome, at different times, and in another river, i.e. ‘Sacco’ river, in the central Italy. Lastly groundwater samples were taken by the authors of the present paper from surfacing groundwater in the basement of the oldest centre of the city of Rome. All samples were put in specially sealed glass containers, carefully washed and sterilised, so they were analysed shortly after sampling [Citation21,Citation22]. All samples were taken in the same season, at the same time and, as far as possible, on the same day, to minimise (or eliminate) the variability of this type of parameters, and highlight at the most the variability essentially linked to the different types of sample.
2.3. Methods
All measurements were carried out in the laboratory, except those of temperature, which, of course, were done ‘in situ’. The pH measurements were made using a combined electrode (glass-calomelane) ((a)) provided by temperature compensating probe, after having performed a manual calibration of the instrument before each set of measurements, using two buffer solutions at pH 7.00 and 4.00, respectively. Each measure was repeated at least three times. Dissolved oxygen content measurements were carried out using an amperometric probe (Clark type) ((b)) equipped with a thermometer probe for automatic temperature control. The internal filling solution consisted of a distilled water solution containing 2.92 g L−1 of NaCl and 2 g L−1 of NaOH both of analytical grade reagent. Before each measurement session, the automatic calibration of the measuring apparatus was always carried out, firstly checking the operating parameters of barometric pressure and temperature, secondly using, as a reference, a sodium sulphite solution (10 g L−1) and atmospheric oxygen. The search and adjustment of the correct parameters was then done automatically by the instrument, interpolating the temperature and barometric pressure values already set and correcting any deviations from the standard values stored in the instrument memory. The measurement of dissolved oxygen was carried out by inserting the calibrated sensor directly inside the container used for sampling so that the sample did not come into contact with the atmosphere of the measurement room, also taking into account all the other precaution provided in literature [Citation23] for this type of measures. Each measure was repeated three times. Sample temperature measurements were made directly ‘in situ’, when sampling, natural waters, by means of a thermistor digital thermometer (see (c)). Prior to each set of measurements, it was carefully checked that the battery delivered exactly 1.5 V, otherwise it was immediately replaced. The probe was then immersed in the sample by checking that the immersion level was 4 cm. The reading was done after 10 s, and repeated three times.
For alcohol measurement, ethanol (+ methanol if present), the (DMFC) device was based on the anodic following (Pt–Ru) catalysed reactions:
C2H5OH + 3 H2O ———> 12 H+ + 12 e− + 2CO2
CH3OH + H2O ———> 6 H+ + 6 e− + CO2
at the anode the ethanol or the methanol, was catalytic oxidised to carbon dioxide and hydrogen ions, while electrons were released. The hydrogen ions permeated the Nafion membrane and reacted with the oxygen to the cathodic section of the cell, giving water; this process generated a difference of potential between the anode and the cathode. To reduce the response time of the fuel cell, an immobilised enzyme (alcohol dehydrogenase) was introduced in the anodic section of the fuel cell (as described in detail in previous papers [Citation16,Citation17]). At present, we have not immobilised the enzyme inside the bag with a chemical method, even if this is of course possible and not too difficult [Citation23], as it is enough to easy replace the exhausted enzyme in the bag, so that the enzyme resume to operate at its best. It was recorded the supplied current (SC) of the fuel cell, at the optimised applied potential [Citation16,Citation17]. The measurement of the SC, at the steady state was read off and correlated with the alcohol concentration in the fuel cell [Citation16,Citation17].
This enzymatic fuel cell method has been previously validated [Citation17] by comparing the data obtained with those found using a conventional catalase enzymatic biosensor, the assembly and functioning of which was described in detail in previous paper [Citation24], and validated several times [Citation23,Citation24]. The validation of other three sensors was carried out and supplied by the producers of the commercial probes, using their suitably equipment devices [Citation24,Citation25], partly described in the previous paragraph ‘apparatus’.
3. Results and discussion
After having pointed out all the analytical methods, for the measurement of pH, the dissolved oxygen, the alcohol content and the temperature (see main features collected in ), measurements on three different types of natural waters have been carried out, that is rain, river and groundwater, were experimentally checked for pH, dissolved oxygen concentration, temperature values and alcohol content, using methods reported in previous paragraph (see all found values collected in ). Therefore, it was possible to deal chemometrically all these obtained values, coming from the measures of four different considered parameters, processing all ‘standardized’ (using ‘Autoscaling’) data, by the PCA, using a MVA Microsoft Excel application (Multi Variate Analysis of Prof. Richard Brereton, Les Erskine and Tom Thurston) [Citation26]. The application of PCA, to data collected, has shown that it is possible to obtain an excellent separation into different clusters, which enable the identification of three different types of natural waters, with great simplicity and remarkable effectiveness.
Table 1. Main analytical features of four utilised probes.
Table 2. All experimental values of four measured different parameters in all the analysed natural water samples (each value is the mean of three determinations).
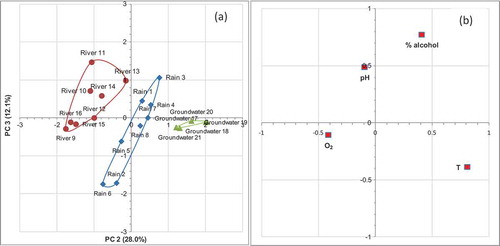
The ‘scores’ of PCA representation show that the first two principal components (reported in the )) are able to separate, with about 67% of the total variance, all the samples into three clusters, one of which groups the samples of rain water, the other two groups the river and groundwater samples, respectively, while the loadings representation (see )) show that the pH values give the main contribution to clusters separation, along principal components PC1, however the temperature, and alcohol concentration, allow the separation along the PC2 component. The representation along principal components 1 and 3 are on the contrary unable to separate completely three respective kinds of samples (see (a,b)). While, (a), shows as, the scores representation along the second and third principal components are still able to discriminate three different types of samples in three respective clusters. In this case, the temperature and O2 content give the main contribution to a still acceptable separation (as show the loading representation of (b)). On the other hand, it can be observed (see ) as each one of three eigen values are higher than one, therefore all three principal components, would be theoretically significatives, but the more high value, i.e. that one of the first principal component, in practice is the more effectively significant ().
Table 3. Eigenvalues, RSS (residual sum of squares) and PRESS (predictive residual sum of squares), as a function of principal components number.
Figure 2. (a) Scores representation along PC1 and PC2 principal components (triangles = groundwater samples; diamonds = rain samples; circles = river samples); and (b) loadings representation.
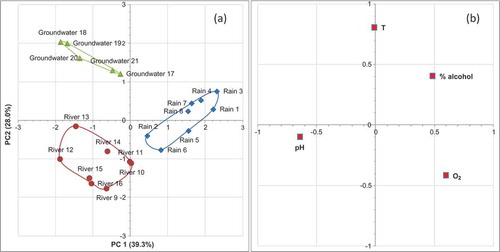
Figure 3. (a) Scores representation along PC1 and PC3 principal components (triangles = groundwater samples; diamonds = rain samples; circles = river samples); and (b) loading representation.
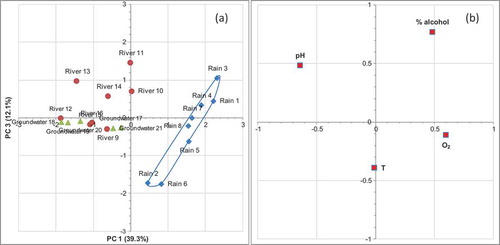
Figure 4. (a) Scores representation along PC2 and PC3 principal components (triangles = groundwater samples; diamonds = rain samples; circles = river samples); and (b) loadings representation.
4. Conclusions
Using four inexpensive, quick and easy to use probes (in the first instance all able to operate also ‘in situ’ [Citation16,Citation17]), were measured four different parameters in three different classes of the most common natural waters, i.e. rain water, river water and groundwater, with sufficient precision (see ) and accuracy, since all four methods used were already validated and standardised.
Lastly we demonstrated as the PCA application to only four different kinds of data (all easy measured using the four described different common sensors), are able to separate each one type of three examined natural water from the other two water kinds. Thanks to the simplicity and practicality of the sensor methods described, the research can be considered as a useful and necessary study for the realisation of a simple and inexpensive electronic tongue, which allows to effectively discriminate between the different types of natural waters, above all for the purpose of plan further different types of targeted analyses, which one can believe to be later necessary for the total characterisation of each of all investigated aqueous samples.
Disclosure statement
No potential conflict of interest was reported by the authors.
Additional information
Funding
References
- C.S. Chen, Y.Y. Shu, S.H. Wu and C.J. Tien, Environ. Sci. Process Impacts 17, 533 (2015). doi:10.1039/C4EM00443D.
- Y. Zhang, I.A. Khan, X. Chen and R.F. Spalding, J. Contam. Hydrol 82, 183 (2006). doi:10.1016/j.jconhyd.2005.09.007.
- R. Martínez-Máñez, J. Soto, E. Garcia-Breijo, L. Gil, J. Ibáñez and E. Llobet, Sens. Actuators, B 104, 302 (2005). doi:10.1016/j.snb.2004.05.022.
- K. Sghaier, H. Barhoumi, A. Maaref, M. Siadat and N. Jaffrezic-Renault, Sensor Lett. 7, 683 (2009). doi:10.1166/sl.2009.1131.
- E. Garcia-Breijo, J. Atkinson, L. Gil-Sanchez, R. Masot, J. Ibañez, J. Garrigues, M. Glanc, N. Laguarda-Miro and C. Olguin, Sens. Actuators, A 172, 570 (2011). doi:10.1016/j.sna.2011.09.039.
- P. Ciosek, Z. Brzózka and W. Wróblewski, Sens. Actuators, B 103, 76 (2004). doi:10.1016/j.snb.2004.04.038.
- A. Legin, A. Rudnitskaya, Y. Vlasov, C. Di Natale, E. Mazzone and A. D’Amico, Electroanalysis 11, 814 (1999). doi:10.1002/(SICI)1521-4109(199907)11:10/11<814::AID-ELAN814>3.0.CO;2-7.
- L. Sipos, Z. Kovács, V. Sági-Kiss, T. Csiki, Z. Kókai, A. Fekete and K. Héberger, Food Chem 135, 2947 (2012). doi:10.1016/j.foodchem.2012.06.021.
- A. Taniguchi, Y. Naito, N. Maeda, Y. Sato and H. Kezaki, Sens. Mater. 11, 437 (1999).
- A. Scozzari, N. Acito and G. Corsini, IEEE Trans. Instrum. Meas. 56, 2688 (2007). doi:10.1109/TIM.2007.903600.
- P.K. Kundu, P.C. Panchariya and M. Kundu, ISA Trans 50, 487 (2011). doi:10.1016/j.isatra.2011.03.003.
- F. Winquist, P. Wide and I. Lundström, Anal. Chim. Acta 357, 21 (1997). doi:10.1016/S0003-2670(97)00498-4.
- C. Krantz-Rülcker, M. Stenberg, F. Winquist and I. Lundström, Anal. Chim. Acta 426, 217 (2001). doi:10.1016/S0003-2670(00)00873-4.
- M. Lindquist and P. Wide, Instrumentation and Measurement Technology Conference, 2001. IMTC 2001. Proceedings of the 18th IEEE, 1320 (2001).
- C. Di Natale, F. Dini and A. Scozzari, Hdb Env. Chem. 40, 279 (2014).
- M. Tomassetti, R. Angeloni, G. Merola, M. Castrucci and L. Campanella, Electrochim. Acta 191, 1001 (2016). doi:10.1016/j.electacta.2015.12.171.
- M. Tomassetti, G. Merola, R. Angeloni, S. Marchiandi and L. Campanella, Anal. Bioanal. Chem. 408, 7311 (2016). doi:10.1007/s00216-016-9795-2.
- R.K. Niven, Renew. Sustainable Energy Rev. 9, 535 (2005). doi:10.1016/j.rser.2004.06.003.
- H.X. Corseuil and P.J.J. Alvarez, Wat. Sci. Tech. 34, 311 (1996). doi:10.2166/wst.1996.0636.
- P.M. Kroonenberg, Applied Multiway Data Analysis (John Wiley & Sons Ed., Hoboken, USA, 2008). ISBN: 978-0-470-16497-6.
- ISO 5667-1:2006 (en), Water Quality – Sampling, Part1: Guidance on the Design of Sampling Programmes and Sampling Techniques.
- ISO 5667-3:2006 (en), Water Quality – Sampling, Part 3: Guidance on the Preservation and Handling of Water Samples.
- Metodi analitici per le acque, APAT-IRSA-CNR Ed., 589, 2004. ISBN: 88-448-0083-7.
- R. Angeloni, M. Tomassetti, M. Castrucci and L. Campanella, Curr. Anal. Chem. 11, 56 (2015).
- M. Tomassetti, G. Spuri Capesciotti, R. Angeloni, E. Martini and L. Campanella, Sensors 16 (1355) (2016). doi:10.3390/s16122100.
- R.G. Brereton, Chemometrics Data Analysis for the Laboratory and Chemical Plant, 1st ed. (John Wiley & Sons Ltd, The Atrium, Southern Gate, Chichester, West Sussex PO19 8SQ, England, 2003).