
 ?Mathematical formulae have been encoded as MathML and are displayed in this HTML version using MathJax in order to improve their display. Uncheck the box to turn MathJax off. This feature requires Javascript. Click on a formula to zoom.
ABSTRACT
Methylsilanols such as trimethylsilanol (TMS) are considered as the major hydrolytic degradation products of methylsiloxanes, a class of anthropogenic organometallic substances with a wide range of applications. The distribution of these silanols in various environmental compartments, therefore, could provide direct information on silanols’ chemical fate and environmental exposure. Existing methods for the quantification of the silanols are not sensitive and robust enough for analyzing environmental media where trace- and ultra-trace-level concentrations may be expected. In the present study, solid-phase extraction (SPE) and solvent extraction in combination with gas chromatography-mass spectrometry (GC/MS) were tested for analyzing water, sediment, soil and biosolids samples for TMS. ISOLUTE® ENV+ solid-phase sorbent was found to be most suitable for extraction of water samples for ultra-trace TMS, while direct solvent extraction worked for solids samples such as soil, sediment and biosolids. Coupling with an isotopic internal standard and SPE extraction, direct GC/MS analysis without derivatization can reach a method detection limit for TMS as low as 0.10 µg L−1 in water. The detection limits for solid samples varied from 0.21 ng g−1 ww (wet weights) to 10 ng g−1 ww, mostly limited by background concentrations of TMS in extraction solvents. It was also observed that prolonged sample storage may lead to a reduction in TMS concentrations, regardless of the concentrations of coexisting methylsiloxanes.
1. Introduction
This project is related to the methods of environmental analysis for trace and ultra-trace level of trimethylsilanol (TMS), an methylsilanol. TMS is related to the basic building blocks for methylsiloxanes, a group of anthropogenic organometallic substances with a wide range of applications. As discussed in various reviews [Citation1–Citation3], oligomeric methylsiloxanes, i.e. linear volatile methylsiloxanes (lVMS), are mainly distributed in the air compartment where they undergo degradation. Although some siloxanols have been identified as products in the simulated gas-phase photolysis [Citation4,Citation5], a complete degradation products analysis has not been done for lVMS in this compartment. Both low molecular weight lVMS and high molecular weight polydimethylsiloxane (PDMS) polymers may be released to wastewater streams and enter water compartment by effluent discharge, and soil through land disposal of treated sludge [Citation1,Citation6]. As reviewed in early literature [Citation6,Citation7], PDMS may be found at μg kg−1 (ppb) to mg kg−1 dry weight (ppm) in soil amended with sludge and sediment impacted by waste-water discharge. The recent monitoring studies also report few ppb to a few hundred ppb levels of lVMS in the sediments [Citation3].
Extensive studies in soil have shown that both lVMS [Citation8] and PDMS [Citation9–Citation13] undergo clay-catalyzed hydrolysis to form organosiloxanols as intermediates, and TMS and diemthylsilanediol as the major degradation products. The degradation rates of these methylsiloxanes in water and sediments are slower than those in the soil, but the major hydrolysis products are still the same silanols [Citation14–Citation16].
There are few studies related to the trace-level analysis of silanols in environmental samples, despite possible occurrence of TMS in the environment. Early methods in the public literature are mostly on dimthylsilanediol with detection limits at ppm-levels as reviewed elsewhere [Citation17,Citation18]. There is one early study specifically on TMS analysis using low-temperature chromatography with inductively coupled plasam optical emission spectrometry (LT GC/ICP-OES) and GC/MS [Citation19]. Although LT-GC/ICP-OES was used for TMS quantitation in that study [Citation19], no detection limit was given or could be calculated from the disclosed data for comparison and GC/MS was not used as quantitation technique, but only for confirmation of molecular identification of TMS. More recent studies include the analysis of TMS in air samples in industrial settings [Citation20,Citation21] and landfill offgas [Citation22,Citation23]. However, the analysis of TMS and DMSD in environmental media such as natural water, sediment and soil at or below ppb concentrations is difficult and rare until now. Recently, two different methods were disclosed for analysis of various environmental samples for trace- and ultratrace level dimethylsilanediol using both GC/MS [Citation24] and LC/MS-MS [Citation25]. Although TMS and other methylsilanols including diemthylsilanediol are mostly from the same sources, their physicochemical properties are so different that an universal extraction and analysis method for all methylsilanols may not be feasible. For example, the logarithm of air/water partition coefficients (log KAW) is −2.77 for TMS [Citation26] and −6.84 for DMSD [Citation27]. Due to its extremely low log KAW value, volatilisation of DMSD from water is negligible, while some volatilisation of TMS from wet soil and water may be expected. On the other hand, DMSD has an octanol/water partition coefficients (KOW) of 0.39 [Citation27]; Its low KOW value explained the observed non-quantitative extraction of this silanol from water by ethyl acetate [Citation28] and by solid-phase extraction (SPE) with ENV+ [Citation24]. TMS has a much higher log KOW value of 17 [Citation26] and organic solvent extraction from environmental media may be feasible, although an effective extraction and accurate analysis method still need to be developed for this compound in major surface compartments.
In this study, the extraction of TMS in water by SPE was examined using 14C-TMS from water and coupled with GC/MS analysis for trace- and ultra-trace level TMS. In addition, a solvent extraction in couple with GC/MS analysis was also tested for TMS in soil, sediment and biosolids. All the methods have been validated with field water, soil, sediment and biosolid samples.
2. Experimental
2.1. Materials
Non-isotopically labelled (native) TMS (>98%), used as an analytical standard, was purchased from Sigma-Aldrich. Radiolabeled 14C-TMS (> 98% by radiochemical analysis) and isotope-enriched 13C-TMS (13C isotope purity >99% by GC/MS) were synthesised in Dow Inc. Solid-phase extraction cartridges ENV+ (500 mg) and the loose ENV+ resins were obtained from Biotage (Charlotte, NC, USA). Anhydrous MgSO4 (analytical grade) was supplied by Fisher Scientific and pretreated before each use by heating over 250°C for at least 2 h to drive off any background silanols, and cooling in a desiccator with P2O5 as a drying agent. Solvents including methanol, acetone, dichloromethane (DCM) and hexane were all analytical grade from Sigma-Aldrich and were used without further purification.
Purified water (Milli-Q water) was prepared in house and was used in combination with natural lake water for the development of extraction and instrumental analysis methods. In addition, wet soil, lake sediment and wet biosolids used in this study were all collected from sites in Michigan for analytical method development, without any consideration of sample representativeness or QA/QC procedure. A more stringent procedure was used in the collection of water samples for method validation as discussed in Section 2.5.
2.2. Extraction of water
2.2.1. Extraction procedure development
TMS concentrations in natural water samples are expected to be low and may coexist with its hydrolysis precursors, i.e. trimethylsilyl-bearing VMS such as hexamethyldisiloxane (HMDS),octamethyltrisiloxane and decamethyltetrasiloxanes. A solid-phase extraction procedure was developed to separate TMS from water and concentrated for instrumental analysis. Specifically, ENV+ resin (69 mg) was packed into a 2 cm guard column and connected to a high-performance liquid chromatograph (Agilent 1100) with a radiochemical detector (Radiomatic 610TR from PerkinElmer) (HPLC/RAD). A 4-μL aliquot of the spiking solution of 14C-radiolabeled TMS was injected into the HPLC/RAD and eluted by purified (Milli-Q) water at 1.0 mL min−1. The observed retention time was used to predict the extraction/concentration of TMS from water by ENV+. In addition, two 200-mL aliquots of Milli-Q water spiked with 14C-TMS were pulled through ENV+ cartridges at a rate of 5–7 mL min−1. The radioactivity retained by ENV+ columns was eluted with acetone and dichloromethane (DCM). The radioactivity in the passing water, and that eluted by various solvents, was analyzed by liquid scintillation counting (LSC) to determine extraction and elution efficiency. The radiolabeled TMS was used at this early stage because of the existence of the 14C-TMS analysis method [Citation26].
2.2.2. Natural water extraction procedure
In a clean hood (Lavata AB, Stockholm) in a laboratory equipped with charcoal-filtered input air (to minimise the background contaminations of TMS and siloxanes from air), 100 mL of water were spiked with a fixed volume (e.g. 100 µL) of internal standard (IS) solution (13C-TMS with initial concentration ~ 20 mg L−1 in water). The water sample was immediately pumped through a pre-washed 0.45 µm nylon syringe filter and then through pre-washed (with methanol and water) ENV+ cartridge at a rate of ~5 mL min−1. After the water was drained completely, the wet ENV+ column was eluted with 0.75 mL of DCM and the displaced water was discarded. The ENV+ column was then eluted with 2.0 mL more of DCM, and the eluate was collected in a PTFE tube. The water droplet on top of the DCM extract was removed using a clean pipette.
2.3. Extraction of solid samples
To prevent sample composition change, all solid samples with no free-standing water were crushed in sample bags by hand and weighed into PTFE sample tubes in a clean hood without drying or grinding. The free- standing water in sediment and biosolid slurry samples were first removed and the solid materials including their pore water was weighed into sample tubes. Before extraction, all solid samples (1–2 g ww each) were spiked with a fixed amount of 13C-TMS aqueous IS solution, and analytical grade dichloromethane (1–1.5 mL) was mixed with the solid at solvent-to-solid ratio of 1:1 to 1:2 (v: w) in a closed PTFE tube for at least 2 h under high agitation. The solvent and solid were separated by centrifugation at 3000 rpm (2100 g) for 10 min. The resulting sample appeared as three separate phases: soil in the bottom, DCM extract in the middle and water on the top. The DCM extract was removed to a silanized GC vial for GC/MS analysis, or to a pre-cleaned PTFE tube for further concentration by N2 flushing before GC/MS analysis.
2.4. GC/MS analysis
2.4.1. Calibration standards
For water analysis, a set of eight TMS standards with a fixed amount of 13C-TMS and 0, 1, 5, 10, 25, 50 and 100 µg L−1 of native TMS, respectively, were prepared using a 13C-TMS IS stock solution (18.75 mg L−1) and a 10 mg L−1 and 100 mg L−1 native TMS working solutions. The solvent was Milli-Q water. All the standards were extracted by SPE, as described above, for analysis by GC/MS.
For solid media analysis, separate sets of soil, sediment and biosolids (1–2 g ww each) were extracted with 20 mL Milli-Q water three times to make medium blanks. These blanks were each spiked with a fix amount of 13C-TMS and 0, 1, 5, 10, 25, 50 and 100 µg L−1 of native TMS, respectively. After mixing for 2 h, each of the samples was extracted with DCM, and the extracts were analyzed by GC/MS.
2.4.2. Instrumental analysis
GC/MS analysis of all DCM extracts was performed using an Agilent GC/MS (HP 6890 GC/HP 5973 MSD) equipped with an Agilent ultra-inert liner, Merlin MicroSeal septum and an Agilent J&W DB-624 capillary column (30.0 m × 320 µm × 1.80 µm). The analytical conditions are listed in .
Table 1. Conditions for GC/MS analysis.
2.5. Method validation
For solids analysis, only the recoveries of matrix spike and matrix spike replicates were used to check the validity of the DCM extraction method. The following procedure was used to test the validity of both SPE extraction of natural water samples and GC/MS analysis of TMS in DCM extracts.
Three types of water samples (two different possible sources and a receiving water) were collected from four sites (see S1 and Figure S1 in the Supporting Information for details) for use in method validation. Briefly, river water was collected from a stream in Minnesota that flowed through an agricultural area having biosolids-amended soil, before flowing into Lake Pepin. Effluent was collected from the City of Red Wing Municipal Wastewater Treatment Plant (WWTP), which treats 1.8 million gallons per day of waste water from both tannery and food processing operations (~40%), and municipal sources (~60%), and discharges the effluent to Lake Pepin. In addition, the Lake Pepin surface water was sampled at two down-stream sites. For each sample, the pre-washed glass collection jar containing hexane-washed polyethylene (PE) strips 0.1 mm thick, 144 in2 per jar to remove siloxanes from water [Citation28] inside was immersed into water at least 10 cm below the water surface and the cap was removed to allow water to fill the jar. The jar was closed with the cap before being taken out of the water column. All sample jars were stored at about 4°C in a cooler during transportation and storage, prior to analysis.
For the purpose of monitoring possible sample contamination during sample collection, transport and storage, three trip blanks and three field blanks were prepared by placing pre-washed PE strips in three jars each with Milli-Q water and a Teflon-lined cap, the same way as described for the natural water samples. They were all prepared before the sampling trip and kept closed and stored in the same cooler that stored the natural water samples during the collection, transport and storage, except that the field blanks were opened briefly (approximately 30 s, the same length of time that each effluent sample was exposure to air) at the WWTP site where the effluent water was sampled. In addition, spiked controls were prepared using Milli-Q water samples with a spiked TMS concentration of 10 µg L−1. Finally, check standards with known amounts of TMS and internal standard were prepared in the same way as the calibration standards and were included in each batch of samples analyzed.
3. Results and discussion
3.1. Water analysis
3.1.1. SPE extraction of TMS from water
The purpose of SPE extraction was not only to extract TMS from water into an organic solvent suitable for GC/MS analysis, such as DCM, but also to concentrate the TMS. In order to demonstrate the concentrating power of the ENV+ resin, 14C-TMS was injected into the HPLC/RAD with a guard column filled with 69 mg ENV+ resin (total void volume of 2 mL). Using a constant flow rate of 1.0 mL min−1, no 14C-TMS was eluted after 310 mL of water was pumped through (Figure S2). The strong retention of TMS by ENV+ was also verified by passing 190 mL 14C-TMS-spiked water through a commercial ENV+ SPE cartridge (500 mg) at a flow rate of 10 mL min−1 (). The high retention (94%) of 14C-TMS up to 190 ml water loading suggested that a large volume of water can be extracted without significant breakthrough.
Figure 1. Retention of TMS in water by ENV+ SPE cartridge (500 mg) (a) and elution of the sorbed TMS by acetone and dichloromethane (DCM) (b). TMS loss refers to the TMS not extracted by the ENV+ resin.
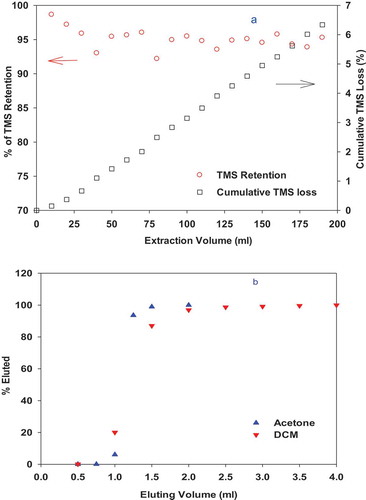
For elution of the sorbed TMS from ENV+ resin, low-boiling-point solvents such as DCM and acetone were tested as shown in . For the 500 mg ENV+ cartridge, TMS was eluted by both DCM and acetone. Although the acetone may elute slightly faster than DCM (), non-polar solvent DCM was chosen for future analysis to reduce the moisture introduced to the GC column. For complete elution of TMS, 2 mL of DCM were added to each ENV+ column. However, only 1.3 ~ 1.7 mL DCM extract was recovered from each sample, corresponding to a volume-based concentration factor (water to DCM volume ratio) of 59 ~ 77 for a water sample size of 100 mL.
3.1.2. Calibration curves and the procedural blanks
Typical SIM chromatograms for both quantitation and confirmation ions, and the mass spectrum of TMS by electron ionisation can be found in Figure S3. Two types of calibration curves were determined using the SIM mode for different purposes. The first set of calibration standards with a wide concentration range was prepared by directly adding TMS to DCM to define the linearity range. As shown in ), no deviation from linearity was observed up to 1000 μg L−1 TMS. A second calibration curve for TMS was obtained using TMS and IS-spiked purified water samples going through the SPE extraction. TMS in the tested concentration region behaves very well and the response at m/z = 75 was linearly related to the spiked concentration of native TMS with an r2 value of 0.9998 for seven concentration levels (Figure S4). The corresponding native-to-IS response ratios (R75/R77) have an even better linear relationship (r2 = 0.9999) with respect to the spiked concentrations of native TMS ()):
Figure 2. External calibration curve of TMS prepared by direct addition of TMS (also called native TMS) into DCM solvent without IS (a) and a calibration curve of TMS prepared by addition of TMS standards and 13C-TMS IS to Milli-Q water which were then analyzed by SPE extraction and GC/MS of DCM extracts (b). R75 = peak area of m/z = 75, representing the native TMS and R77 = peak area of m/z = 77, representing the IS.
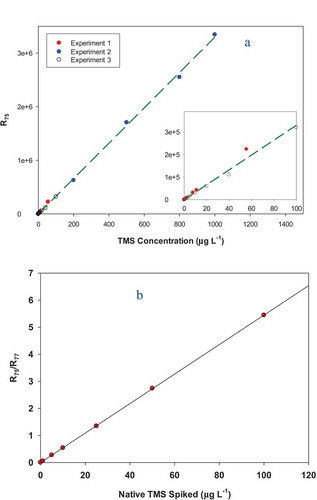
with no intercept.
It should be pointed out that in the data processing leading to Equation. 1, the contribution of the native TMS to the response of m/z = 77 (−0.0357R75) was removed based on a set of calibration standards of native TMS directly spiked into DCM without IS addition (Figure S5). In addition, a correction was made to remove the contribution to the response of m/z = 75 from internal standard 13C-TMS (−0.0068R75). This correction factor was based on the regression of measured responses at m/z = 75 (or R75) when a set of 13C-TMS standards was run without any native TMS spiking (Figure S6). In this case, although a good linear correlation was observed between R77 and the spiked 13C-TMS, the R75 values were small, but measurable.
3.1.3. Method detection limits (MDL) and limits of quantitation (LOQ)
According to US EPA, MDL was defined as ‘the average procedural blank concentrations plus t0.01 × standard deviation of the procedural blanks’ [Citation29]. This definition is based on the assumption that the procedural blank value was not subtracted from any measurements. In this study, the procedural blank was subtracted from the measurements and, therefore, MDL was defined as ‘t0.01 × standard deviation of the procedural blanks’ while the LOQ was defined as ‘10 × Standard deviation of the procedural blanks,’ where t0.01 is the Student t-value for right-tail test at 99% probability level. As listed in , the standard deviation of seven procedural blanks at 100 mL sample size was 0.031 μg L−1 (or ng g−1), corresponding to an MDL of 0.10 μg L−1 and an LOQ of 0.31 μg L−1 for TMS in water.
Table 2. Detection limits of TMS in different media (ww = wet weight).
3.2. Sediment, soil and biosolids analysis
3.2.1. Standard addition curves
Using 13C-TMS as IS, calibration curves for TMS in solid analysis can be approximated by a set of standards in water or in the extraction solvent like DCM without solid matrix. This approach may result in biased low variations in measurements due to the simplified matrix. In this study, a set of medium blanks was first prepared by repeated extraction of the solids with purified water to reduce the possible background silanol concentrations. Calibration curves for all solids were prepared by addition of various amounts of native TMS with a fixed 13C-TMS as IS into these medium blanks before extraction with DCM solvent. As exemplified in for soil, the response ratios (R75/R77) in these standards were linearly related to the spiked native/IS concentration ratios (CTMS/CIS) with slopes close to 1. The intercepts can be viewed as the response ratio of the procedural blanks. The linear relationship between R75/R77 and CTMS/CIS ratios can be used in the sample analysis:
Figure 3. Calibration curve for soil prepared with Milli-Q water-washed soil blanks.
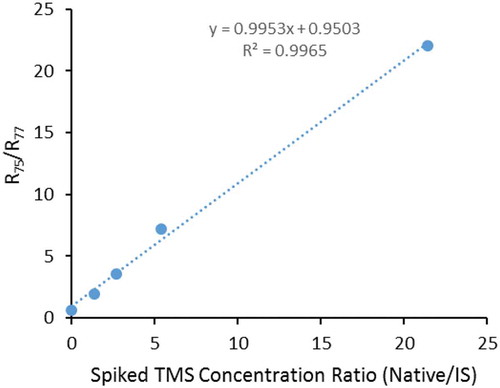
where CTMS, CIS and Cblk are TMS and IS concentrations and the procedural blank value, respectively. If the concentration of IS is unknown, the regression of R75/R77 against the spiked native TMS concentration as shown in Figure S7 for sediment and biosolids can be used for sample quantitation under one condition: each sample of standards and field samples is spiked with the same amount of IS.
3.2.2. Detection limits
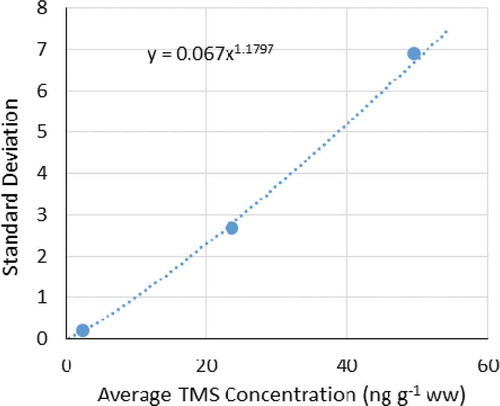
Two methods were used for detection limits determination. For media with possible high background TMS concentrations (e.g. soil), the detection limits were determined by the extrapolation method as exemplified by soil data shown in . In this experiment, seven replicates were analyzed at each of three concentration levels: one without native TMS spiking (background 2.4 ng g−1 ww) and two with different spiked TMS levels (23.7 and 49.6 ng g−1 ww). The standard deviations of the measured native TMS concentrations decreased with the decrease in the measured average native TMS concentrations and can be fit to a quadratic function with respect to the TMS concentrations in soil (). The standard deviation extrapolated to zero TMS concentration was 0.067 ng g−1 ww, corresponding to an MDL of 3.14 × 0.067 ng g−1 ww, or 0.21 ng g−1 ww at 99% probability level, and an LOQ of 0.67 ng g−1 ww ().
Figure 4. The relationship between the standard deviation of the TMS concentration measurements of seven replicates and their average concentrations measured in Milli-Q water-washed soil.
In the second method, the detection limit was estimated based on the standard deviation of seven replicates of the procedural medium blanks without any TMS addition. For example, the standard deviation of the TMS concentration in the sediment samples was 1.00 ng g−1 ww, corresponding to a MDL of 3.14 ng g−1 ww and a LOQ of 10.0 ng g−1 ww for sediment (). By this approach, MDL was found to be 11.9 ng g−1 ww and a LOQ was 38 ng g−1 ww for biosolids (). This method may overestimate the MDL because the medium blanks prepared in this manner may have substantial levels of background TMS; this is especially true for biosolids.
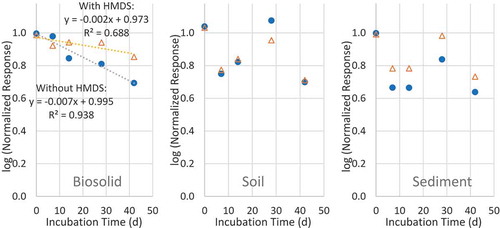
3.2.3. Effects of hexamethyldisiloxane (HMDS) on TMS analysis
The effect on the TMS measurements in all three solid media from coexisting methylsiloxanes was evaluated by HMDS spiking. Shown in are the measured TMS concentration changes after the TMS spiked media were incubated inside the closed Teflon tubes for different incubation times at 4°C, with and without the HMDS spiking. In biosolids (, left) without HMDS spiking, the measured TMS concentrations decreased as the incubation time increased, suggesting some removal mechanism unknown by us at this juncture. With HMDS spiking, the decrease in the measured TMS concentrations slowed down, suggesting that some TMS may be formed in the biosolids from the HMDS to compensate for the loss of TMS. In soil and sediment, the measured TMS concentrations were too variable to determine the significant effect of HMDS. The above data suggest that it is important to limit the storage time of these media if there presents a significant amount of trimethylsilyl-bearing siloxanes.
Figure 5. Effect of hexamethyldisiloxane (HMDS) spiking on the measurements of TMS in biosolid, soil and sediment.
3.3. Validation of the methods
3.3.1. QA/QC samples for water analysis
Besides the procedural blanks, QA/QC samples for water analysis included trip and field blanks, matrix spikes and check standards (see Section S-1 for definitions). As shown in , both trip blanks and field blanks were prepared with the same Milli-Q water as used for the procedural blanks. After the subtraction of the procedural blanks, the measured concentrations of TMS in 9 trip blanks and 9 field blanks were all below the detection limits, suggesting no detectable contamination from sample collection and transport processes. For 9 matrix spikes analyzed, 9.52 ± 0.19 μg L−1 (average ± standard deviation) was recovered for a 10.0 μg L−1 spike of TMS, or a recovery of 95.2 (± 1.9) % for the spiked TMS, indicating a good accuracy and precision of the analysis. Check standards were also included in every analysis in the same analytical sequence. For the total of 7 check standards analyzed, the average recovery was 98.9% for TMS, within the acceptable range of 100 ± 20% for trace analysis.
Table 3. Analytical results of method validation and QA/QC samples of water.
3.3.2. River water, lake water and waste water effluents
The concentrations of TMS in river and lake water were below the MDLs (). For WWTP effluent from Red Wing WWTP, TMS was detected around 1 μg L−1, which was above the MDL, but below the LOQ. As disclosed in Section 2.3, the waste water stream in the sampled Red Wing WWTP has 40% inputs from tannery and food processing operations, where silicone products are often used as processing aids, such as antifoaming and defoaming agents and lubricants. In addition, methylsiloxanes may also be present in municipal waste water, originating from consumer products.
3.3.3. Method validation for a solid analysis
For validation of the method, soil, sediment and biosolids were spiked with various amounts of TMS (matrix spikes), extracted and analyzed following the methods described above. As shown in , TMS was detected in soil and biosolids, not in sediment. The average spike recovery, adjusting for the original TMS in the corresponding media, ranged from 85% to 96%, within the acceptable range of 100 ± 20%.
Table 4. Analytical results of method validation samples: spiked and measured concentrations (conc) for TMS in soil, sediment and biosolids matrix spikes.
Two additional points may need to be discussed about these results. First, all the solid samples were not dried or ground before extraction. This was done intentionally to avoid any loss of TMS or contamination in such procedure. In addition, water, sediment, soil and biosolids were collected and used for the purpose of testing the analytical methods. Because there was no consideration of either the spatial or temporal representativeness of the samples at any specific sampling sites, the reported TMS concentrations are not suitable for the evaluation of environmental exposure.
4. Conclusion
Using 13C-isotope enriched TMS as an internal standard, TMS in solid media can be readily extracted with organic solvents such as DCM and analyzed by GC/MS without derivatization. The detection limits in these media are 0.2–10 ng g−1 ww solids, limited mostly by the background contamination in blanks. For water analysis, SPE with ENV+ can be used to separate TMS from water and concentrate it before the GC/MS analysis. With the extracted water volume > 100 mL, detection limits below 1 μg L−1 can be achieved.
Supplemental Material
Download PDF (534.6 KB)Acknowledgments
The author is grateful to Silicones Europe (CES) for financial support, to Jeremy Durham, Rita Seston and Brent Townsend from The Dow Chemical Company, and Bob Stark from Red Wing Waste Water Treatment Plant for their assistance in collection of validation samples, to Julie Miller, John LaDouce and Bruce Kropscott for sample analysis, and to Gary Kozerski, Wendy Koch, Stephen Dorn, Rita Seston, Debra McNett and Claudia Madl for their review of the draft manuscript.
Disclosure statement
No potential conflict of interest was reported by the author.
Supplemental Material
Supplemental data for this article can be accessed https://doi.org/10.1080/03067319.2019.1636041
Additional information
Funding
Related Research Data
References
- J.F. Hobson, R. Atkinson and W. Carter, The Handbook Environmental Chemistry, Vol. 3, Part H: Organosilicon Materials, edited by G. Chandra (Springer-Verlag, Berlin, 1997), Chap. 6, pp. 137–179.
- D.G. Wang, W. Norwood, M. Alaee, J.D. Byer and S. Brimble, Chemospehere 93, 711 (2013). doi:10.1016/j.chemosphere.2012.10.041.
- C. Rücker and K. Kümmerer, Chem. Rev. 115, 466 (2014). doi:10.1021/cr500319v.
- R. Sommerlade, H. Parlar, D. Wrobel and P. Kochs, Environ. Sci. Technol. 27, 2435 (1993). doi:10.1021/es00048a019.
- S.J. Markgraf and J.R. Wells, Int. J. Chem. Kinet. 29, 445 (1997). doi:10.1002/(SICI)1097-4601(1997)29:6<445::AID-KIN6>3.0.CO;2-U.
- N.J. Fendinger, D.C. McAvoy, W.S. Eckhoff and B.B. Price, Environ. Sci. Technol. 31, 1555 (1997). doi:10.1021/es9608712.
- N.J. Fendinger, R.G. Lehmann and E.M. Mihaich, in Handbook of Environmental Chemistry Vol. 3 Part H Organosilicon Materials, edited by G. Chandra (Springer-Verlag Berlin Heidelberg, Germany, 1997), Chap. 7, pp. 180–223.
- S. Xu, P. Bauer and C. Bryant, SETAC 24th Europe meeting, Basel, Switzerland, May 11–15 2014, 2014.
- R.R. Buch and D.N. Ingebrigtson, Environ. Sci. Technol. 13, 676 (1979). doi:10.1021/es60154a002.
- R.G. Lehmann, S. Varaprath and C.L. Frye, Environ. Toxicol. Chem. 13, 1061 (1994). doi:10.1002/etc.5620130707.
- R.G. Lehmann, S. Varaprath, R.B. Annelin and J.L. Arndt, Environ. Toxicol. Chem. 14, 1299 (1995). doi:10.1002/etc.5620140806.
- R.G. Lehmann, C.L. Frye, D.A. Tolle and T.C. Zwick, Water, Air, Soil Pollut. 87, 231 (1996). doi:10.1007/BF00696839.
- S. Xu, R.G. Lehmann, J.R. Miller and G. Chandra, Environ. Sci. Technol. 32, 1199 (1998). doi:10.1021/es983872y.
- J.C. Carpenter, T.K. Leib, C.L. Sabourin and J.L. Spivack Abs, No. PO578. SETAC 17th Annual Meeting, Washington DC, 1996.
- G.E. Kozerski and J.A. Durham, SETAC Northern America 27th Annual meeting, Montreal, Quebec, Canada, 2006.
- S. Xu, J. Mille, R. Gerhard and W.E. Poster, 154, 20th SETAC Europe Annual Meeting, Seville, Spain, 2010.
- J.C. Carpenter and R. Gerhards, in Handbook of Environmental Chemistry Vol. 3 Part H Organosilicon Materials, edited by G. Chandra (Springer-Verlag Berlin Heidelberg, Germany, 1997), Chap. 2, pp. 27–52.
- J.L. Spivac, E.R. Pohl and P. Kochs, in Handbook of Environmental Chemistry Vol. 3 Part H Organosilicon Materials, edited by G Chandra (Springer-Verlag Berlin Heidelberg, Germany, 1997), Chap. 5, pp. 105–136.
- R. Grümping, D. Mikolajczak and A.V. Hirner, Fresenius J. Anal. Chem. 361, 133 (1998). doi:10.1007/s002160050849.
- J.H. Lee, C. Jia, Y.D. Kim, H.H. Kim, T.T. Pham, Y.S. Choi, Y.U. Seo and I.W. Lee, Int.J. Anal. Chem. 2012. doi:10.1155/2012/690356
- J.S. Herrington, Anal. Chem. 85, 7882 (2013). doi:10.1021/ac401522p.
- G. Piechota, M. Hagmann and R. Buczkowski, Bioresour. Technol. 103, 16 (2012). doi:10.1016/j.biortech.2011.09.002.
- R. Grümping and A.V. Hirner, Fresenius J. Anal. Chem. 363, 347 (1999). doi:10.1007/s002160051201.
- S. Xu, J. Chromatogr. A (2019). doi:10.1016/j.chroma.2019.04.026.
- S. Xu and S. Knoerr, Int. J. Environ. Anal. Chem. (2019). doi:10.1080/03067319.2019.1636039.
- S. Xu and B. Kropscott, Environ. Toxicol. Chem. 33, 2702 (2014). doi:10.1002/etc.2754.
- S. Xu and B. Kropscott, Anal. Chem. 84, 1948 (2012). doi:10.1021/ac202953t.
- S.M. Knoerr, J.A. Durham and D.A. McNett, Chemosphere 182, 114 (2017). doi:10.1016/j.chemosphere.2017.04.136.
- USEPA, Definition and Procedure for the Determination of the Method Detection Limit, Revision 2. 2016, https://www.epa.gov/sites/production/files/2016-12/documents/mdl-procedure_rev2_12-13-2016.pdf. Downloaded April 26, 2018.