
 ?Mathematical formulae have been encoded as MathML and are displayed in this HTML version using MathJax in order to improve their display. Uncheck the box to turn MathJax off. This feature requires Javascript. Click on a formula to zoom.
ABSTRACT
Polybrominated diphenyl ethers (PBDEs) are synthetic organic compounds that have been used as brominated flame retardants. They are persistent in the environment, can bioaccumulate in fatty tissues, biomagnify through the food chain, and have adverse health effects on humans and wildlife. The main source of human exposure to PBDEs is the ingestion of contaminated food. Therefore, in this study the concentration of BDE-28, BDE-47, BDE-77, BDE-99, BDE-100, BDE-126, BDE-139, BDE-153, BDE-154, and BDE-183 was determined by gas chromatography coupled to mass spectrometry in shrimps and animal origin oils commercialised and consumed in Medellín, Colombia. All samples of shrimps and animal origin oils analysed had values below 0.0050 ng·g−1 for all the PBDEs studied, with the exception of one shrimp sample in which a concentration of 0.012 ± 0.0056 ng·g−1 of BDE-100 was quantified. The results suggest that shrimps and animal origin oils are not a significant source of exposure to PBDEs of the population of the city. However, it is important to continue analysing PBDEs in foods, including foods other than those evaluated in this investigation, in order to guarantee the innocuity and safety of the food consumed by the population.
1. Introduction
Polybrominated diphenyl ethers (PBDEs) are synthetic organic compounds that have been used as brominated flame retardants (BFRs) in various types of electronic equipment (cables and printed circuit boards), construction materials, furniture, foams, plastics, textiles and automobile parts, among other commercial and industrial products [Citation1]. In theory, 209 PBDE congeners are possible, and these vary in the degree of bromination and substitution position of hydrogen atoms in aromatic rings. These congeners are named and numbered according to the system of the International Union of Pure and Applied Chemistry [Citation2,Citation3]. PBDEs can be easily incorporated into materials because they are not chemically bound [Citation4]. Therefore, they can be transported and migrate to various environmental compartments during the production, use, recycling and dismantling processes [Citation5,Citation6]. In the global market, there are three main commercial formulations of PBDEs, specifically, penta-BDE, octa-BDE and deca-BDE. These have been produced since the 1970s, which has resulted in the ubiquity of PBDEs around the world [Citation7].
PBDEs are persistent in the environment and have been classified as global pollutants [Citation8,Citation9]. Furthermore, they can bioaccumulate in fatty tissues and biomagnify through the food chain [Citation10]. Previous studies have shown that PBDEs have a high cytotoxicity on human cells [Citation11,Citation12]. Additionally, experimental studies in animals and epidemiological studies in humans suggest that PBDEs are developmental neurotoxic compounds [Citation13], affect the function of the human thyroid [Citation14] and play an important role in the occurrence and development of breast cancer [Citation15]. Due to their persistence, bioaccumulation, biomagnification, long-range transport capacity and risk of adverse effects on human health and wildlife, mixtures of penta-BDE and octa-BDE were included in the Stockholm Convention in 2009, while the congener BDE-209 was added to this in 2017 [Citation16].
Human exposure to PBDEs can occur through inhalation, skin exposure, and ingestion of contaminated products [Citation1,Citation7,Citation17–19]. The last of these is the most important route of exposure, given that around 79% of the total intake of PBDEs comes from consumption of foods [Citation20,Citation21], especially those with a high fat content, such as fish products, pork, chicken and animal origin oils [Citation21]. The estimated average daily dietary intake for adults is 4.0 ng·kg−1·b.w−1 per day in Europe according to the European Food Safety Authority (EFSA) [Citation22] and 0.6 ng·kg−1·b.w−1 per day for the US population according to the United States Environmental Protection Agency (EPA) [Citation23]. Fish and fishery products are among the foods most contaminated with PBDEs, and the concentration of the congeners increases with fat content [Citation22,Citation24]. Globally, several studies have been carried out to determine the concentration of PBDEs in food, and reviews have been published to compile the most relevant findings of these investigations [Citation1,Citation7,Citation18]. Among the PBDE congeners that have been most frequently analysed and detected in fishery products are BDE-47, BDE-99, BDE-100, BDE-153, BDE-154, BDE-183, and BDE-209 [Citation18]. Of these, BDE-47 is the congener that is generally found in the highest concentrations in seafood; indeed, concentrations higher than 81,800 ng·g−1 lipids have been reported in fish [Citation25].
Meanwhile, the European Commission, through 2014/118/EU, recommends analysing ten congeners of PBDEs (BDE-28, BDE-47, BDE-49, BDE-99, BDE-100, BDE-138, BDE-153, BDE- 154, BDE-183 and BDE-209) with a quantification limit less than or equal to 0.010 ng·g−1 of fresh weight in food of animal origin, products for specific nutritional use and food for infants [Citation26]. There is an obvious global interest in evaluating the concentration of PBDEs in foods, in order to guarantee their innocuity and safety for human consumption, as well as to have an approximate estimate of human exposure through the intake of food contaminated with these compounds. In Colombia however, there is, to the best of the authors’ knowledge, no report that determines the concentration of PBDEs in food consumed by the human population. However, research has been carried out in the country that has identified and quantified congeners of PBDEs in fish [Citation27]; sediments [Citation27–29] and air [Citation30–32].
Considering the above, the objective of the present research was to determine the concentration of PBDEs in shrimp and animal origin oils distributed and consumed in the city of Medellin, Colombia, in order to improve the state of the art regarding PBDEs in the city and the country. The results obtained represent the first national study of this type and could be useful for the establishment of national legislation to control the concentrations of PBDEs in food.
2. Materials and methods
2.1. Standards and reagents
Standards of BDE-28, BDE-47, BDE-77, BDE-99, BDE-100, BDE-126, BDE-139, BDE-153, BDE-154, and BDE-183 were obtained from Accustandard (New Haven, USA) at a concentration of 50 mg·L−1. PCB 209 was used as a surrogate standard and was obtained from Dr. Ehrenstorfer (Augsburg, Germany) with a purity of 98.8%. The salts and solvents used during the extraction and clean-up of samples were anhydrous sodium sulphate (Na2SO4), n-hexane (chromatographic grade), and acetone (chromatographic grade). These were purchased from Merck (Darmstadt, Germany). Finally, the Florisil® (60–100 mesh) used to clean-up the samples were obtained from Sigma-Aldrich (St. Louis, USA). A 1.0 mg·L−1 PBDE working mix solution was prepared from the 50 mg·L−1 PBDE standards in acetone and a 10 µg·L−1 PBDE working mix solution was prepared from the 1.0 mg·L−1 mixture in acetone. A 200 µg·L−1 solution of PCB 209 in n-hexane was prepared and 20 µL were added to the samples before starting the analytical extraction process. The calibration range used for quantification of the samples was 0.50–100 µg·L−1 (0.0050–1.0 ng·g−1). Calibration solutions were prepared by appropriate dilution of the working mixtures in n-hexane. The working mixtures and stock solutions were stored at −20 ± 2°C.
2.2. Sampling
Ten shrimp brands (S1, S2, S3, S4, S5, S6, S7, S8, S9, S10) and ten batches of the same brand of the animal origin oils (cod oil) (O1, O2, O3, O4, O5, O6, O7, O8, O9, O10) were selected and purchased at a local supermarket in Medellin, Colombia. In the country, there are 30 registered brands dedicated to the production and marketing of shrimp. In this work, only the main registered brand for the production of animal oil is analysed, which covers the majority of the available sources of shrimp and animal origin oil in the city. The amount of shrimp of each brand purchased was 500 g. The amount of animal oil sample acquired was 180 mL per batch. Shrimp samples (500 g) were homogenised using a Hobart GmbH model CC34 (Offenburg, Germany) and 200 g of dry ice for 5 min. Homogenised shrimp samples were stored in hermetic bags at −20 ± 2°C. Animal oil samples did not require any prior treatment other than agitation before starting the extraction process and were stored at 23 ± 5°C. The sampling and storage of the samples was carried out according to the general sampling guide of the Codex [Citation33]. All the selected samples were produced in Colombia, and sampling was conducted between April and June 2021.
2.3. Extraction and clean-up
2.3.1. Shrimp
The method was previously validated and is briefly described below. 20 ± 0.70 g of homogenised shrimp sample was weighed in a 40 mL glass vial, then 20 µL of PCB 209 at 200 µg·L−1 were added as a surrogate standard, along with 2.0 g of Na2SO4. Subsequently, the sample was reposed for 24 h in refrigeration between 0 and 6°C. After the repose time, 20 mL of a mixture of n-hexane:acetone (1:1) were added, and mechanical shaking was carried out at 700 rpm for 5 minutes using a Pall shaker, model PN 4821 (Portsmouth, United Kingdom). Then, the sample was centrifuged at 1500 rpm for 5 minutes at 0°C with a Boeco centrifuge model U-320 R (Hamburg, Germany). The organic phase was then transferred to a new 40 mL glass vial. The extraction steps were repeated twice more, and the volume of extract obtained was approximately 30 mL. The obtained extract was evaporated to approximately 0.50 mL with a gentle nitrogen stream, and clean-up of the concentrated extract was carried out using a packed column (1.5 cm id × 15 cm) containing 2.0 g of florisil and 1.0 g of Na2SO4, the latter of these at the top of the column. The florisil packed column was previously conditioned with 10 mL of n-hexane and the elution of the sample was performed with 10 mL of n-hexane. The clean-up extract was evaporated to dryness using a gentle nitrogen stream, and then reconstituted with 200 µL of n-hexane. It was then transferred to a 300 µL insert into a chromatography vial to be injected into the gas chromatography coupled to mass spectrometry (GC-MS).
2.3.2. Animal origin oils
The method was previously validated and is briefly described below. The animal oil sample was gently shaken, and 20 ± 0.70 g of the sample was weighed in a 40 mL glass vial. Then, 20 µL of PCB 209 at 200 µg·L−1 was added as a surrogate standard, after which the sample was left undisturbed for 24 h at 23 ± 5°C. After the repose time, 20 mL of n-hexane were added, and mechanical shaking was carried out at 700 rpm for 5 minutes using a Pall shaker model PN 4821 (Portsmouth, United Kingdom). Then, the sample was centrifuged at 1500 rpm for 5 minutes at 0°C with a Boeco centrifuge model U-320 R (Hamburg, Germany). Subsequently, the organic phase was transferred to a new 40 mL glass vial. The extraction steps were repeated twice more, and the volume of extract obtained was approximately 35 mL. The obtained extract was evaporated to approximately 0.50 mL with a gentle nitrogen stream. Then, clean-up of the concentrated extract was performed with a packed column (1.5 cm id × 15 cm) containing 2.0 g of florisil and 1.0 g of Na2SO4, the latter of these at the top of the column. The florisil packed column was previously conditioned with 10 mL of n-hexane and elution of the sample was performed with 10 mL of n-hexane. Finally, the clean-up extract was evaporated to dryness using a gentle nitrogen stream and reconstituted with 200 µL n-hexane. It was then transferred to a 300 µL insert into a chromatography vial to be injected into the GC-MS.
2.4. Instruments
The extracts of the samples of shrimp and animal origin oils were analysed in a 7890A gas chromatograph (Agilent Technologies, USA) coupled to a 5975C mass spectrometer (Agilent Technologies, USA) equipped with a 7693 autosampler (Agilent Technologies, USA) and multimode inlet (MMI) (Agilent Technologies, USA). The column used for the separation was an HP-5 MS UI (30 m × 0.25 mm id × 0.25 μm) (Agilent Technologies, USA). The MMI mode of operation was solvent vent. The injection volume was 5 µL. The initial temperature of the injection port was 45°C, which was held for 0.80 min. Then, the injector temperature was increased to 320°C at 600°C·min−1 and was held constant until the end of the analytical run. Vent flow was 100 mL·min−1 at 2 psi for 0.7 min and split vent flow was 500 mL·min−1 at 5 min. The initial oven temperature was 40°C, which was held for 1 min. Then, the temperature was increased to 100°C at 20°C·min−1, and then to 260°C at 5°C·min−1. Finally, it was increased to 320°C at 15°C·min−1 and held for 2 min. The transfer line temperature to mass spectrometer was 320°C. The ion source temperature was 230°C and the quadrupole temperature was 150°C. The ionisation used was electron ionisation at 70 eV. The acquisition in the mass spectrometer was performed in selective ion monitoring (SIM) mode. The carrier gas was helium, with a purity of 99.999%, at a constant flow of 1.8 mL·min−1. The chromatographic run time was 42 min.
2.5. Validation and uncertainty
The performance of the analytical method for the determination of PBDEs in shrimp samples and animal origin oils was evaluated in terms of linearity, precision, trueness, robustness, method detection limit (MDL) and method quantification limit (MQL) [Citation34–37]. Uncertainty was estimated using the ‘top-down’ strategy [Citation36–39].
2.5.1. Linearity and matrix effect
Linearity was evaluated by performing calibration curves in solvent (n-hexane) and calibration curves in matrix. Calibration curves were made with 7 concentration levels in the range 0.50–100 µg·L−1 (0.0050–1.0 ng·g−1). The regression hypothesis was tested through an analysis of variance (ANOVA), and the coefficients of determination (R2) were calculated [Citation40]. The matrix effect was evaluated by constructing a linear regression curve with the instrumental response (area) of the analytes in solvent versus the instrumental response in matrix. Confidence limits at 95% were calculated for the slope and the intercept. If 1 was included in the confidence interval calculated for the slope and 0 was included in the confidence interval calculated for the intercept, it is concluded that there is no significant difference between the calibration curves in matrix and solvent, and therefore that there was no matrix effect [Citation41].
2.5.2. Method quantification limit (MQL) and method detection limit (MDL)
Seven samples fortified at 0.0050 ng·g−1 of shrimp and animal oil were analysed. Subsequently the MDL and MQL were calculated using the approximation of t99SLLMV method [Citation42,Citation43].
2.5.3. Precision and trueness
The precision of the method was evaluated under conditions of intermediate precision and repeatability using fortified samples of shrimp and animal origin oils at 0.0050, 0.50 and 1.0 ng·g−1 (n = 36). The trueness was calculated with the recovery percentages obtained in the tests of fortified samples of shrimp and animal origin oils mentioned above.
2.5.4. Robustness
Robustness was evaluated using the strategy suggested by Youden and Steiner [Citation44–46]. The factors evaluated were the volume of extraction, volume of elution in the clean-up, mass of florisil and mass of anhydrous sodium sulphate. Eight experiments were randomly performed by duplicate at a concentration of 0.50 ng·g−1.
2.5.5. Uncertainty
The relative expanded uncertainty (Uexp) was estimated by multiplying the coverage factor (k = 2) by the square root of the square sum of the within-laboratory reproducibility (uRw) and method and laboratory bias (ub) by one hundred percent (EquationEquation 1(1)
(1) ).
Where, Uexp corresponds to the relative expanded uncertainty, 2 corresponds to the coverage factor (k) ≈ 95%, uRw corresponds to the random error component of the uncertainty (within-laboratory reproducibility) and finally, ub corresponds to the systematic error component of the uncertainty (laboratory and method bias). The Uexp was estimated at 0.0050, 0.50 and 1.0 ng·g−1. The results were fitted to a polynomial model because it was the model that best fitted the results for the interpolation of Uexp in the concentration range studied.
2.6. Quality assurance and quality control (QA/QC)
The methods were previously validated. Additionally, in each batch of samples analysed, a method blank (shrimp blank matrix and animal origin oils) was performed to verify cross-contamination during extraction. Also, an analytical control of the method was performed by fortifying a blank sample of shrimp at 0.50 ng·g−1 and oil at 0.0050 ng·g−1. The recovery percentages of the analytical controls of the method were between 76% (BDE-28) and 119% (BDE-183) in shrimp, and 72% (BDE-28) and 124% (BDE-154) in oil. Also, a sample chosen randomly was spiked for duplicate at 1.0 ng·g−1 and 0.50 ng·g−1 in shrimp and animal oil, respectively, to assess the performance of the method in terms of recovery and precision during sample analysis. The recovery percentage of the spiked samples was between 74% (BDE-28) and 122% (BDE-183) in shrimp, and 74% (BDE-28) and 112% (BDE-139) in animal origin oils. The relative percentage difference (RPD) of the spiked samples was between 14% (BDE-183) and 22% (BDE-28) in shrimp, and 12% (BDE-126) and 25% (BDE-47) in animal origin oils. Finally, PCB 209 was used as a surrogate standard in all the samples analysed, and the average recovery percentage was 82% while the range was between 74% and 91%.
3. Results and discussion
The methods developed and used to determine the concentration of PBDEs (BDE-28, BDE-47, BDE-77, BDE-99, BDE-100, BDE-126, BDE-139, BDE-153, BDE-154 and BDE-183) in samples of shrimp and animal origin oils commercialised in the city of Medellin, Colombia, had an adequate performance, given that the results obtained during the validation in terms of linearity, precision, trueness, robustness, MDL and MQL were within the acceptance criteria established by the reference method EPA 1614 [Citation47]. The summary of the validation results is presented in .
Table 1. Summary results of PBDE validation in shrimp and animal origin oils.
The coefficients of determination (R2) for all PBDEs in the study were ≥0.997 in solvent and matrix (). Additionally, for all congeners evaluated, the linear regression hypothesis in solvent and matrix was demonstrated in the range 0.50–100 µg·L−1 (0.0050–1.0 ng·g−1) with an ANOVA. shows the curve constructed with the instrumental response in solvent versus the instrumental response in matrix of BDE-47.
Figure 1. Evaluation of the matrix effect of BDE-47. Area in solvent vs area in matrix. CI: 95% confidence interval.
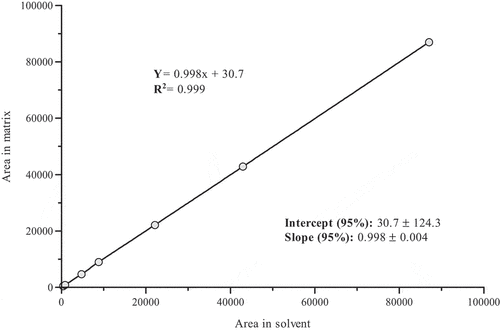
The confidence interval at 95% of the slope was 0.994–1.002 and the intercept was −93.6 – 155. According to the confidence intervals at 95% of the slope and intercept, it is concluded that, for the congener BDE-47, the slope is statistically equal to 1 and the intercept equal to 0. As such, statistically, there is no significant difference between the calibration curves in solvent and matrix. In fact, there is no matrix effect in the quantification of BDE-47 in shrimp samples and animal origin oils. Likewise, for all the other PBDE congeners evaluated, it was concluded that there is no matrix effect, considering the 95% confidence intervals of the slope and the intercept. This could be explained by the fact that the matrix effect in gas chromatography is associated with the interaction of the matrix and the analytes with the silanol groups in the liner, which are highly polar [Citation48]. However, PBDEs are non-polar compounds. This means that their interaction with silanol groups is negligible, and they are not retained in the injection port, most entering in the chromatographic column. Furthermore, the clean-up process of the method removes most of the matrix components.
Estimated MDLs were between 0.0011 ng·g−1 (BDE-154) and 0.0016 ng·g−1 (BDE-77) in shrimp and 0.0011 ng·g−1 (BDE-77) and 0.0015 ng·g−1 (BDE-99/BDE-139) in animal origin oils. The calculated MQLs were between 0.0033 ng·g−1 (BDE-154) and 0.0047 ng·g−1 (BDE-77) for shrimp; and 0.0033 ng·g−1 (BDE-77) and 0.0045 ng·g−1 (BDE-99/BDE-139) for animal origin oils. In all cases, the calculated MQLs were less than 0.0050 ng·g−1; however, due to instrumental sensitivity and to avoid possible false positives and negatives, all MQLs were approximates to the lower reporting limit of the method (0.0050 ng·g−1), in which the precision and trueness of the analytical method was verified for all PBDE congeners. The intermediate precision of the method evaluated as relative standard deviation (RSD) for all congeners was ≤ 25% in the two matrices studied and the recovery percentages were between 76% and 91% in shrimp and 72% and 92% in animal oil. Finally, the methods developed were robust given that none of the factors evaluated significantly influenced the results when slightly modified.
shows the estimated maximum values of Uexp and the fitted polynomial models for all PBDE congeners in the study. The maximum Uexp results ranged from 44% – 72% in shrimp and 47% – 70% in animal origin oils. The results of Uexp are consistent considering the concentration levels evaluated and the fact that the analytical process includes several steps, causing an increase in random errors in the analytical methodology. A significant improvement in the analytical process could be the inclusion of automated sample clean-up systems, given that this could reduce the variability implicit in manual operations and consequently reduce the Uexp values of PBDEs in the developed methods.
Table 2. Uexp (%) and polynomial model for the interpolation of the uncertainty of PBDEs in shrimp and animal origin oils.
3.1. PBDEs in shrimp
Ten brands of shrimp (S1, S2, S3, S4, S5, S6, S7, S8, S9, and S10) were selected and purchased at a local supermarket in the city of Medellin. The congeners BDE-28, BDE-47, BDE-77, BDE-99, BDE-100, BDE-126, BDE-139, BDE-153, BDE-154 and BDE-183 were quantified using the previously validated methodology. All the shrimp samples analysed had values lower than 0.0050 ng·g−1 for all the PBDEs in the study (), with the exception of the S4 sample, which had a concentration of 0.012 ± 0.0056 ng·g−1 of BDE-100 (). shows the chromatogram of the S4 shrimp sample in which the chromatographic peak of BDE-100 (35.5 min) is evident. Also, the chromatogram of a solvent blank (n-hexane) is shown, in which no signals associated with the PBDE congeners of the research are observed, confirming that the chromatographic system did not present interferences and/or contamination during the injection of the analytical batch. Additionally, a chromatogram of a matrix blank is presented that corresponds to a previously analysed shrimp sample, in which it had been confirmed that there was no presence of the PBDE congeners of the study.
Figure 2. TIC chromatogram of shrimp samples. a: Solvent (n-hexane), b: Matrix blank, c: 0.050 ng·g−1 standard, d: Spiked shrimp sample to 0.50 ng·g−1, e: S4 shrimp sample.
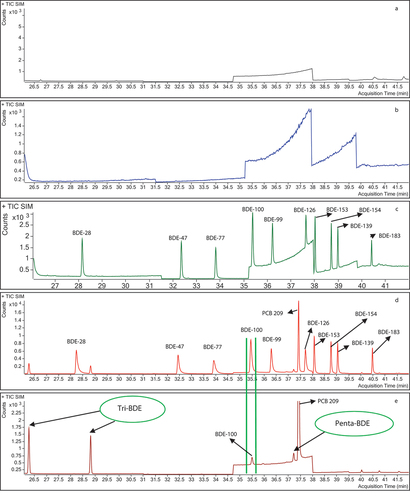
Table 3. Results of PBDEs in shrimp samples (ng·g−1).
The matrix blank was analysed in the same analytical batch as the shrimp samples, allowing it to be demonstrated that there was no cross-contamination during the analysis. Also, in , a chromatogram of the S2 shrimp sample that did not contain PBDEs is presented. Additionally, a chromatogram of a standard in solvent at 0.050 ng·g−1 and a fortified shrimp sample at 0.50 ng·g−1 is presented, in which the chromatographic peaks of the PBDEs of the study can be seen. It is observed that the retention time of BDE-100 in the S4 sample coincides with the retention time in the standard and spiked sample.
The National Authority for Aquaculture and Fisheries from Colombia in 2021 for Medellín reported that 137.85 tons of shrimp were marketed, being the third most consumed species in the city. Moreover, the shrimp had an increase of 12% in marketed tons, compared to 2020. However, in the country, there is no regulation that controls the amount of PBDEs in food consumed by the population. Hence, this type of contaminant is not periodically monitored and analysed within the country. On the other hand, when comparing the results obtained in shrimp samples with the regulation of the European Commission (2014/118/EU), it was found that all the samples were below the established limit of 0.010 ng·g−1. Even S4 sample did not exceed the regulatory limit for BDE-100 given that the concentration obtained was 0.012 ± 0.0056 ng·g−1 (the uncertainty was calculated using the polynomial model in ). Therefore, taking into account the expanded uncertainty, the concentration of the sample is in the concentration range of 0.0064 and 0.018 ng·g−1 at 95% confidence. This is not over the limit established by the European Commission; however, it is a warning sign as there could be other foods in the city that contain higher concentrations of PBDEs. Therefore, it is important that PBDEs continue to be monitored locally and nationally in order to guarantee the innocuity and safety of the foods consumed by the population.
Based on the above, the results suggest that shrimp does not represent a significant source of PBDEs for the population of the city that consumes this food. However, in the chromatogram of S4 sample (), other signals of tri-BDE and penta-BDE congeners are observed at retention times of 26.3 min and 28.8 min for the tri-brominated homologues and 37.2 min for the penta-brominated homologue, which are congeners that are not included in the study. The latter of these was also observed in samples S3, S8 and S10. This could of interest for future research, given that it is likely that the source of exposure to PBDEs in this type of food is through other congeners different to those evaluated in this research.
3.2. PBDEs in animal origin oils
All the animal origin oil samples analysed had values lower than 0.0050 ng·g−1 (). Therefore, they were below the limit of 0.010 ng·g−1 established by the European Commission. The animal origin oil is consumed mainly by the young population of the city. The results suggest that animal origin oils (cod oil) distributed in the city of Medellin, Colombia, do not represent a significant source of PBDEs for the population that consumes this type of food. However, samples O1, O3 and O5 () had PBDE congeners other than those in this study, which could be of interest for future research. The PBDE congeners identified in the animal origin oils samples were tri-brominated homologues at retention times of 26.3 min and 28.8 min and penta-brominated homologues at retention times of 35.5 (BDE-100 < 0.0050 ng·g−1), 36.0 and 37.2 minutes.
Figure 3. TIC chromatogram of animal oil samples. a: O1 sample, b: O3 sample, c: O5 sample.
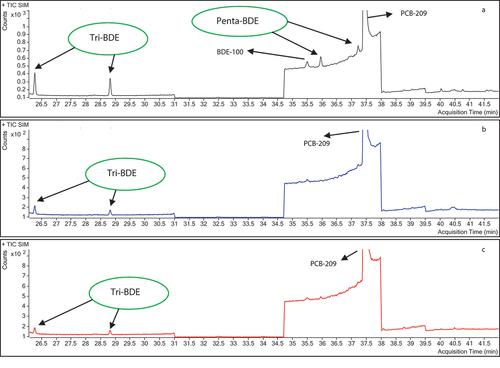
Table 4. Results of PBDEs in animal origin oil samples (ng·g−1).
Finally, although the congeners BDE-28, BDE-47, BDE-77, BDE-99, BDE-100, BDE-126, BDE-139, BDE-153, BDE-154 and BDE-183 were not quantified in the samples of animal origin oils, it is important to continue carrying out this type of monitoring periodically, including other foods, in order to guarantee the innocuity and safety of the food consumed by the population of the city and the country.
4. Conclusions
For the first time in the city of Medellin, Colombia, PBDEs were monitored and quantified in food commercialised and consumed by the population. The results suggest that shrimp and animal origin oils are not an important source of exposure to PBDEs for the population due to the levels quantified in the samples analysed. However, the presence of BDE-100 in a shrimp sample is a warning sign that should prompt further research in this field, given that there could be other foods in the city and country that contain higher concentrations of PBDEs. Finally, it is necessary to continue carrying out this type of monitoring periodically, including other foods, to guarantee the innocuity and safety of the food consumed by the city’s population.
Acknowledgments
The authors acknowledge to Diagnosis and Pollution Control Group for financial support of the research.
Disclosure statement
No potential conflict of interest was reported by the author(s).
References
- Y. Jiang, L. Yuan, Q. Lin, S. Ma and Y. Yu, Polybrominated Diphenyl Ethers in the Environment and Human External and Internal Exposure in China: A Review. Sci. Total Environ. 696, 133902 (2019). doi:10.1016/j.scitotenv.2019.133902.
- S.A. Mills, D.I. Thal and J. Barney, A Summary of the 209 PCB Congener Nomenclature, Chemosphere 68 (9), 1603 (2007). doi:10.1016/j.chemosphere.2007.03.052.
- K. Ballschmiter and M. Zell, Analysis of Polychlorinated Biphenyls (PCB) by Glass Capillary Gas Chromatography - Composition of Technical Aroclor- and Clophen-PCB Mixtures. Fresenius’ Zeitschrift für Anal. Chemie. 302 (1), 20 (1980). doi:10.1007/BF00469758.
- K. English, L.M.L. Toms, C. Gallen and J.F. Mueller, BDE-209 in the Australian Environment: Desktop Review. J. Hazard. Mater. 320, 194 (2016) 10.1016/j.jhazmat.2016.08.032
- Z.Z. Yang et al., Polybrominated Diphenyl Ethers in Leaves and Soil from Typical Electronic Waste Polluted Area in South China. Bull. Environ. Contam. Toxicol. 80 (4), 340 (2008) doi:10.1007/s00128-008-9385-x
- Y.M. Kim, I.H. Nam, K. Murugesan, S. Schmidt, D.E. Crowley and Y.S. Chang, Biodegradation of Diphenyl Ether and Transformation of Selected Brominated Congeners by Sphingomonas Sp. PH-07. Appl. Microbiol. Biotechnol. 77 (1), 187 (2007). doi:10.1007/s00253-007-1129-z.
- J.L. Domingo, Polybrominated Diphenyl Ethers in Food and Human Dietary Exposure: A Review of the Recent Scientific Literature, Food Chem. Toxicol. 50 (2), 238 (2012). doi:10.1016/j.fct.2011.11.004.
- K. Magulova and A. Priceputu, Global Monitoring Plan for Persistent Organic Pollutants (Pops) under the Stockholm Convention: Triggering, Streamlining and Catalyzing Global POPs Monitoring. Environ. Pollut. 217, 82 (2016) doi:10.1016/j.envpol.2016.01.022
- R.J. Law et al., Levels and Trends of PBDEs and HBCDs in the Global Environment: Status at the End of 2012. Environ. Int. 65, 147 (2014). doi:10.1016/j.envint.2014.01.006
- E. Barón et al., Bioaccumulation and Biomagnification of Classical Flame Retardants, Related Halogenated Natural Compounds and Alternative Flame Retardants in Three Delphinids from Southern European Waters. Environ. Pollut. 203, 107 (2015). doi:10.1016/j.envpol.2015.03.041
- S. Tait, M. Perugini and C. La Rocca, Relative Toxicological Ranking of Eight Polybrominated Diphenyl Ether Congeners Using Cytotoxicity, Chemical Properties and Exposure Data. Food Chem. Toxicol. 108, 74 (2017) doi:10.1016/j.fct.2017.07.041
- R. Song et al., Cytotoxicity and Gene Expression Profiling of Two Hydroxylated Polybrominated Diphenyl Ethers in Human H295R Adrenocortical Carcinoma Cells. Toxicol. Lett. 185 (1), 23 (2009) doi:10.1016/j.toxlet.2008.11.011
- L.G. Costa, R. de Laat, S. Tagliaferri and C. Pellacani, A Mechanistic View of Polybrominated Diphenyl Ether (PBDE) Developmental Neurotoxicity. Toxicol. Lett. 230 (2), 282 (2014). doi:10.1016/j.toxlet.2013.11.011.
- C.M. Makey et al., Polybrominated Diphenyl Ether Exposure and Thyroid Function Tests in North American Adults. Environ. Health Perspect. 124 (4), 420 (2016) 10.1289/ehp.1509755
- Y. He et al., Adipose Tissue Levels of Polybrominated Diphenyl Ethers and Breast Cancer Risk in Chinese Women: A case–control Study. Environ. Res. 167, 160 (2018). doi:10.1016/j.envres.2018.07.009
- UNEP, Guidance on the Global Monitoring Plan for Persistent Organic Pollutants, 2019, pp. 1.
- Z. Wu, W. Han, X. Yang, Y. Li and Y. Wang, Environ. Sci. Pollut. Res. 26 (23), 23219 (2019).
- R. Cruz, S.C. Cunha and S. Casal, Brominated Flame Retardants and Seafood Safety: A Review. Environ. Int. 77, 116 (2015). doi:10.1016/j.envint.2015.01.001.
- A. Besis and C. Samara, Polybrominated Diphenyl Ethers (PBDEs) in the Indoor and Outdoor Environments – A Review on Occurrence and Human Exposure. Environ. Pollut. 169, 217 (2012) doi:10.1016/j.envpol.2012.04.009
- X.Z. Meng, E.Y. Zeng, L.P. Yu, Y. Guo and B.X. Mai, Assessment of Human Exposure to Polybrominated Diphenyl Ethers in China via Fish Consumption and Inhalation. Environ. Sci. Technol. 41 (14), 4882 (2007). doi:10.1021/es0701560.
- H.G. Ni, C. Ding, S.Y. Lu, X.L. Yin and S.O. Samuel, Food as a Main Route of Adult Exposure to PBDEs in Shenzhen, China. Sci. Total Environ. 437, 10 (2012) doi:10.1016/j.scitotenv.2012.07.056
- J. Alexander, D. Benford, A. Boobis and Å. Bergman, EFSA J. 9 (5), 2156 (2011).
- EPA, An Exposure Assessment of Polybrominated Diphenyl Ethers (PBDE) (Final Report), U.S. Environ. Prot. Agency, Washington, DC, EPA/600/R-08/086F, 2010.
- O. Päpke, P. Fürst and T. Herrmann, Determination of Polybrominated Diphenylethers (PBDEs) in Biological Tissues with Special Emphasis on QC/QA Measures. Talanta. 63 (5), 1203 (2004). doi:10.1016/j.talanta.2004.05.033.
- J.P. Wu et al., Biomagnification of Polybrominated Diphenyl Ethers (PBDEs) and Polychlorinated Biphenyls in a Highly Contaminated Freshwater Food Web from South China. Environ. Pollut. 157 (3), 904 (2009) doi:10.1016/j.envpol.2008.11.001
- European Commission, 2014/118/EU: Commission Recommendation of 3 March 2014 on the Monitoring of Traces of Brominated Flame Retardants in Food (Text with EEA Relevance, Off. J. Eur. Union L65, 39 (2014).
- X. Seguí et al., Fuzzy Model for Risk Assessment of Persistent Organic Pollutants in Aquatic Ecosystems. Environ. Pollut. 178, 23 (2013). doi:10.1016/j.envpol.2013.02.014
- E. Barón et al., Occurrence of Hydrophobic Organic Pollutants (Bfrs and UV-filters) in Sediments from South America. Chemosphere. 92 (3), 309 (2013). doi:10.1016/j.chemosphere.2013.03.032.
- E. Duarte-Restrepo, K. Noguera-Oviedo, D. Butryn, J.S. Wallace, D.S. Aga and B.E. Jaramillo-Colorado, Spatial Distribution of Pesticides, Organochlorine Compounds, PBDEs, and Metals in Surface Marine Sediments from Cartagena Bay, Colombia. Environ. Sci. Pollut. Res. 28 (12), 14632 (2021). DOI:10.1007/s11356-020-11504-6.
- B.S. Avila, D. Pemberthy Mendoza and G.A. Peñuela, Occurrence and Distribution of Persistent Organic Pollutants (Pops) in the Atmosphere of the Andean City of Medellin, Colombia (2021). doi:10.21203/rs.3.rs-912972/v1.
- A. Saini et al., Environ. Pollut. 267, 115416 (2020). 10.1016/j.envpol.2020.115416
- C. Rauert et al., Atmospheric Concentrations of New Persistent Organic Pollutants and Emerging Chemicals of Concern in the Group of Latin America and Caribbean (GRULAC) Region. Environ. Sci. Technol. 52 (13), 7240 (2018). doi:10.1021/acs.est.8b00995.
- Codex Alimentarius, General Guidelines in Sampling. CAC/GL 50-2004, 2004.
- B. Magnusson and U. Örnemark, Eurachem Guide: The Fitness for Purpose of Analytical Methods – A Laboratory Guide to Method Validation and Related Topics, 2nd ed. (EURACHEM, 2014). https://www.eurachem.org/images/stories/Guides/pdf/MV_guide_2nd_ed_EN.pdf.
- F. Raposo and C. Ibelli-Bianco, Performance Parameters for Analytical Method Validation: Controversies and Discrepancies among Numerous Guidelines. TrAC - Trends Anal. Chem. 129, 115913 (2020). doi:10.1016/j.trac.2020.115913.
- A. Valverde, A. Aguilera and A. Valverde-Monterreal, Practical and Valid Guidelines for Realistic Estimation of Measurement Uncertainty in multi-residue Analysis of Pesticides. Food Control 71, 1 (2017). doi:10.1016/j.foodcont.2016.06.017.
- T. Pihlström et al., “Analytical Quality Control and Method Validation Procedures for Pesticide Residues Analysis in Food and Feed,” SANTE/12682/2019, 2019.
- ISO, Water Quality — Estimation of Measurement Uncertainty Based on Validation and Quality Control Data (11352:2012). (2012). https://www.iso.org/standard/50399.html.
- B. Magnusson, T. Näykki, H. Hovind, M. Krysell and E. Sahlin, Handbook for Calculation of Measurement Uncertainty in Environmental Laboratories, Nordtest Report TR 537. (2017). http://www.nordtest.info/wp/2017/11/29/handbook-for-calculation-of-measurement-uncertainty-in-environmental-laboratories-nt-tr-537-edition-4/.
- F. Raposo, Evaluation of Analytical Calibration Based on least-squares Linear Regression for Instrumental Techniques: A Tutorial Review. TrAC - Trends Anal. Chem. 77, 167 (2016). doi:10.1016/j.trac.2015.12.006.
- E. Soboleva, N. Rathor and A. Mageto, Estimation of Significance of ‘matrix-induced’ Chromatographic Effects, in Principles and Practices of Method Validation, edited by A. Fajgelj and A. Ambrus (Royal Society of Chemistry, 2007), p. 138. doi:10.1039/9781847551757.
- J. Corley, Best Practices in Establishing Detection and Quantification Limits for Pesticide Residues in Foods, in Handbook of Residue Analytical Methods for Agrochemicals, edited by P.W. Lee, 2nd ed. (Wiley, 2003), Vol. 1, p. 1.
- E. Bernal, Limit of Detection and Limit of Quantification Determination in Gas Chromatography, in Advances in Gas Chromatography, edited by X. Guo (InTech, Rijeka, Croatia, 2014), Vol. 3, pp. 57–63. doi:10.5772/57341.
- W.J. Youden and E.H. Steiner, Statistical Manual of AOAC INTERNATIONAL (AOAC, Gaithersburg, MD, 1975).
- E. Karageorgou and V. Samanidou, Youden Test Application in Robustness Assays during Method Validation. J. Chromatogr. A 1353, 131 (2014). doi:10.1016/j.chroma.2014.01.050.
- Y. Vander Heyden, A. Nijhuis, J. Smeyers-Verbeke, B.G.M. Vandeginste and D.L. Massart, Guidance for robustness/ruggedness Tests in Method Validation, J. Pharm. Biomed. Anal 24 (5–6), 723 (2001). doi:10.1016/S0731-7085(00)00529-X.
- EPA, Method 1614A: Brominated Diphenyl Ethers in Water, Soil, Sediment, and Tissue by HRGC/HRMS (2010). https://www.epa.gov/sites/default/files/2015-08/documents/method_1614a_2010.pdf.
- M.M. Rahman, A.M. Abd El-Aty and J.H. Shim, Matrix Enhancement Effect: A Blessing or A Curse for Gas chromatography?—A Review. Anal. Chim. Acta. 801, 14 (2013) 10.1016/j.aca.2013.09.005