
 ?Mathematical formulae have been encoded as MathML and are displayed in this HTML version using MathJax in order to improve their display. Uncheck the box to turn MathJax off. This feature requires Javascript. Click on a formula to zoom.
ABSTRACT
Academic dismissal policies are increasingly implemented to promote academic success, with existing empirical evidence mostly restricted to short-run outcomes. This study examines long-term academic outcomes of academic dismissal for two cohorts of first-year bachelor students in Economics and Business at a Dutch university. Using administrative records, regression discontinuity design estimates suggest that academic dismissal does not relate to a difference in the propensity of graduation, nor to a change in study delay, when comparing students around the academic dismissal threshold. Not meeting this credit-threshold forces students to leave, and most decide to re-enroll in the same (43.4%) program elsewhere or at least within the academic domain (41.9%). Thus, while academic dismissal forces students to switch, its intended purpose of redirecting students to a different field of study is not observed. Implications for why academic dismissal might not deliver on the intended efficiency or effectiveness gains are discussed.
1. Introduction
Enrollment in higher education has increased substantially around the world. Over the course of the first decade of the 21st century, tertiary education participation rates rose by 10 percentage points or more in several regions including the US, Europe, East Asia, and Latin America (Scott-Clayton and Sacerdote Citation2016; Van Klaveren et al. Citation2018). This is accompanied by a substantial increase, in absolute figures, in the number of incoming students who do not successfully finish their higher educational program. For example, the rate of completion across OECD countries in tertiary education is around 70% (OECD Citation2010). It is in this respect that so-called academic dismissal (AD) policies can play an important role. Academic dismissal is a performance-based ‘after the gate’ selection mechanism used to remove students who do not make satisfactory academic progress already early on from the educational program. Academic dismissal is often preceded by a process of academic warning, probation and/or suspension. From a theoretical point of view, academic dismissal policies can have heterogeneous implications with respect to student background characteristics, eliciting both mechanisms of encouragement (Benabou and Tirole Citation2000). The emerging body of (quasi-)experimental results with respect to academic probation are mostly negative with respect to both retention and graduation (Lindo, Sanders, and Oreopoulos Citation2010; Sneyers and De Witte Citation2018).
The intended purpose of AD policies is ostensibly to benefit not only the teacher and institution (i.e. retaining only talented and motivated students) but also the student (i.e. guiding a student to a program in which one is more likely to succeed) (Onderwijsraad Citation2008; de Koning et al. Citation2014). In the Netherlands, AD policies have been implemented ever since the late 1990s, with results suggesting that programs that installed such policies experienced higher first-year dropout and higher graduation rates (for the remaining students), when compared to similar programs without AD (Sneyers and De Witte Citation2017). By 2009, roughly half of the university bachelor programs had an AD policy in place (Dutch Inspectorate of Education Citation2010). This paper evaluates the long-term academic consequences by comparing educational trajectories for two cohorts (i.e. 2009 and 2010) of university bachelor students Economics observed on either side of the AD performance threshold that was in place.
1.1. Educational effects of academic dismissal policies
Although AD can have a large impact on selection, motivation and the overall academic career of students, only a handful of evaluations have been performed. In a recent meta-analysis, Sneyers and De Witte (Citation2018) found that AD generally increased first-year dropout, but had little positive effect on student learning outcomes. The credits-threshold at which a student receives a positive advice in the Netherlands varies per university and even per study program, but is usually set around two-thirds of the number of credits students should attain in the first year. Upon receiving a negative advice, the study must be terminated. Arnold (Citation2014) found that the introduction of an academic dismissal policy in the Netherlands increased first-year dropout with 6–7%, and concluded that student dropout is not reduced by an academic dismissal policy, but rather bringing it forward. de Koning et al. (Citation2014) found that the number of students in the Netherlands that were cleared to enter their second year was the same as before the introduction of the AD, even though student's overall credits were lower after AD was introduced. Eijsvogels et al. (Citation2015) also assessed the effect of the implementation of AD. The average number of credits was equal before and after the introduction of AD, implying little effect. For medical students in the Netherlands, it was found that AD does not lead to earlier dropout rates or higher completions and study rates in the following two years (Stegers-Jager et al. Citation2011). Finally, comparing trends in programs with or without AD, Sneyers and De Witte (Citation2017) find that introducing AD increased first-year dropout and overall graduation, but that student satisfaction reduced after the installment of AD policies. The aforementioned evaluations are all performed at the program-level and do not take into account that individual students differ importantly both between and within programs. In particular, whether or not a (strict) AD policy is in place can have important implications for the pool of students a program attracts in terms of academic ability and motivation. Furthermore, within a particular program, students who fail to meet the credits-threshold will likely also differ from students who pass; for example in terms of general academic ability.
1.2. Credit-thresholds and student switching patterns
An important reason for first-year dropout is that entering students, despite having graduated from secondary or high school, nonetheless lack the specific skills required for success in their chosen field of study (Scott-Clayton, Crosta, and Belfield Citation2014). It is, therefore, important to recognize that observed first-year switching behavior may reflect the iterative process of making an optimal higher education decision. Switching towards a different educational program might then be more optimal than continuing with the current educational program and will be more beneficial to both student and university. Academic Dismissal (AD) policies importantly influence this switching process. On the one hand, when the credit-threshold applied is appropriately chosen – as to distinguish students who will succeed from those that will eventually fail – it serves as additional information to the student in optimizing the switching process (i.e. bringing forward the correct decision to switch or dropout). On the other hand, problems occur when credit-thresholds are determined more arbitrarily. For example, when the credit-threshold is too lenient, some students will wrongly perceive that they possess the specific skills required for the program (i.e. delay the correct decision to switch or dropout). However, if the threshold is too strict, some students will be wrongly forced to quit the program (i.e. bring forward the wrong decision to switch or dropout).
We apply this to explain patterns of academic success in Dutch higher education, by comparing students within programs who are positioned just around the academic dismissal threshold at the end of year one on long-term academic outcomes (i.e. propensity to graduate, study duration). Furthermore, we examine whether AD policies primarily foster dropout, switches within the initial field of study or switches to a different field of study.
1.3. The Dutch higher education system
The general structure of the Dutch educational system is shown in . Dutch compulsory schooling law requires children to start with primary education in the year they turn five years old. Children are tracked into different secondary education levels upon finishing primary education (grade six). This decision is based on the test scores achieved on a standardized nation-wide test and on the advice of the primary school teacher. Children can be tracked into three secondary education levels: (1) pre-vocational education (4 years), (2) general secondary education (5 years), and (3) pre-university education (6 years). Pre-vocational education prepares children for vocational education, secondary general education prepares children for universities of applied sciences, and pre-university education prepares children for universities.
Figure 1. Dutch education system.
Note: This figure is taken from Cornelisz and Van Klaveren (Citation2018).
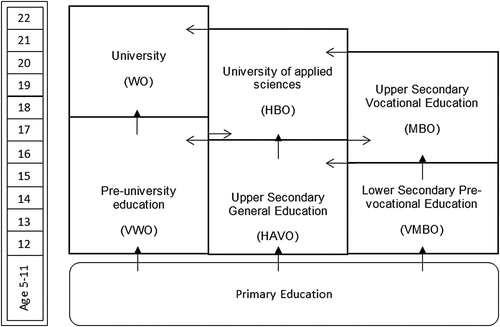
In general, students can enter university if they have passed the national exam in pre-university education or when they have successfully finished the first year of a university of applied sciences. There are some uncommon exceptions which also make students eligible for university (e.g. colloquium doctum), which are described in detail in Sneyers and De Witte (Citation2017). Students who enter university start with a bachelor's program (typically 3 years), after which they either enroll in a 1 (or 2) year(s) master's program or enter the job market. Students who receive their master's degree have the opportunity to start with a PhD or can enter the labor market.
1.4. Academic dismissal in the Netherlands
The Law Higher Education and Scientific Research requires all government-funded Dutch universities to advice students at the end of the first year on whether to continue in the program. This advice can be non-binding at some programs, but educational programs have increasingly installed a binding version, the so-called binding study advice (BSA). The goals of this selection after the gate policy are twofold in that it aims to ensure that higher education programs can continue with a group of talented and motivated students after the first year, and also to advice students already at an early stage whether or not the program is appropriate for them (Onderwijsraad Citation2008; de Koning et al. Citation2014). As such, the overarching objective of this policy in the Netherlands is to promote effective and efficient academic performance.
Dutch students in higher education can earn in total 60 credits each academic year. Setting the academic dismissal threshold is at the discretion of the institution (de Koning et al. Citation2014), varies across educational programs, but is usually around two-thirds of the total (i.e. 40 credits) (Dutch Inspectorate of Education Citation2010). For the educational programs considered in this study, students receive academic dismissal if they obtain less than 45 credits in their first year. When academically dismissed, students have the option to either enroll in another higher education program – at the same or different institution – to wait (often 3 calendar years) for when they are allowed to re-enroll, or to dropout from higher education altogether.
While such academic dismissal at the end of the first year is similar to polices observed in other countries, a notable difference with other systems is that – for example in Canada and the United States – these systems are often based on grade point average (GPA) instead of credits. These policies are then often also accompanied by a system of academic counseling, probation and/or suspension, as to improve GPA and avoid ultimate dismissal (Lindo, Sanders, and Oreopoulos Citation2010; Ost, Pan, and Webber Citation2018). Furthermore, whereas academic dismissal in the Netherlands pertains to a particular program only, similar policies in other countries often apply to enrollment at a specific higher education institution.
2. Method
2.1. Participants
This study includes all 1707 first-year students that entered an educational program offered by the Economics and Business Faculty of the University of Amsterdam in the academic year 2009/2010 and 2010/2011. For these years, the academic dismissal threshold for all educational programs at this faculty was set at 45 out of 60 credits obtained at the end of the first year. The average age of these students upon entering the program was 19.05 years (, range 16–35 years), and a slight majority were male (922, 54.0%) with 785 (46.0%) female. Background is defined using the definition of the Netherlands Statistics, which defines Dutch background as both parents being born in the Netherlands. The majority (1383, 81.0%) have a Dutch background, with 324 (19.0%) indicating a non-Dutch (1st or 2nd generation) migration background. For these students, we observe first-year performance measured in credits, graduation and study duration outcomes until August 2017, which implies that we observe 8 (7) academic years for students who started in 2009/2010 (2010/2011). This observation window is sufficient to observe completed education spells, given the nominal three-year duration of a bachelor program.
2.2. Materials and procedure
This study combines student-level academic performance data on credits obtained for both cohorts from the aforementioned university with individual-level registration data from Statistics Netherlands.Footnote1 The university data contain information on academic dismissal, student enrollment and performance in the first year for the academic years 2009/2010 and 2010/2011. The registration data provide background characteristics, with information on pre-university academic track and grade point average (GPA), age, gender, and ethnicity. These data furthermore provide longitudinal information on individual graduation status and study duration, together with the educational program and institution a student is enrolled at in any of the years considered.
3. Results
3.1. Statistical analyses
We start with estimating an Ordinary Least Squares (OLS) model and compare graduation status and study duration between students who do and do not meet the academic dismissal threshold in July of the academic year:(1)
(1) Indicator variable T equals 1 when the student has earned fewer than 45 credits and zero otherwise,
represents the GPA-score achieved in pre-university education, and
represents a set of student and faculty controls. To control for student background and ability differences we estimate the outcome difference at the academic dismissal credit cutoff by estimating the following regression discontinuity models (Angrist and Pischke Citation2008):
(2)
(2)
In this equation, function g represents the linear, quadratic or cubic trend relationship of the forcing variable that best fits the observed trend relationship to the right and left of the cutoff. We consider a particular trend relationship as best fit when the inclusion of an additional higher order polynomial does not improve the model fit.
A similar estimation strategy has been applied for evaluating the impact of academic probation in Canada (Lindo, Sanders, and Oreopoulos Citation2010). In contrast to a regression discontinuity evaluation design, variation around the academic dismissal threshold is not necessarily exogenous. Students and teachers are well aware that continuation in the educational program after the first year is contingent on surpassing the pre-established credit-threshold. Presumably, it is the group of relatively better students who – when just below the academic threshold near the end of the year – will display such beneficial behavior and will be more likely to end up just above the cutoff after doing the retake exams. In this study, we should therefore recognize that a negative and significant can indicate that students are selectively surpassing the threshold and – hence – does not only represent the effect of academic dismissal. Then, if
is found to be zero (or positive), this implies that the potential negative selection bias assumption above – with respect to receiving academic dismissal – either is not present or that the endogenous selection bias is (more than) offset by a positive effect of receiving academic dismissal (e.g. by enforcing a switch to a program which better suits their ability or preferences or by acting as an important wake-up call). The latter outcome could be perceived as relatively desirably. Yet, if
is found to be negative, it is not clear to what extent there is either a negative selection bias and/or whether the effect of receiving academic dismissal is negative, making it more difficult to assess this result from a policy perspective.
Furthermore, given the explicit intention of the academic dismissal policy to reallocate students to an academic program more suited to individual capacities and preferences, we also empirically examine in which fields of study and programs students are observed in the year after having received academic dismissal.
3.2. Descriptive statistics
provides descriptive statistics for the cohorts of students from the Economics and Business Faculty of the University of Amsterdam considered in this study. Both student cohorts are of equal size and only the pooled descriptive statistics are shown, as there were no significant differences in background characteristics between both cohorts. For the 1079 students who started with the bachelor program directly after finishing pre-university education, we could retrieve the Grade Point Average of the school-leaving exit examination. The grading scale of this examination is for each subject from 1 (lowest) to 10 (highest), and the table shows that the average GPA is 6.8. shows that 48% of all 1707 first-year students obtained fewer than the required 45 credits at the reference date in July.
Table 1. Descriptive student characteristics.
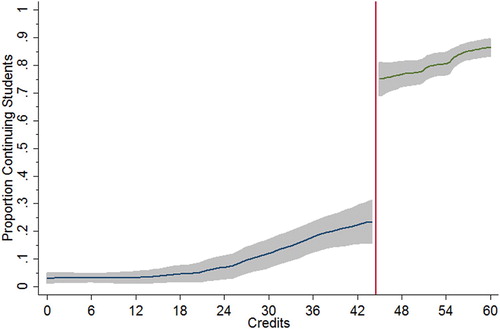
shows, for the student population considered here, the proportion that continues the educational program after year one. The figure reveals a relatively fuzzy discontinuity, even though the academic dismissal policy stipulates that students who obtained less than the required threshold of 45 credits ought to be academically dismissed. This fuzziness is due to (1) the right students have to appeal for a dismissal waiver, and (2) potential delays in grade reporting. Appeals for academic dismissal waivers are only occasionally granted by the Board of Examiners, such that the bulk of observed continuations to the left of 45 credits can be explained by the relatively early announcement date of academic dismissal at which teachers still had to enter and report (some) grades (e.g. from resit exams). What is important for the objective of this study is this first-stage descriptive result that – while not strictly defining actual academic dismissal – a strong discontinuity does exist around the academic dismissal threshold in terms of continuation of the bachelor program in year 2.
Figure 2. Student proportion that continues the program by first-year credits obtained.
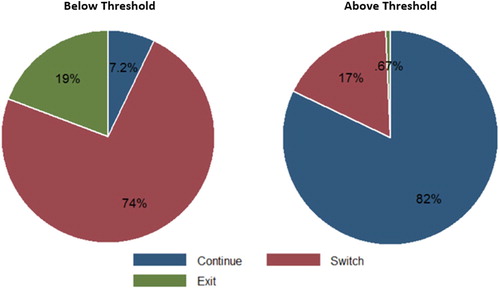
, shows – separately for the group who did and did not meet the academic dismissal (AD) threshold in July – whether students continued the educational program, switched to another educational program or dropped out from higher education entirely. Of the 811 students who scored below the AD threshold, 74% switched to another program in higher education and 19% dropped out of higher education entirely. Around 7% of these students could continue the educational program due to receiving late course credits of resits or the aforementioned exemption possibilities. Students who met the AD threshold in July of the first year mostly continued the educational program in the second year, but 17% of students still chose to switch to a different educational program. Only a few students (0.67%) decided to leave higher education entirely, despite having passed the AD threshold in the first year.
Figure 3. Observed transitions for students below and above the academic dismissal threshold.
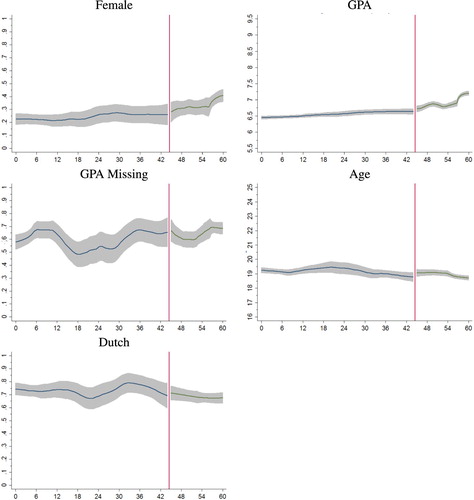
shows the relationship between student characteristics and credits earned. The figure shows that the background characteristics of students are to some extent related to credits earned when comparing averages of the groups on both sides of the academic dismissal threshold. Yet, around this cutoff none of these background characteristics are statistically significantly different. Therefore, estimated academic outcome differences around this cutoff – presented in the following subsections – are not driven by observed differences in student background characteristics.
Figure 4. Student characteristics by first-year credits obtained.
3.3. Findings academic degree
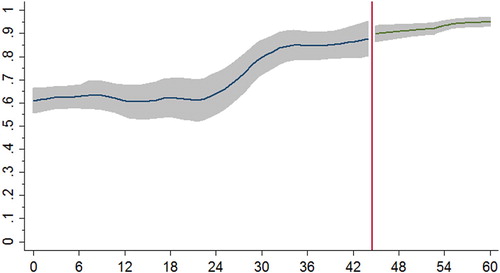
shows a kernel-plot of the proportion of students who have obtained a degree by the running variable credits earned. indicates that the student proportion obtaining a degree is – from 24 credits onward – an increasing function of credits earned. As expected, the proportion of students with a degree is on average lower for students who failed to meet the academic threshold in year 1, but around the cutoff this difference is not significantly different.
Figure 5. Student proportion that graduates by first-year credits obtained in first year.
To obtain more accurate and precise estimates of the outcome difference – both at the cutoff and between both academic dismissal groups – we estimate Equations (Equation1(1)
(1) ) and (Equation2
(2)
(2) ). Let z represent the re-scaled running variable (i.e. z = C−45). The Wald estimation model indicated that the quadratic and linear trend relationship approximated the trend relationship of the forcing variable best:Footnote2
shows the OLS estimates, without the trend relationships included in the regression (i.e. Columns 2 and 3), and the baseline regression discontinuity estimates (i.e. Columns 4, 5 and 6). The OLS results presented in Column 2 show that, for students who fail to reach the academic dismissal threshold of 45 credits, the proportion obtaining a university degree is 26 percentage points lower than for students who earn at least 45 credits at the end of year 1. The inclusion of background characteristics does not affect the estimated association between meeting the academic dismissal threshold and obtaining a degree. These estimation results reflect outcome differences that may be driven by (un)observed student ability and background characteristics.
Table 2. Estimation results: degree.
When estimating the outcome difference around the academic threshold, there is in fact no statistically significant difference in obtaining a degree between the two groups on either side of the AD cutoff. Again, the inclusion of GPA and student controls increase the overall explained variance, but not so much the precision of the estimated coefficient of T. shows that the observed trend relationships are markedly different for students who – in the first year – obtained 24 credits or less and students who obtained more than 24 credits. This indicates that trend differences do not seem to be driven by academic dismissal at the cutoff point of 45 credits.
3.4. Findings study duration
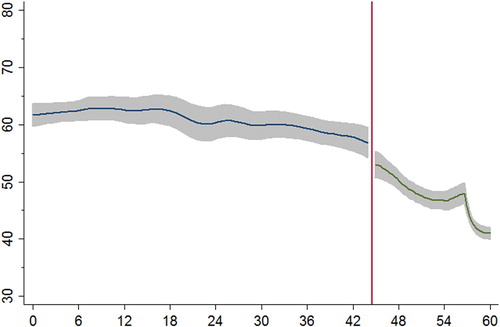
Academic dismissal may not only influence the likelihood of obtaining a degree but also affect study duration. Of the 1707 students considered in this study, 1538 (or 90%) students obtain a bachelor degree within the observation window considered. For these 1538 students, plots the study duration in months by the running variable first-year credits obtained. We note that nominal study duration for a bachelor degree is 36 months. The figure shows that the study duration for students failing to meet the AD threshold is approximately 60 months and substantially longer than this nominal duration. Whereas duration until degree is notably shorter for students meeting the AD threshold in year 1, it is still the case that even students who obtain all 60 credits in their first year take on average somewhat longer to obtain their degree than 36 months. Furthermore, the figure shows that average duration until degree for students just at the right of the cutoff is only slightly lower than that of students just to the left of the cutoff, but this difference is not statistically significant.
Figure 6. Duration until degree in months by first-year credits obtained.
The Wald estimation model indicated that a quadratic and cubic trend relationship approximated the trend relationship of the forcing variable best:
shows that the average study duration for students who obtained a degree after failing to meet the AD threshold in year 1 is 13.7 months longer than students obtaining a degree after passing the AD threshold in year 1, when controlling for student background characteristics. The estimation coefficient remains positive for students around the cutoff, but is much smaller and not statistically significant. In order to evaluate whether the estimated study duration coefficients are affected by selection into a degree, plots the proportion of students for whom study duration was missing by obtained credits in the first year. Essentially, this figure is the mirror image of and implies that selectivity of observing study duration beyond 24 credits can be accurately described by a linear trend. As such, the discontinuity estimates are not influenced by non-linear selection into a degree or selective observations of study duration around the academic threshold.
Figure 7. Student proportion with missing duration by first-year credits obtained.
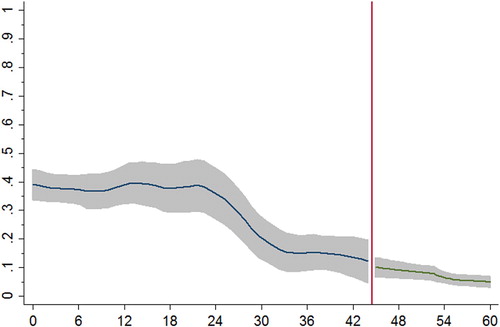
Table 3. Estimation results: study duration.
3.5. Findings switching between or within field of study
When students below the academic dismissal threshold switch educational program, they can switch between and within fields of study and within and between universities. shows the reallocation of switching students in year 2. Of the 811 students who failed to meet the AD threshold, 156 students (or 19%) left higher education entirely, 58 students (or 7.2%) continued in the education program (e.g. due to dismissal waiver or credits earned in retakes) and 597 students switched education programs and/or institutes. Of these students, 43.4% switch to the same academic program, 41.9% switch to an adjacent field of study and only 7.5% of the students switch to a distinctively different field of study. When students switch universities, 59.8% go to the same academic program (i.e. 259/(597–164)) and 19.9% of the students enroll in an adjacent field of study (i.e. 86/(597–164)). Therefore, 85.3% of the students who are below the academic dismissal threshold do not make a major academic switch.
Table 4. Reallocation in year 2 of switching students.
4. Discussion
Academic dismissal policies make it possible for universities to dismiss students from an educational program when it is expected, on the basis of their first-year performances, that they do not successfully finish their study or obtain a degree timely. This paper evaluates the long-term effect of the Dutch academic dismissal policy on the students' probability of obtaining a degree and study duration. We consider two student cohorts (1707 students) who started a bachelor program in the academic years 2009/2010 and 2010/2011 at the Economics and Business Faculty of the University of Amsterdam. Students who obtain less than 45 credits in their first year are academically dismissed and can either switch to another field of study, can switch to the same field of study at another university or can leave higher education entirely. We observe that students who fail to meet the academic dismissal threshold at the reference date in year 1 (July), continue with a study in higher education in 81.2% of the cases.
Simply comparing these students exposed to academic dismissal to students who were not reveals a lower propensity to obtain an academic degree and a longer study duration until graduation, but this difference may well be driven by underlying differences in student characteristics instead (e.g. ability). Therefore, we estimated a regression discontinuity model; thereby examining if students around the cutoff also differ with respect to obtaining an academic degree and study duration. These regression discontinuity estimates show that there is in fact no statistically significant difference in obtaining a degree or study duration between students around the academic dismissal threshold. While experiencing a delay in nominal terms, both their propensity to graduate and expected study duration are very much comparable to (non-switching) students who barely avoided academic dismissal in the first-year. As such, it seems that the academic dismissal policy did not significantly affect long-term academic outcomes of students, when compared to their counterparts around the academic dismissal threshold.
4.1. Student response to academic dismissal
These results are qualitatively different from emerging evidence on academic probation and dismissal in other contexts (mostly North America), which point to generally negative implications concerning retention and graduation (Lindo, Sanders, and Oreopoulos Citation2010; Ost, Pan, and Webber Citation2018). The results found in these studies tend to confirm two of the predictions of the Benabou and Tirole (Citation2000) model of performance standard in which academic dismissal would generate both a discouragement effect (students dropout from higher education) and an encouragement effect (increased performance of re-enrolling students). The results presented here, however, do not point to an increase in dropping out behavior, nor to improved performance for students who are academically dismissed. Several explanations can be hypothesized for the different results found in this particular study. Students can experience academic dismissal as a serious warning and put in more effort after switching studies, but this might equally apply to students who barely avoid academic dismissal, thereby supporting the empirical findings of no differences around the academic dismissal threshold. As such, one way to think of this is that – while academic dismissal was the only formal policy in place here – all students around the cutoff experience a sense of implicit academic probation. Alternatively, students exposed to academic dismissal may also switch to studies that better matches their abilities and preferences, such that this reallocation offsets any initial delay incurred by having to start all over again. Alternatively, students can decide to switch to another university in the same academic program (e.g. Economics), receive exemptions and do not have to start all over again. Doing so enables them to avoid delay at the risk of experiencing again that this particular program is too challenging. For the student cohorts observed in this study, we find that a large majority of switching students (85.3%) actually stay within the same academic domain and a sizable proportion (43.4%) re-enrolls in the same academic program at a different university.
4.2. Educational policy initiatives and academic dismissal
From a policy perspective, academic dismissal in the Netherlands was explicitly installed as a means to identify early whether a student is not suited for the program, such that a student can reorient oneself towards a more appropriate bachelor program without lingering around in a program that is likely to turn out unsuccessful.Footnote3 The switching results reported in this study suggest that this specific intended policy objective of reallocation to a different study is not realized for the two cohorts of students considered here. Upon receiving academic dismissal, most students switch to a similar program, or even the same program offered at a different university. This raises an important concern and fuels the debate about whether AD policies are indeed successful in raising academic performance and – if so – what the so-called mechanisms of action are. If AD is not operating through a more optimal allocation of students to specific programs, but acts more as a warning signal instead, it begs the question whether the requirement to either re-enroll in a different program in the same program at a different university is necessary – or even desirable – in the first place.
Understanding the implications of academic dismissal policies is particularly relevant, given that increasing higher educational attainment and student success is very high on the agenda of, for example, the EU Member States (Sneyers and De Witte Citation2018). Both its relative effectiveness and actual mechanisms of actions need to be properly understood, as to evaluate AD to other policies and interventions, such as academic advising, mentoring and tutoring, course placement programs, student success courses, early alert systems, first-year transition programs, financial aid and learning communities.Footnote4 Given the current heterogeneity of findings observed across and within empirical evaluations of the effect of academic dismissal policies, it is important to interpret results in light of their specific educational context and in terms of their operating mechanisms.
4.3. Limitations and suggestions for future research
It is thus important to recognize that the empirical results presented here may be specific to both the Dutch higher education context and field of educational programs considered here (i.e. Economics), but may also be strongly related with the geographical location of the higher education institution. The faculty considered in this study is surrounded by several neighboring universities, implying that students who are academically dismissed can relocate relatively easily to the same academic program at a different university. These students thus have several outside options nearby, which may cancel out the potential negative effects of academic dismissal on academic success. This could suggest that students enrolled at other universities might not have similar outside reallocation options and that the potential negative effects of academic dismissal may therefore be larger for students enrolled at more geographically isolated universities. As such, there are even important aspects with respect to generalizing these findings within the Dutch educational context.
Even though the findings show that students are not harmed by the academic dismissal policy in terms of graduation opportunities, they also show that the threshold is not accurately chosen, because the expectation that students just below the threshold will not obtain an academic degree in this academic program is incorrect. Under the assumption that the availability of outside options would not cancel out the potential negative effect of academic dismissal, our results might indicate that a more appropriate threshold would perhaps be 24 credits, given that at this threshold there appears to be a natural trend difference and a threshold effect of ability and/or study behavior differences on the propensity to graduate. As such, the results presented here beget to examine if the findings of this study are replicated for students enrolled in different programs with different academic thresholds and at more geographically isolated universities. Future research can exploit such variation to better understand the mechanisms along which academic dismissal policies operate, the heterogeneity with respect to student characteristics, academic domains, geographical locations, and educational systems.
Acknowledgments
The authors thank the University of Amsterdam for making available the data on academic dismissal for the cohorts considered in this study.
Disclosure statement
No potential conflict of interest was reported by the authors.
Notes
1 These two sources of data were linked and anonymized by Statistics Netherlands and made available remote access to the researchers of this paper.
2 We note that other functional form combinations for the trend relationships yielded similar estimation results, both in terms of significance as in coefficient.
3 Academic dismissal is described in Article 7.8b of the Law on Higher Education and its intended purpose of redirecting students to other programs was recently reaffirmed by the Minister of Education in 2016 in response to questions from the House of Representatives (see: https://zoek.officielebekendmakingen.nl/kst-31288-553.html).
4 See for an important recent meta-analysis on the effectiveness of such policies (Sneyers and De Witte Citation2018).
Related Research Data
References
- Angrist, J. D., and J. S. Pischke. 2008. Mostly Harmless Econometrics: An Empiricists Companion. Princeton: Princeton University Press.
- Arnold, I. J. M.. 2014. “The Effectiveness of Academic Dismissal Policies in Dutch University Education: An Empirical Investigation.” Studies in Higher Education 40: 1068–1084. doi: 10.1080/03075079.2013.858684
- Benabou, R., and J. Tirole. 2000. Self-Confidence and Social Interactions. Working Paper 7585, National Bureau of Economic Research.
- Cornelisz, I., and C. Van Klaveren. 2018. “Student Engagement with Computerized Practicing: Ability, Task Value and Difficulty Perceptions.” Journal of Computer Assisted Learning 34: 828–842. doi: 10.1111/jcal.12292
- de Koning, B. B., S. M. Loyens, R. M. Rikers, G. Smeets, and H. T. van der Molen. 2014. “Impact of Binding Study Advice on Study Behavior and Pre-University Education Qualification Factors in a Problem-Based Psychology Bachelor Program.” Studies in Higher Education 39 (5): 835–847. doi: 10.1080/03075079.2012.754857
- Dutch Inspectorate of Education. 2010. Bindend Studieadvies: Een Landelijk Beeld.
- Eijsvogels, T. M. H., R. Goorden, W. Bosch van den, and M. T. E. Hopman. 2015. “The Binding Study Advice in Medical Education: A 2-Year Experience.” Perspectives on Medical Education 4: 39–42. doi: 10.1007/s40037-015-0164-1
- Lindo, J. M., N. J. Sanders, and P. Oreopoulos. 2010. “Ability, Gender, and Performance Standards: Evidence from Academic Probation.” American Economic Journal: Applied Economics 2: 95–117.
- OECD. 2010. How Many Students Drop Out of Tertiary Education? Technical Report.
- Onderwijsraad. 2008. Een Succesvolle Start in Het Hoger Onderwijs. Technical Report.
- Ost, B., W. Pan, and D. Webber. 2018. “The Returns to College Persistence for Marginal Students: Regression Discontinuity Evidence from University Dismissal Policies.” Journal of Labor Economics 36 (3): 779–805. doi: 10.1086/696204
- Scott-Clayton, J., P. Crosta, and C. Belfield. 2014. “Improving the Targeting of Treatment: Evidence from College Remediation.” Educational Evaluation and Policy Analysis 36 (3): 371–393. doi: 10.3102/0162373713517935
- Scott-Clayton, J., and B. Sacerdote. 2016. “Access to Higher Education: Introduction to the Special Issue.” Economics of Education Review 51: 1–3. doi: 10.1016/j.econedurev.2015.12.001
- Sneyers, E., and K. De Witte. 2017. “The Effect of an Academic Dismissal Policy on Dropout, Graduation Rates and Student Satisfaction. Evidence from The Netherlands.” Studies in Higher Education 42 (2): 354–389. doi: 10.1080/03075079.2015.1049143
- Sneyers, E., and K. De Witte. 2018. “Interventions in Higher Education and their Effect on Student Success: A Meta-Analysis.” Educational Review 70 (2): 208–228. doi: 10.1080/00131911.2017.1300874
- Stegers-Jager, K. M., J. Cohen-Schotanus, T. A. W. Splinter, and A. P. N. Themmen. 2011. “Academic Dismissal Policy for Medical Students: Effect on Study Progress and Help-Seeking Behaviour.” Medical Education 45: 987–994. doi: 10.1111/j.1365-2923.2011.04004.x
- Van Klaveren, C., K. Kooiman, I. Cornelisz, and M. Meeter. 2018. “The Higher Education Enrollment Decision: Feedback on Expected Study Success and Updating Behavior.” Journal of Research on Educational Effectiveness 1–23.