
ABSTRACT
The proportion of women tends to decrease the higher the academic rank, following a global pattern. Sweden has taken comprehensive measures to decrease this gap across 30 years, and many countries are following a similar path. Yet today only 27% of faculty with the rank of professor in Sweden are female. A common explanation is that academia is biased against women. According to this hypothesis, women have to reach higher levels of scholarly achievement than men to be appointed to the same academic rank. Publication metrics when attaining the rank of professor were compiled from the Web of Science for samples of the whole population of 1345 professors appointed at the six largest universities in Sweden during a six-year period. Men had significantly more publications and citations in both medicine and in the social sciences, rejecting the hypothesis that women are held to a higher scholarly standard in this context.
Introduction
The majority of university students in Sweden are female, but the proportion of females amongst faculty members tends to decrease as academic rank increases. Across all disciplines the majority of professor-rank faculty in Sweden are male (Statistics Sweden Citation2015). This is also a consistent global pattern (Lariviere et al. Citation2013). Although Sweden has been implementing policies to increase female representation in academia for more than 30 years, its proportion of females amongst professor-rank faculty remains lower (27%) than amongst junior faculty (47%), doctoral students (48%), and freshmen (59%) (Universitetskanslersämbetet Citation2018). A common explanation is that females are disadvantaged in various ways, which may manifest as the proverbial ‘glass ceiling’ (e.g. Bukstein and Gandelman Citation2019; Yousaf and Schmiede Citation2016). Accordingly, academia is described as a patriarchal and male-dominated system by academics (e.g. Fahlgren Citation2013; Seierstad and Healy Citation2012; Sköld and Tillmar Citation2015, 16; Van den Brink and Stobbe Citation2014, 165) and politicians (Ericson et al. Citation2013; Justitiedepartementet Citation2016; Socialdemokraterna Citation2016). The former minister for higher education, Helene Hellmark Knutsson, stated that:
Although Sweden is world-leading when it comes to the proportion of women in the labour market, and although 60% of the students have long been women, three out of four professors are still men. We must have higher ambitions than that. In Swedish universities, women and men should be able to act on equal terms and have the same career opportunities. All too often have notions about the male genius trumped competence, and too often have internal recruitment and networks played a greater role than hard work. This is, in the long run, damaging for the quality of Swedish research. (Hellmark Knutsson Citation2017)Footnote1
However, evaluating sex bias in real-life situations is riddled with difficulties, mainly because of confounding variables that cannot be fully controlled. The male power-system is believed to permeate societies as a whole, which means that the sources of sex differences are partly to be found in the family, in school, and in any other milieu encountered (e.g. Anderson Citation2015; Nationalencyklopedin Citation2016). Thus, it cannot be determined how much specific factors might affect individuals’ interest, motivation, or perceived obstacles for an academic career. From this perspective, it has been argued that universally applied, ‘meritocratic values … militate against equal opportunity for women in a patriarchal society’ (Knights and Richards Citation2003, 214). In essence, the idea is that certain socially constructed notions, values, and practices reinforce each other to propagate an unequal power balance across demographic categories, such as sex (e.g. Gamble Citation2001; Walby Citation1990). As such, this theory is near impossible to test, since in real life these factors cannot be experimentally manipulated, and so their causality cannot be disentangled. Non-experimental longitudinal studies might however indicate the likelihood and direction of possible causal patterns.
One aspect can nevertheless be assessed without challenging the direction of causality. A sex bias in granting access to a desired position will manifest itself in preferentially hiring or promoting members of one sex at a higher rate than equally or more qualified members of the other sex. The male power-system theory therefore predicts that females who reach the rank of professor will have objectively higher merits than males. Such a comparison can readily be made, because scientific publications are the central merit for this position, and publications can be quantified in terms of their number, their number of citations, and the status of the journals they are published in.
Here, we examine this hypothesis in the Swedish academic system. Sweden is ranked as one of the most sex-equal countries (World Economic Forum Citation2015) and has for a long time strived to increase equality in all domains of life. This makes Sweden particularly interesting as a forerunner for sex-equality policies and interventions, and an example of how these may play out in other countries. In Sweden, a university teaching position is termed ‘lektor’, while professor is reserved for the highest academic rank. Both lektor and professor are typically permanent positions, corresponding to tenured faculty in the US. The practical consequences of a higher rank are mainly higher salary and proportion of time available for research. Without external research funding, a lektor has commonly 0%–20% of full time available for research, while a professor typically has 30%–70%. The rank of professor is therefore attractive for academics devoted to research, and competition for such positions is high. The historical way to attain this rank is to apply for an open position as professor at an academic institution, and be evaluated in competition with other applicants by at least two senior academics. An increasingly common route is to promote a PhD who has a permanent position as lektor to professor, which was made possible by a law passed in 1997 (Regeringen Citation1997). Applications for promotion are also peer-evaluated, typically by at least two professors at other institutions, but not in competition with other applicants. The application must also be supported by the applicant’s home institution, which has to provide the raise in salary and the time available for research.
One may argue that publication metrics are questionable as an index of scientific competence or quality. There may be legitimate causes for differences in productivity in terms of co-authorship, the type of data, how long it takes to complete a study and report it, and variation in publication standards across disciplines, for example. There are well-argued concerns about the validity of the journal impact factor metric with regards to evaluating individual scholars, according the Declaration on Research Assessment (sfdora.org). While these are serious problems for assessing individual scholars or comparing across disciplines and sub-disciplines (Knudson Citation2019; Ruscio Citation2016; West and Rich Citation2012; Wildgaard, Schneider, and Larsen Citation2014), they are inconsequential if comparisons are made within the same or similar disciplines or fields of study for the same time period. On the group level, bibliometric data have high criterion validity for the academic core goal to create and disseminate knowledge. Publishing more indicates you have created more knowledge and also made a greater effort to share it, and being cited and published in journals with higher impact factors indicate that experts in your area find this knowledge relevant and valuable (Braun et al. Citation2013; Lutter and Schröder Citation2016; Ruscio Citation2016; Ruscio et al. Citation2012). Publication metrics also have the advantage of being quantitative, reliable, and readily available in trustworthy, international databases. A remaining problem could be that the demographic category that characterises the group is not independent from all publication-related variables. We will consider this issue, as well as the particular metrics used, in the method section.
We also make the point that publication metrics are formally instituted and generally accepted as central criteria for evaluating academics that apply for a higher rank. Prospective applicants should therefore do their best to maximise their merits in these regards, even if they might have misgivings about their utility and validity. As such, the Hirsch-index (h-index in the following) can be argued to provide a healthy incentive, by accounting for both productivity and influence (Ruscio Citation2016). Other important metrics are scientific distinctions and research funding, although it may be argued that these are more subjective and prey to current and fleeting trends. Such data are scattered and difficult to obtain, and were for practical reasons not considered here.
By comparing the publication merits of each sex when being appointed to the rank of professor, we focus on the criteria for being hired as, or promoted to, the highest formal academic rank in Sweden. The magnitude of sex discrimination against female academics, based on the power-system theory, can thus be estimated by their greater scientific productivity. Specifically, we predict that females will have published more scientific papers that are more frequently cited and published in journals with higher impact factors, compared to males.
Method
Participant sample
Those appointed professors in the years 2009 through 2014 were identified through booklets issued in connection with the annual or bi-annual promotion ceremony, a tradition with medieval roots (Manning Citation2000). This source specifically lists those who are promoted to professor from a lower academic rank and includes all those individuals, regardless of their employment.Footnote3 This tradition is upheld at the five largest universities in Sweden, located in Lund, Gothenburg, Uppsala, Umeå, and Stockholm, as well as by Karolinska Institutet, a medical university and research institute. These six institutions are also the more influential, prestigious, research intensive, and successful in attaining research grants. They were home to 58.3% and 56.9% of all academics with the rank of professor in Sweden in 2008 and 2014, as detailed in . Their age, name, portrait, faculty membership, discipline, and field of research, and when they received their PhD was extracted from the booklets. Their apparent sex was determined by their first name and a qualitative assessment of their portrait picture in the booklet. This population consisted of 1406 individuals (477 female and 929 male) across 129 self-reported fields of research (). These fields were categorised into 32 academic disciplines (), based on traditional academic structure (Wikipedia Citation2018) and the faculty membership given in the booklets.
Table 1. Overview of the total population of professors in Sweden, in terms of both numbers of individuals and full-time equivalents, separately for all institutions and for those selected for the present study.
This population of just appointed professors should be set in relation to the entire population of professors at the beginning and end of the study period, both at the selected institutions and in Sweden as a whole. Annual official figures are available from Statistics Sweden, a governmental authority, but differ somewhat across years in the specific variables and parameters given. For example, professors may be represented as numbers of individuals or as full-time equivalents (FTE), which corresponds to the number of work hours, and these figures may be reported across the sexes or separately for each sex. compiles these data and their sources. Some data points missing from these statistics are estimated (denoted with italics). It can be noted from these figures that (1) the number of professors has increased by 36.5% and their FTE by 21.0% during these six years, (2) the FTE/number ratio has decreased from ∼0.9 to ∼0.8, which probably reflects a higher proportion of active but probably part-time senior professors (65+ years), and (3) the proportion of female professors has increased from ∼0.2 to ∼0.25 and reaches above 0.3 for the newly recruited in this period. There is an additional longer trend, by which the FTEs of both sexes have increased by almost equal numbers since 2004 (female 630 FTE and males 600 FTE), although there were initially more than 4 males for each female (Universitetskanslersämbetet Citation2015, 96). Importantly, the estimated replacement for the selected institutions across the study period, given the general increase and the retirement ratio, amounts to 554 females and 1177 males, and has an almost identical proportion of females (32.9%) as the study population (33.2%). The study population is slightly smaller than the estimated replacement (86% females and 79% males), which is likely due to an overestimation of the replacement because of an increase in retired but still active senior professors. We could not account for senior professors because the figures provide no indication of how large a proportion of professors remain active, or their mean age.
Comparing the age of the populations provides a check on the retirement estimates. The mean age in the whole population of current professors is 57.0 years (Statistics Sweden Citation2015, 26), while the mean age when being appointed in the present study was 52.3 years for females and 50.0 years for males, which given that they will retire at 65 corresponds to expected mean ages of 58.6 for females and 57.5 for males.
For assessing a group difference, it is essential that the groups be comparable. First, we therefore excluded 61 persons without an academic career proper, as indicated mainly by no or very few publications (n = 29), adjunct, honorary, visiting, or other forms of temporary professorships (n = 13), or not having a PhD (n = 19). About half of these excluded professors belong to the visual or performing arts (n = 29). Adjunct professor is a temporary, externally funded position, typically by a company or NGO. The remaining 1345 professors consisted of 446 females and 899 males. shows that the sex proportion is essentially the same across the study years.
Table 2. Numbers of each sex and the proportion of female appointed to professor in the study period, after excluding those without an academic career proper.
Second, disciplines tend to differ in their publication patterns and several other aspects, and the demographic category (sex) must therefore be proportional across disciplines so that these peculiarities do not skew the results if they are confounded with sex. Third, each group has to be large enough to allow statistical testing of possible group differences. Apart from the fact that a very small number or particularly low proportion of either sex makes group comparisons unreliable, it has been argued that a discipline dominated by one sex might provide a less favourable environment for the other sex (Yousaf and Schmiede Citation2016). With these considerations in mind, we excluded disciplines with a sex ratio greater than 2/3, namely Earth sciences, Engineering and technology, Physics, Chemistry, and Economics, as well as 19 disciplines with fewer than 30 individuals (see ). Biology had a relatively large sample size as well as an equal sex distribution, but was excluded because it is the only discipline within the Natural sciences to fulfil these criteria, and can therefore not form a cluster of similar disciplines. Most disciplines that have sufficient numbers of individuals as well as a fairly even sex distribution belong to the Social Sciences. Such a cluster was therefore formed in addition to Medicine, including Education, Law, Linguistics Political Science, and Psychology. Linguistics is traditionally part of the humanities, but was included because it fulfils the criteria and is in many respects similar to other Social Sciences disciplines.
Pilot work revealed that collecting publication metrics was prohibitively time-consuming, given the necessary error checking and quality control described below to analyse the full sample of professors. The average time per individual was in excess of two hours. Random samples of 130 participants of each sex was set as a goal, allowing for attrition and given the possibility of aggregating Medicine and the Social Sciences. We reasoned that a minimum 10% population sample should be representative, and calculated that 106 individuals per group is required to detect a meaningful effect on the order of 0.3 SD (one-sided) with a power of 0.7. Each participant was assigned a unique random integer, and were then sorted according to this integer, separately by sex and discipline cluster (Medicine and the Social Sciences). The first 50 of each sex were selected for Medicine, and the first 80 for the Social Sciences.
The publication searches revealed information that reclassified or excluded some participants, according to the same criteria as employed after the initial sampling (i.e. adjunct, honorary, and visiting professors). The final subsamples consisted of 148 participants from the Social Sciences (including Linguistics) and 83 from Medicine, corresponding to 34.9 and 18.4% of these populations. These are listed per discipline in , considering the first five a Social Sciences cluster.
Table 3. Description of initially selected sample and the numbers found in Web of Science, compared with the total population belonging to these disciplines.
Publication data
For the present purposes, it was desirable to have several measures that capture different and partly independent aspects of scientific achievement through publication metrics, such as scientific quality, mere productivity, and impact on the research community. Citation metrics at the author and article level are generally accepted as meaningful confirmatory evidence for use in qualitative promotion evaluations (Hicks et al. Citation2015; Knudson Citation2019). Hundreds of metrics exist, although they are all based on the number of publications and the number of citations, and in some cases properties of the publisher or journal (Ruscio et al. Citation2012; Wildgaard, Schneider, and Larsen Citation2014). Because comparisons could be made for groups within similar institutions, areas of research, and for the same period of time, we chose simple metrics that are easy to interpret (Hicks et al. Citation2015; Knudson Citation2019; Ruscio et al. Citation2012; West and Rich Citation2012) and decided to not consider co-authoring. Counting co-authors and assigning main authorship according to established practices would require extensive additional work (Hagen and DeSalle Citation2008; Hagen Citation2014), but is unlikely to significantly affect the planned analyses. Controlling for co-authoring is empirically found to make little difference, and may also diminish the reliability of the metrics (Ruscio et al. Citation2012). More specifically, sex differences in co-authorship are small and their associations with publication metrics are even smaller or non-existent. The extent of publication co-authoring did not differ across the sexes amongst more than 11 thousand professors (Abramo, D’Angelo, and Di Costa Citation2019), with the exception of some disciplines not considered in the present study. In another sample of more than four thousand psychologists, females did co-author to a greater extent (86% vs. 80% of publications), but this was not associated with their productivity (Fell and König Citation2016). Similar patterns apply in Economics (Sarsons Citation2017) and Political Science (Teele and Thelen Citation2017), where females’ level of co-authoring was not associated with their productivity.
Publication data were obtained from the Web of Science (Clarivate Analytics) by the second author in the spring of 2016, being at that time unaware that sex was of any significance (Fahlman Citation2016). Two-year journal impact factors (IF) for 2015 were obtained from Clarivate’s Journal Citation Reports. The option for downloading complete information about each publication year was used for each individual publication, which made it possible to determine publication metrics until and including the year before the promotion of each professor, rather than at the time of the search. Each person’s family name and given name initial was entered in the author’s field, and it was confirmed that all publications found seemed to fit that individual’s area of research. If no publications were found, alternative spellings or varieties were tried, such as the given name and each part of double family names separately. Multiple authors with the same or similar names were disambiguated by cross-checking with other databases and assessing the subject matter of the articles (Bornmann and Marx Citation2014). Twenty-seven participants were not found in Web of Science (WoS) (16 F and 11 M), mainly belonging to Education, Law, and Linguistics. This is reasonable because these disciplines have a tradition of publishing monographs and book chapters to a greater extent, as confirmed by relatively few publications in WoS also for the other participants belonging to these disciplines. The numbers not found were similar across the sexes, as detailed by comparing the numbers for the sample and those found in WoS in , that is, columns 5 and 8 for females and 6 and 9 for males. We confirmed that these participants had been searched for with their correct names, by finding their publications in Google Scholar (using Harzing’s Publish or Perish software), and their publication metrics were then set to naught for the following analyses. Data for 5581 publications authored by the remaining 204 participants were downloaded. The distributions of all three publication metrics were strongly positively skewed. lists the descriptive statistics across all publications for both raw values and square root and log10 transforms.
Table 4. Descriptive summary statistics across all publications (N = 5581) for journal impact factor, total number of citations, and number of citations per year, up to the year each participant became professor.
The publication data were aggregated for each participant as follows. Frequencies of publications and citations were summed for each individual across all years from PhD to the year before becoming a professor, which yielded five publication metrics: (1) total number of publications, (2) publications per year, (3) total number of citations, (4) mean citations per year, (5) h-index, calculated as the largest n number of publications with at least n citations. The sixth metric was the (6) mean journal impact factor (IF), calculated as the mean of log-transformed journal IF across all publications for each participant, because that was closest to a normal distribution according to skewness and kurtosis estimates in . The descriptive statistics across all participants are listed in , again also with square root and log10 transforms, showing that the log transform is closest to a normal distribution for all variables except IF and h-index, for which the square root was preferred. The untransformed means and standard deviations in are misleading because of the positive skew.
Table 5. Descriptive statistics across all participants for total number of publications and citations, mean number of citations per year, and h-index, before and including the year each participant became professor.
demonstrates large differences between the disciplines for all metrics, with Education, Law, and Linguistics forming a cluster with the lowest metrics, followed by Political Science, Psychology, and Medicine. As a consequence, a comparison of the sexes across all disciplines is inappropriate due to large mean differences across disciplines, which result in large SDs on the order of several times the mean. WoS is less inclusive than Google Scholar, for example, which might lead to larger difference amongst social scientists, who tend to publish a larger proportion of their work in books and journals that are not featured in WoS (Knudson Citation2019, 102; West and Rich Citation2012, 362). Still, the present search included at least 35 book chapters and 67 conference proceedings, ∼300 journals with naught IF, and ∼315 publications from a mix of sources with no designated IF, including edited books and the Swedish physician’s practitioner journal (Läkartidningen), for example.
Table 6. Mean publication data metrics for each discipline, across participants.
The sex differences for the whole sample were substantial for all variables except for IF, but in the opposite direction from the predicted. The male point estimates were higher for 33 of the 36 combinations of the six variables and the six disciplines. Given these results, the most conservative way to test the sex differences is to (1) use the square root transformed data for IF and h-index and the log10 transformed data for publications and citations, and to (2) do this separately for Medicine and the Social Sciences, as initially devised in the sampling process. lists these comparisons, including medians, percentiles, proportional differences in percent, effect sizes (d), and t-values and p-values from one-tailed t-tests. Holm-Sidak correction (Abdi Citation2010) was applied to control for familywise Type I error amongst the dependent variables, the pcorr column in showing the corrected p-values, resulting in one metric (h-index for the Social Sciences) moving above p0.05 (from .0219 to .0847).
Table 7. Sex differences for Medicine and the Social Sciences, separately, for each of the 6 publication metrics.
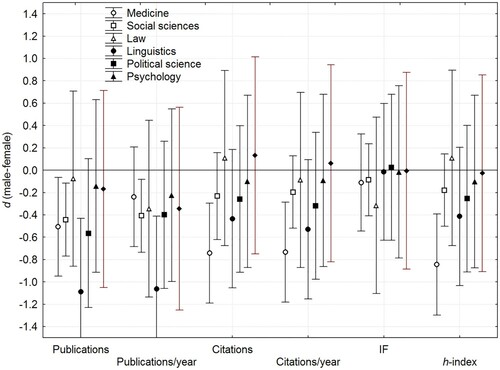
The results are visualised in more detail in through , which depict the interactions between disciplines and sex. Not visualised are IF, which exhibited no statistically significant sex differences, and citations, whose very large differences across disciplines made the graph difficult to read. The figures plot geometric-harmonic means, in other words the back-transformed (x2 and 10x) group means of the Sqrt and log10 transformed individual metrics. Confidence intervals are calculated as M ± 1.96(SD/(sqrt(N))) to the power of 2 for the square root transformed data and as 10 to the power of M ± 1.96(SD/(sqrt(N))) for the log10 transformed data, which makes them asymmetrical around the means. For comparability across both individual disciplines and the Social Sciences cluster, the figures show p-levels based on uncorrected p-values.
In summary, and show that males had significantly more publications and publications per year in the Social Sciences cluster, and had more publications, citations, and citations per year in Medicine, as well as a higher h-index in both. There were no differences in journal IF. depicts the effect sizes for all combinations of the six metrics and six disciplines, exhibiting 8 medium and 11 small effects, and trends in the same direction for all but a few of the remaining 17 effects, as well as for the Social Sciences cluster.
Figure 1. Number of publications as a function of discipline and sex. Error bars denote 95% confidence intervals and p-values are uncorrected for multiple comparisons.
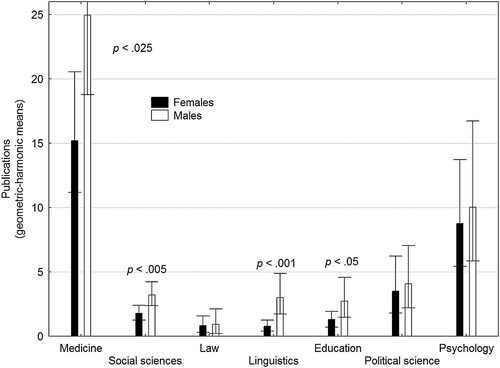
Figure 2. Number of publications per year as a function of discipline and sex. Error bars denote 95% confidence intervals and p-values are uncorrected for multiple comparisons.
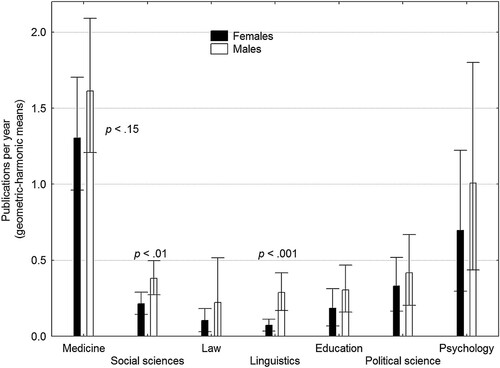
Figure 3. Number of citations per year as a function of discipline and sex. Error bars denote 95% confidence intervals and p-values are uncorrected for multiple comparisons.
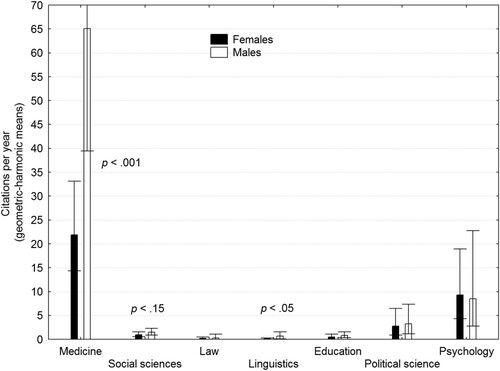
Figure 4. h-index as a function of discipline and sex. Error bars denote 95% confidence intervals. After correction for multiple comparisons, the sex difference p- for the Social Sciences increases to above .05.
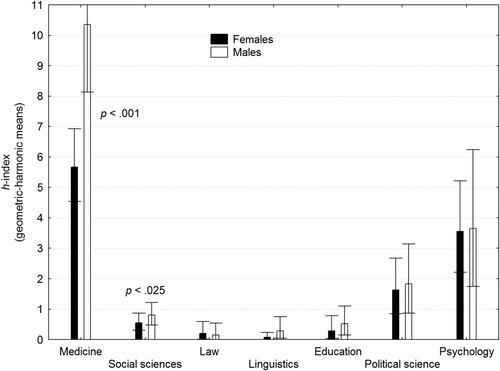
Figure 5. Effect sizes of the sex differences for each of the six publication metrics, separately for each of the six disciplines as well for the means across the five social sciences disciplines. Error bars denote 95% confidence intervals.
Discussion
We tested the hypothesis that when appointed to the rank of professor, females have higher publication merits than males, reflecting a sex bias favouring males at Swedish universities. The data falsified this hypothesis, in that none of the 12 comparisons (2 discipline clusters × 6 metrics based on WoS data) exhibited any significant effect in this direction. In contrast, six of these metrics exhibited significantly (p < .05) higher values for males after Holm correction. In terms of magnitude, males had 64%–80% more scientific publications that had attained 42%–260% more citations, resulting in a 72%–83% larger h-index (). While these are quite large differences, their effect sizes were more moderate, due to the large variability stemming both from individual differences (Simonton Citation2014) and differences between disciplines, in the case of the Social Sciences.
The discussion is structured as follows. We first comment on an issue that has repeatedly been raised in previous reviews of this article. Limitations with the present study and alternative interpretations are then considered. Because our findings seem to contradict the common wisdom, as reviewed before, we conducted a systematic search in Scopus and WoS using the string academ* AND (sex OR gender) to compare them to the most recent literature. Finally, possible explanations are considered.
The present study measures productivity at the specific point in an academic’s career when they are evaluated for the rank of professor. If that rank was attained exclusively on the basis of their academic performance, in accord with both the legislation and academic principles, women and men’s merits should have been equal. The results show that at this point, and regardless of other potential differences in age, funding, number of children etc., female professors had, on average, lower levels of scholarly achievement than male professors. The result can be an effect of promoting females to professor at an earlier stage in their career. Other variables that might affect productivity, or whether some faculty faced greater challenges or had to work harder than others to obtain the same apparent academic merit, is irrelevant for the conclusion that the publication criteria for becoming a professor were effectively lower for females.
We will next consider limitations pertaining to the sampling and statistical analysis, data collection, representativeness of the population, and specific design choices. First, the sample size was limited to what was sufficient for detecting the suggested meaningful effect size (d) of 0.3, because obtaining publication data for each individual was quite demanding. As it turned out the observed effect sizes were larger than this for six of the twelve (2 discipline clusters × 6 publication metrics) sex differences, and more than double that for three of them. Moreover, the direction of the sex difference was consistent both for the two clusters of disciplines and the full matrix, namely for 33 of the 36 combinations (6 disciplines × 6 publication metrics). It should also be noted that citation rate is reasonably the least biased metric within discipline, whereas total citations and h-index are inflated by the time since first publication. The validity of the metrics used is therefore supported by the quite similar effects across citation rate and total number of citations.
Second, we noted in the introduction that the study population was somewhat smaller than the estimated replacement of professors who retire, and argued that this was unlikely to entail any bias if it were due to an overestimation of the replacement. Another possible explanation for this discrepancy is attrition, as some individuals decline to take part in the promotion ceremony. We believe that this is very rare, and that even those who will not participate are listed in the booklets, but have no means of testing this. Even so, there is no reason to assume that such attrition would be associated with both productivity and sex, which is the prerequisite for it biasing the results. Also, this attrition is most likely to occur for those who are already professors but are changing institution, as they might not find it worthwhile to experience the ceremony a second or third time. Since these individuals tend to be older, male, and have high merits, their exclusion would actually decrease the male merits, and would hence decrease the sex difference, as the results turned out.
Third, the results are limited to the population of professors that were appointed after 2008, which excludes the 870 female and 3783 male active professors who were appointed before this year (Statistics Sweden Citation2010). We are thus oblivious about possible differences in criteria for appointing them. However, those figures had changed to 1547 females and 4807 males six years later, increasing the proportion of females from 19% to 24% (Statistics Sweden Citation2016). This means that the number of male professors had increased by 28% and female ones by 78%.
Fourth, several disciplines were excluded because of their small n and skewed sex ratio for fear that they might be less representative. Most of these belong to the natural sciences and have, except for biology, a larger proportion of males. Having included such disciplines would likely have increased the effect found, because females seem to be particularly favoured in male-dominated contexts. Breda and Hillion (Citation2016) found that females received higher scores when their sex was known than when it was not, indicating a positive bias, and that this difference increased up to 13 percentile points with the proportion of males in that subject. Similarly, Williams and Ceci (Citation2015) found a 2:1 preference for females in hypothetical hiring experiments regarding tenure-track assistant professorships, when otherwise identical applications were randomly assigned to either sex.
Fifth, it is possible that using other databases than WoS would have affected the sex differences, as mentioned in the method section, although this would seem unlikely in light of the very high correlations between publication metrics across databases (Knudson Citation2019, 101). Still, the generally higher publication performance of males might be associated with publishing in more high-impact journals. As journals with lower impact are conceivably less likely to be indexed in WoS than in other databases, this may amplify the sex difference. The almost non-existent sex difference in journal IF speaks against this, however.
Sixth and finally, it could be argued that even if there were no difference in productivity, female authors might be less cited due to some unidentified bias. There seems to be no study that can substantiate this claim. Aksnes et al. (Citation2011), for example, found that female professors in Sociology were cited approximately 10% less than the male ones, but that this difference was entirely explained by their significantly fewer publications.
Taken together, it seems inconceivable that any alternative data selection or transformation would either eliminate or reverse the direction of the group difference. Two systematic sample selection criteria were applied, excluding disciplines with small n and disciplines with a large sex skew. None of the disciplines with n > = 30 had any substantial sex skew (), and 36%–53% in the selected disciplines were female (). It is possible that the excluded data would exhibit a different pattern, but that would rather have increased the group difference according to the common idea that publication merits are hampered by belonging to a small discipline or to a small minority group (Yousaf and Schmiede Citation2016). Even so, it would be unlikely to change the overall pattern, because the excluded disciplines constitute a mere 28% of the whole population (929–670 = 259; see ). Another possibility is that female academics were appointed on the basis of generally having higher merits apart from publications. There seems to be no indication of such a pattern. Females applying for promotion to professor at Uppsala University during the period 2001–2010 did not overall have higher pedagogical merits or more funding than their male counterparts in these years (Riis, Hartman, and Levander Citation2011, see 125 and Table 45).
Thus, how can these unexpected and yet robust results be understood? If we had merely compared merits across the sexes at any point in the academic career, higher male achievement could have been attributed to favourable conditions for males, such as more encouragement, more opportunities for co-authorship, and better access to resources, like funding and time for research. However, the present design evades these possible confounders and add-on explanations by considering only the evaluation of widely-used quantitative publication performance criteria, not how that performance was achieved. The results show that the criteria for becoming a professor, in terms of publication metrics, were effectively lower for females during the measured period.
This finding is inconsistent with the hypothesis that sex-biased evaluation and in-group support hold women to a higher standard in order to get ahead, as reviewed in the Introduction. Females have historically been hindered to engage in science by means of strict sex roles and the inflexibility of societal and family institutions, which have also often marginalised females’ scientific achievements. The present study is concerned with the contemporary situation, however. It is frequently argued in the media and the public debate that academia of today is a hostile environment for females (Lawrence Citation2006), that academia discriminates against females (Johnson, Hekman, and Chan Citation2016), and that academic quality would increase if academia fostered more of a gender perspective (Alnebratt Citation2011). The results from the search mentioned above include many scholarly papers that express one or more of these notions, but the vast majority of those do not present any empirical data or empirically based arguments. Amongst empirical studies there is one strand that relies on female academics’ self-reported perceptions of discrimination and hardships. Most of them report negative experiences (e.g. Howe-Walsh and Turnbull Citation2016; Seierstad and Healy Citation2012), however other studies report that a substantial proportion of females feel they are treated equally as males (e.g. Seemann et al. Citation2016; Webster et al. Citation2016) or that their promotions were perceived as biased in their favour and against males (e.g. Van den Brink and Stobbe Citation2014, 169–170). Apart from being based on subjective experience, the main problem with such studies is that they rarely compare the sexes and control for confounding variables. It is conceivable that academics regardless of sex feel that they face unsurmountable demands, role conflict, hostility, and lack of support, simply because of the competitiveness and nature of academia. Recent empirical studies that employ more objective measures indicate that female academics are often favoured. In sociology, for example, females get a permanent position with 23%–44% fewer publications than males, and are overall 1.4 times more likely to get tenure (Lutter and Schröder Citation2016). Females were scored up to 13 percentile points higher on an exam when their sex was known than when it was not, indicating a positive bias, with the higher bias for the more male-dominated subjects (Breda and Hillion Citation2016). Likewise, empirical data suggest that females are advantaged in retention (Box-Steffensmeier et al. Citation2015), salary (O’Neill and O’Neill Citation2006), funding (Marsh, Jayasinghe, and Bond Citation2011; Raj et al. Citation2016), and publishing (Diamond et al. Citation2016). Also hypothetical hiring experiments indicate a preference for females in male-dominated disciplines (Williams and Ceci Citation2015), and a recent meta-analysis found very small preferences for the dominant sex in the respective occupation (Koch, D’Mello, and Sackett Citation2015). Across 111 studies covering four decades, males were preferred for male-dominated occupations with a meta-analytical effect size of 0.08 (Cohen’s d), while a tendency to prefer females for female-dominated occupations was even smaller (0.02) and non-significant. There was no bias for sex-balanced occupations, nor when the raters were ‘experienced professionals’ (Koch, D’Mello, and Sackett Citation2015). That description seems befitting for the academics that evaluated the professors in the present study. Finally, the present results are also consistent with previous research in terms of generally higher scientific productivity for males (Aguinis, Hun Ji, and Joo Citation2018; Bendels et al. Citation2018; D’Amico, Vermigli, and Canetto Citation2011; Fridner et al. Citation2015; Holliday et al. Citation2014; Lerchenmueller and Sorenson Citation2018; Nielsen Citation2016; Raj et al. Citation2016; Riis, Hartman, and Levander Citation2011; van den Basselar and Sandström Citation2016). In conclusion, the recent literature paints a variegated picture, where more objective study designs tend to indicate a bias in favour of females, evidently more in line with the present results.
This discrepancy between empirical results and the more unequivocal claims in the media, academia, and the political level may be one explanation for the present results. If a majority of those involved in evaluating applications for the rank of professor believe that there is a bias against females, they might react so as to compensate for this, either deliberately or subconsciously and unwittingly. Combining the results from several different tests of their data, Breda and Hillion (Citation2016, 477) concluded that ‘evaluators may simply have a preference for gender diversity, either conscious (e.g. political reasons) or unconscious’.
Another explanation may be the application of so-called affirmative action and equal opportunities promotion measures that ostensibly compensate for inequality or unfairness without directly challenging meritocratic assessment (see Madison Citation2019, 2). This might take the form of always selecting from the favoured group if merits are identical, insignificantly different, or sufficient to perform the task (Utbildningsdepartementet Citation1994, 36, Citation2004, 46). Such measures will inevitably create a bias that origins from the ubiquitous margin of error and uncertainty in disclosing, communicating, and assessing merits.
A third explanation may be that university administrations somehow increase the proportion of female professors by non-meritocratic means, in accord with government goals to achieve sex equality ‘in purely numerical terms, [concerning] the sex distribution amongst PhD students, teachers, and researchers’ (Utbildningsdepartementet Citation1994, 26, Citation2004, 46).Footnote4 Indeed, the Swedish government has decided that the less represented sex shall constitute at least 40% in all areas of education (Delegationen för jämställdhet i högskolan Citation2011, 166, Citation2009, 5; Utbildningsdepartementet Citation1994, 37), and that all official statistics should be broken down by sex in order to monitor thisFootnote5 (Utbildningsdepartementet Citation1994). It has also decided that a so-called gender perspective shall be applied to all higher educationFootnote6, that females be appointed when merits do not differ significantly between applicants of both sexes, and that universities be incentivised to increase the proportion of female professors.Footnote7 As stated by the former minister for higher education:
The Cabinet is now substantially increasing the level of ambition for the period 2017–2019. New recruitment goals for equal sex distribution amongst newly recruited professors are written into the universities’ letters of regulation. They correspond to nine percentage points on average per institution for the upcoming period. In addition, the Cabinet has for the first time set a national goal: Equal numbers of women and men shall be recruited as professors 2030 at the latest. (Hellmark Knutsson Citation2017)Footnote8
Acknowledgements
Many scholars have helped improve the presentation of this study. We thank two anonymous reviewers who have given constructive comments on a previous version of this manuscript. For giving generously of their time to comment, we are likewise indebted to Edward Dutton, Michael Gruber, Bo Molander, Erik J. Olsson, Roland S. Persson, Charlotta Stern, Anders E. af Wåhlberg, and two scholars who wish to remain anonymous. The reason that this article is published more than three years since the data collection is the cumulative duration of the review process, at it has been rejected by six journals before it was submitted to Studies in Higher Education. Five of them eventually rejected it without review, stating that it was inappropriate for, or outside the scope of, the journal. One journal rejected it after a first round of reviews, where each of reviewers 1–4 provided increasingly negative and unspecific comments.
Disclosure statement
No potential conflict of interest was reported by the author(s).
Correction Statement
This article has been republished with minor changes. These changes do not impact the academic content of the article.
Notes
1 Our translation. The original text reads
Trots att Sverige är världsledande när det gäller andelen kvinnor på arbetsmarknaden, och trots att 60 procent av studenterna länge varit kvinnor, är fortfarande tre av fyra professorer män. Vi måste ha högre ambitioner än så. I den svenska högskolan ska kvinnor och män kunna verka på lika villkor och med samma möjligheter till karriär. Alltför ofta har föreställningar om manliga genier fått gå före kompetens i högskolan och alltför ofta har internrekrytering och nätverk fått spela större roll än hårt arbete. Det är i längden skadligt för kvaliteten på svensk forskning.
2 ‘The term “gender” is often reserved for societal manifestations of being male or female – the roles people play … I use “sex” as the more inclusive term … “gender” is most commonly used to refer to the psychological aspects of rearing … the way your parents and other socializing agents treated you based on your sex when you were growing up … ’ (Halpern Citation2012, 160–161).
3 For examples, see https://lu.prodwebb.lu.se/sites/www.lu.se/files/prof_inst_19_okt_2012.pdf https://issuu.com/uppsalauniversitet/docs/profinst-2015.
4 Our translation of ‘En aspekt på jämställdhetsfrågan låter sig beskrivas i rent numerära termer och gäller könsfördelningen bland forskarstuderande, lärare och forskare’.
5 In our translation, the original text reads ‘According to the decree (1992:1668) concerning official statistics (adjusted 1994:1108), should official statistics based on individuals be divided per sex, unless particular arguments speak against it’ 41.
6 In our translation, the original text reads ‘The process is repeated prior to each three-year period until both sexes’ proportion of the professors is at least 40%’ 37.
7 In our translation, the original text reads
An amendment [to the legislation for higher education] should be made that clarifies that it is allowed to positively discriminate the underrepresented sex within the particular category of employees within the university or polytechnic, if the discrimination is a route to promote equality in work life, 40.
8 Nu höjer regeringen ambitionsnivån avsevärt för perioden 2017–2019. Nya rekryteringsmål för jämn könsfördelning bland nyrekryterade professorer skrivs in i de nya regleringsbreven for universitet och högskolor. I genomsnitt handlar det om en ökning om nio procentenheter per lärosäte for kommande målperiod. Dessutom har regeringen för första gången satt en nationell målbild: lika många kvinnor som män ska rekryteras som professorer senast år 2030.
Related Research Data
References
- Abdi, H. 2010. “Holm’s Sequential Bonferroni Procedure.” In Encyclopedia of Research Design, edited by Neil Salkind. Thousand Oaks, CA: Sage.
- Abramo, G., C. D’Angelo, and F. Di Costa. 2019. “A Gender Analysis of Top Scientists’ Collaboration Behavior: Evidence from Italy.” Scientometrics 120: 405–418. doi: https://doi.org/10.1007/s11192-019-03136-6
- Aguinis, H., Y. Hun Ji, and H. Joo. 2018. “Gender Productivity Gap Among Star Performers in STEM and Other Scientific Fields.” Journal of Applied Psychology 103: 1283–1306. doi: https://doi.org/10.1037/apl0000331
- Aksnes, D., K. Rorstad, F. Piro, and G. Sivertsen. 2011. “Are Female Researchers Less Cited? A Large-Scale Study of Norwegian Scientists.” Journal of the American Society for Information Science and Technology 62: 628–636. doi: https://doi.org/10.1002/asi.21486
- Alnebratt, Kerstin. 2011. “Genusperspektiv - för höjd kvalitet i forskning.” Genusnytt.
- Anderson, E. 2015. “Feminist Epistemology and Philosophy of Science.” In Stanford Encyclopedia of Philosophy (Summer 2019 Edition), edited by E. N. Zalta. Stanford, CA: The Metaphysics Research Lab. https://plato.stanford.edu/archives/sum2019/entries/feminism-epistemology/.
- Bendels, M., R. Müller, D. Brueggmann, D. A. Groneberg. 2018. “Gender Disparities in High-quality Research Revealed by Nature Index Journals.” PLoS ONE 13: e0189136. https://journals.plos.org/plosone/article/authors?id=https://doi.org/10.1371/journal.pone.0189136.
- Bornmann, L., and W. Marx. 2014. “How to Evaluate Individual Researchers Working in the Natural and Life Sciences Meaningfully? A Proposal of Methods Based on Percentiles of Citations.” Scientometrics 98: 487–509. doi: https://doi.org/10.1007/s11192-013-1161-y
- Box-Steffensmeier, J. M., R. C. Cunha, R. A. Varbanov, Y. S. Hoh, M. L. Knisley, and M. A. Holmes. 2015. “Survival Analysis of Faculty Retention and Promotion in the Social Sciences by Gender.” PLoS ONE 10: e0143093. https://www.ncbi.nlm.nih.gov/pmc/articles/PMC4651362/ doi: https://doi.org/10.1371/journal.pone.0143093
- Braun, H., G. Schui, A. von Eye, and G. Krampen. 2013. “How Does Scientific Success Relate to Individual and Organizational Characteristics? A Scientometric Study of Psychology Researchers in the German-speaking Countries.” Scientometrics 94: 523–539. doi: https://doi.org/10.1007/s11192-012-0760-3
- Breda, T., and M. Hillion. 2016. “Teaching Accreditation Exams Reveal Grading Biases Favor Women in Male-dominated Disciplines in France.” Science 353: 474–478. doi: https://doi.org/10.1126/science.aaf4372
- Bukstein, D., and N. Gandelman. 2019. “Glass Ceilings in Research: Evidence from a National Program in Uruguay.” Research Policy 48: 1550–1563. doi: https://doi.org/10.1016/j.respol.2019.03.007
- D’Amico, R., P. Vermigli, and S. Canetto. 2011. “Publication Productivity and Career Advancement by Female and Male Psychology Faculty: The Case of Italy.” Journal of Diversity in Higher Education 4: 175–184. doi: https://doi.org/10.1037/a0022570
- Delegationen för jämställdhet i högskolan. 2009. Utvärdering av kvantitativa rekryteringsmål för högskolans personal. SOU U2009:01. Stockholm, SE: Fritzes.
- Delegationen för jämställdhet i högskolan. 2011. Svart på vitt – om jämställdhet i akademin. SOU 2011:1. Stockholm, SE: Regeringskansliet.
- Diamond, S., C. Thomas, S. Desai, E. Holliday, R. Jagsi, C. Schmitt, and B. K. Enestvedt. 2016. “Gender Differences in Publication Productivity, Academic Rank, and Career Duration Among U.S. Academic Gastroenterology Faculty.” Academic Medicine 91: 1158–1163. doi: https://doi.org/10.1097/ACM.0000000000001219
- Ericson, G., U. Holm, J. Lindholm, P. Rådberg, S. Bergström, M. Kaplan, et al. 2013. Kvotering i bolagsstyrelser. Riksdagmotion 2013/14:C224. Stockholm, SE: Sveriges riksdag.
- Fahlgren, S. 2013. “The Paradox of a Gender-balanced Workforce: The Discursive Construction of Gender Among Swedish Social Workers.” Affilia: Journal of Women and Social Work 28: 19–31. doi: https://doi.org/10.1177/0886109912475162
- Fahlman, P. 2016. “Is there a g Factor in Academic Creative Performance? Evidence from Bibliographical Indices of Swedish Academics.” Bachelor’s thesis, Umeå University, Umeå, SE.
- Fell, C. B., and C. J. König. 2016. “Is there a Gender Difference in Scientific Collaboration? A Scientometric Examination of Co-authorships Among Industrial-organizational Psychologists.” Scientometrics 108: 113–141. doi: https://doi.org/10.1007/s11192-016-1967-5
- Fridner, A., A. Norell, G. Åkesson, M. Gustafsson Sendén, L. Tevik Løvseth, and K. Schenk-Gustafsson. 2015. “Possible Reasons Why Female Physicians Publish Fewer Scientific Articles than Male Physicians - a Cross-sectional Study.” BMC Medical Education 15: 67. doi:https://doi.org/10.1186/s12909-015-0347-9.
- Gamble, S. 2001. The Routledge Companion to Feminism and Postfeminism. New York, NY: Routledge.
- Hagen, N. T. 2014. “Counting and Comparing Publication Output with and Without Equalizing and Inflationary Bias.” Journal of Informetrics 8: 310–317. doi: https://doi.org/10.1016/j.joi.2014.01.003
- Hagen, N. T. 2008. “Harmonic Allocation of Authorship Credit: Source-level Correction of Bibliometric Bias Assures Accurate Publication and Citation Analysis.” PLoS ONE 3: e4021. https://www.ncbi.nlm.nih.gov/pmc/articles/PMC2603311/ doi: https://doi.org/10.1371/journal.pone.0004021
- Halpern, D. F. 2012. Sex Differences in Cognitive Abilities. 4th ed. New York, NY: Psychology Press.
- Hellmark Knutsson, Helene. 2017. “Ska Sverige hålla måttet krävs jämstalld högskola.” Göteborgs-Posten, January 3.
- Hicks, D., P. Wouters, L. Waltman, S. de Rijcke, and I. Rafols. 2015. “Bibliometrics: The Leiden Manifesto for Research Metrics.” Nature 520: 429–431. doi: https://doi.org/10.1038/520429a
- Holliday, E., R. Jagsi, L. D. Wilson, M. Choi, C. Thomas, and C. Fuller. 2014. “Gender Differences in Publication Productivity, Academic Position, Career Duration, and Funding Among U.S. Academic Radiation Oncology Faculty.” Academic Medicine 89: 767–773. doi: https://doi.org/10.1097/ACM.0000000000000229
- Howe-Walsh, L., and S. Turnbull. 2016. “Barriers to Women Leaders in Academia: Tales from Science and Technology.” Studies in Higher Education 41: 415–428. doi: https://doi.org/10.1080/03075079.2014.929102
- Johnson, Stefanie K., David R. Hekman, and Elsa T. Chan. 2016. “If there’s Only One Woman in Your Candidate Pool, there’s Statistically No Chance She’ll be Hired.” Harvard Business Review, April 26. https://hbr.org/2016/04/if-theres-only-one-woman-in-your-candidate-pool-theres-statistically-no-chance-shell-be-hired.
- Justitiedepartementet. 2016. “Jämn könsfördelning i bolagsstyrelser.” Government bill Ds 2016:32, 1–68.
- Knights, D., and W. Richards. 2003. “Sex Discrimination in UK Academia.” Gender, Work & Organization 10: 213–238. doi: https://doi.org/10.1111/1468-0432.t01-1-00012
- Knudson, D. 2019. “Judicious Use of Bibliometrics to Supplement Peer Evaluations of Research in Kinesiology.” Kinesiology Review 8: 100–109. doi: https://doi.org/10.1123/kr.2017-0046
- Koch, A. J., S. D. D’Mello, and P. R. Sackett. 2015. “A Meta-analysis of Gender Stereotypes and Bias in Experimental Simulations of Employment Decision Making.” Journal of Applied Psychology 100: 128–161. doi: https://doi.org/10.1037/a0036734
- Lariviere, V., C. Ni, Y. Gingras, B. Cronin, and C. R. Sugimoto. 2013. “Global Gender Disparities in Science.” Nature 504: 211–213. doi: https://doi.org/10.1038/504211a
- Lawrence, P. A. 2006. “Men, Women, and Ghosts in Science.” PLoS Biology 4: e19. doi: https://doi.org/10.1371/journal.pbio.0040019
- Lerchenmueller, M., and O. Sorenson. 2018. “The Gender Gap in Early Career Transitions in the Life Sciences.” Research Policy 47: 1007–1017. doi: https://doi.org/10.1016/j.respol.2018.02.009
- Lutter, M., and M. Schröder. 2016. “Who Becomes a Tenured Professor, and Why? Panel Data Evidence from German Sociology, 1980–2013.” Research Policy 45: 999–1013. doi: https://doi.org/10.1016/j.respol.2016.01.019
- Madison, G. 2019. “Explicating Politicians’ Arguments for Sex Quotas in Sweden: Increasing Power and Influence Rather than Increasing Quality and Productivity.” Frontiers in Communication 4:1. doi:https://doi.org/10.3389/fcomm.2019.00001.
- Manning, K. 2000. Rituals, Ceremonies, and Cultural Meaning in Higher Education. Westport, CT: Bergin & Garvey.
- Marsh, H. W., U. W. Jayasinghe, and N. W. Bond. 2011. “Gender Differences in Peer Reviews of Grant Applications: A Substantive-methodological Synergy in Support of the Null Hypothesis Model.” Journal of Informetrics 5: 167–180. doi: https://doi.org/10.1016/j.joi.2010.10.004
- Nationalencyklopedin. 2016. “Genusforskning.” http://www.ne.se/uppslagsverk/encyklopedi/lång/genusforskning.
- Nielsen, M. W. 2016. “Gender Inequality and Research Performance: Moving Beyond Individual-meritocratic Explanations of Academic Advancement.” Studies in Higher Education 41: 2044–2060. doi: https://doi.org/10.1080/03075079.2015.1007945
- O’Neill, J. E., and D. M. O’Neill. 2006. “What Do Wage Differentials Tell About Labor Market Discrimination?” Research in Labor Economics 24: 293–357. doi: https://doi.org/10.1016/S0147-9121(05)24010-4
- Raj, A., P. L. Carr, S. E. Kaplan, N. Terrin, J. L. Breeze, and K. M. Freund. 2016. “Longitudinal Analysis of Gender Differences in Academic Productivity Among Medical Faculty Across 24 Medical Schools in the United States.” Academic Medicine 91: 1074–1079. doi: https://doi.org/10.1097/ACM.0000000000001251
- Regeringen. 1997. Högskolans ledning, lärare och organisation [Government Bill]. Proposition 1996/97:141. Stockholm, SE: Regeringskansliet.
- Riis, U., T. Hartman, and S. Levander. 2011. Darr på ribban? En uppföljning av 1999 års befordringsreform vid Uppsala universitet. Uppsala, SE: Uppsala Universitet.
- Ruscio, J. 2016. “Taking Advantage of Citation Measures of Scholarly Impact: Hip Hip h Index!.” Perspectives on Psychological Science 11: 905–908. doi: https://doi.org/10.1177/1745691616664436
- Ruscio, J., F. Seaman, C. D’Oranio, E. Stremlo, and K. Mahalchik. 2012. “Measuring Scholarly Impact Using Modern Citation-based Indices.” Measurement 10: 123–146.
- Sarsons, H. 2017. “Recognition for Group Work: Gender Differences in Academia.” American Economic Review 107: 141–145. doi: https://doi.org/10.1257/aer.p20171126
- Seemann, N., F. Webster, H. A. Holden, C.-A. Moulton, N. Baxter, C. Desjardins, and T. Cil. 2016. “Women in Academic Surgery: Why is the Playing Field Still not Level?” The American Journal of Surgery 211: 343–349. doi: https://doi.org/10.1016/j.amjsurg.2015.08.036
- Seierstad, C., and G. Healy. 2012. “Women’s Equality in the Scandinavian Academy: A Distant Dream?” Work, Employment and Society 26: 296–313. doi: https://doi.org/10.1177/0950017011432918
- Simonton, D. K. 2014. “Creative Performance, Expertise Acquisition, Individual Differences, and Developmental Antecedents: An Integrative Research Agenda.” Intelligence 45: 66–73. doi: https://doi.org/10.1016/j.intell.2013.04.007
- Sköld, B., and M. Tillmar. 2015. “Resilient Gender Order in Entrepreneurship: The Case of Swedish Welfare Industries.” International Journal of Gender and Entrepreneurship 7: 2–26. doi: https://doi.org/10.1108/IJGE-09-2013-0057
- Socialdemokraterna. 2016. The Swedish Social Democratic Party. An Introduction. Stockholm, SE: Socialdemokraterna.
- Statistics Sweden. 2010. På tal om kvinnor och män. Lathund om jämställdhet 2010. Örebro: Statistics Sweden, Population Statistics Unit.
- Statistics Sweden. 2015. Personal vid universitet och högskolor 2014. Rep. No. UF 23 SM 1501. Örebro, SE: Statistics Sweden, Population Statistics Unit.
- Statistics Sweden. 2016. Women and Men in Sweden. Facts and Figures 2016. Örebro, SE: Statistics Sweden, Population Statistics Unit.
- Teele, D. L., and K. Thelen. 2017. “Gender in the Journals: Publication Patterns in Political Science.” PS: Political Science & Politics 50: 433–447.
- Umeå universitet. 2014. Plan för lika villkor vid Umeå universitet. Umeå University, SE: Dnr. FS 1.1.2-312-14.
- Universitetskanslersämbetet. 2009. Universitet och högskolor. Årsrapport 2009, Rep. No. 2009:12 R. Stockholm, SE: Universitetskanslersämbetet.
- Universitetskanslersämbetet. 2015. Universitet och högskolor. Årsrapport 2015, Rep. No. 2015:8. Stockholm, SE: Universitetskanslersämbetet.
- Universitetskanslersämbetet. 2018. Universitet och högskolor. Årsrapport 2018, Rep. No. 2018:5. Stockholm, SE: Universitetskanslersämbetet.
- Utbildningsdepartementet. 1994. Jämställdhet mellan kvinnor och män inom utbildningsområdet. Proposition 1994/95:164. Stockholm, SE: Regeringskansliet.
- Utbildningsdepartementet. 2004. Forskning för ett bättre liv" Jämställdhet mellan kvinnor och män inom utbildningsområdet. Proposition 2004/05:80. Stockholm, SE: Regeringskansliet.
- Utbildningsdepartementet. 2013. Rekryteringsmål för en jämnare könsfördelning bland professorer - förslag om dialog mellan regeringen och lärosätet. Rep. No.U2012/2998/UH. Stockholm, SE: Regeringskansliet.
- van den Basselar, P., and U. Sandström. 2016. “Gender Differences in Research Performance and its Impact on Careers: A Longitudinal Case Study.” Scientometrics 106: 143–162. doi: https://doi.org/10.1007/s11192-015-1775-3
- Van den Brink, M., and L. Stobbe. 2014. “The Support Paradox: Overcoming Dilemmas in Gender Equality Programs.” Scandinavian Journal of Management 30: 163–174. doi: https://doi.org/10.1016/j.scaman.2013.07.001
- Walby, S. 1990. Theorizing Patriarchy. Oxford, UK: Blackwell.
- Webster, F., K. Rice, J. Christian, N. Seemann, N. Baxter, C.-A. Moulton, T. Cil. 2016. “The Erasure of Gender in Academic Surgery: A Qualitative Study.” The American Journal of Surgery 212: 559–565. doi: https://doi.org/10.1016/j.amjsurg.2016.06.006
- West, R. E., and P. J. Rich. 2012. “Rigor, Impact and Prestige: A Proposed Framework for Evaluating Scholarly Publications.” Innovative Higher Education 37: 359–371. doi: https://doi.org/10.1007/s10755-012-9214-3
- Wikipedia. 2018. “Academic Disciplines.” October 19. https://en.wikipedia.org/wiki/Outline_of_academic_disciplines.
- Wildgaard, L., J. W. Schneider, and B. Larsen. 2014. “A Review of the Characteristics of 108 Author-level Bibliometric Indicators.” Scientometrics 101: 125–158. doi: https://doi.org/10.1007/s11192-014-1423-3
- Williams, W. M., and S. J. Ceci. 2015. “National Hiring Experiments Reveal 2:1 Faculty Preference for Women on STEM Tenure Track.” Proceedings of the National Academy of Sciences 112: 5360–5365. doi: https://doi.org/10.1073/pnas.1418878112
- World Economic Forum. 2015. The Global Gender Gap Report. Geneva, Switzerland: World Economic Forum.
- Yousaf, R., and R. Schmiede. 2016. “Underrepresentation of Women at Academic Excellence and Position of Power: Role of Harassment and Glass Ceiling.” Open Journal of Social Sciences 4: 173–185. doi: https://doi.org/10.4236/jss.2016.42023