
ABSTRACT
Theories of what determines research performance have evolved from political and economic science, amongst other disciplines. Contemporary research shows that universities have a problematic work environment characterized by bullying, insecure jobs, and dysfunctional leadership. In this study, we explore the relationship between the psycho-social work environment (PSWE) and research performance. The study consists of longitudinal data from a medical university in Sweden. PSWE was assessed by employee surveys and the outcome was register data from 8 years of bibliometrics and external funding. SEM-analyses were applied building on theoretical and empirical models. Results show that PSWE explained future research performance, with the highest impact on the quality of publications. The most important PSWE factors for good performance were fair, considerate leaders and a supportive social climate. The results suggest that improving the psycho-social work environment at the universities could be one strategy to improve research performance.
Introduction
Science is one of the driving forces of innovation in modern society. Throughout history, scientific discoveries have had great impact on the development of modern societies, not least by advancing public health and welfare. Research production has grown by an exponential annual rate of more than 4%/year, counting all disciplines (Larsen and von Ins Citation2010; Bornmann and Mutz Citation2015). With time, the cost of research has also increased. The return on investment in research and how to increase it is frequently discussed. Theories regarding what determines research performance and what constitutes an efficient research system have emerged from, amongst others, the political and economic sciences. Sandstrom et al. summarized the theories in a recent paper in three main categories (1) the level of competition including share of external and performance-based funding and the existence of national evaluation systems, (2) the level of university autonomy including financial, organizational, staffing and academic autonomy and (3) academic freedom (Sandstrom and Van den Besselaar Citation2018).
However, one aspect has gained less attention, namely the relative importance of how the psycho-social work environment at a university affects research performance and efficiency. It is well-established in other types of jobs, branches and sectors that a good psycho-social work environment affects worker health and performance positively both in improving and deteriorate health and work ability (Foldspang et al. Citation2014). Research has shown that universities tend to have a psycho-social work environment characterized by a high degree of bullying, insecure jobs, and dysfunctional leadership (Bjorkqvist, Osterman, and Hjeltback Citation1994). A recent national Irish survey investigating barriers and facilitators for successful academic performance identified a poor working environment, an excessive workload and a lack of institutional influence as major obstacles (Clarke, Kenny, and Loxley Citation2015). In two recent Swedish studies of universities, it was shown that both work environment and sickness presenteeism is indeed related to academic performance (Lohela-Karlsson, Nybergh, and Jensen Citation2018). The results showed that work environment problems are causing bigger productivity losses than health problems (Lohela Karlsson et al. Citation2013). Employees in academic settings who are experiencing problems with the work environment report a 38% loss in work productivity on average.
In the most recent reviews on this topic, it was shown that research performance is related to two sets of factors: to individual (intelligence, scientific skills etc.) and to organizational including the psycho-social work environment (Ryan and Hurley Citation2007; Widenberg Citation2003). The work-related factors most consistently associated with high scientific performance are supportive leadership with high scientific competence emphasizing scientific performance, a communicative group climate, and an open group (i.e. allowing new people to enter the group). The reviews also conclude that research groups that have major research breakthroughs often have a leader that has a good sense of direction in terms of where the field is heading, an ability to identify talent, who can generate funding and can move into new fields of knowledge. Factors associated with dysfunctional scientific performance include excessive bureaucracy, ineffective recruitment, lack of team identity and autonomy, poor interpersonal relations and an authoritarian and apathetic leadership (Ryan and Hurley Citation2007). However, the majority of previous studies on this topic have serious weaknesses as they are of cross-sectional nature, thus limiting any conclusions regarding causal effects.
Research performance is commonly measured by bibliometry, i.e. publication and citation metrics. When using bibliometric indicators as an output, a time lag has to be considered to compensate for the publication and citation process, where timeframes of up to several years before the manuscript is published are not uncommon (Ryan and Hurley Citation2007). A time lag of at least one year should be factored in when assessing bibliometric performance indicators (Wenner-Gren International Series Citation2014). Several studies have used retrospective data as a measure of output, for example, external peer review assessments of past years’ performance, together with a work environment assessment after the outcome has occurred (e.g. the year that the external review is conducted). This makes it impossible to draw conclusions about the direction of association and causality. Thus, a cross-sectional design is not the most appropriate one for answering these types of research questions.
Another limitation in previous studies is the use of subjective outcome data (e.g. peer reviews, self-reports of publications) on productivity. A few studies have used output measures combining objective and subjective data. Subjective and objective performance ratings have however been shown to be positively correlated, even though they do not always give the same ratings of performance (Moed Citation2005; Rinia et al. Citation1998). Previously, research evaluations have been undertaken by external peer-review. Contemporary evaluations of research performance rely on bibliometric indicators and success in securing external research funding. During the last decades, bibliometric indicators have been extensively studied in relation to research performance (Wenner-Gren International Series Citation2014; Moed, De Bruin, and Van Leeuwen Citation1995; Cronin and Sugimoto Citation2014). Concerns have been raised regarding the reliability and validity of these indicators in and across different disciplines. When comparisons between peer review and bibliometric evaluations have been made, it has been shown that some indicators correlate better than others (Moed Citation2005; Rinia et al. Citation1998). High scores on peer assessments and high bibliometric indicators usually match better than low indicator values and lower peer review scores do. Studies have shown that the coverage in available citation databases differs between disciplines, with the medical discipline as one of the best, and that reliability of bibliometric indicators is acceptable, even when used on smaller groups (Van and Anthony Citation2006). The most common method of measuring an individual researcher’s, or a research team's, performance is simply counting the number of original publications they have authored. Bibliometric analysis captures indicators of quantity, such as total number of published articles, total number of citations, number of top publications etc., as well as quality, for example, share of articles published in top journals, share of publications of the world's top publications etc.
Another key quantitative indicator of research performance is the researcher's, or team's, ability to obtain external research funding. According to a Swedish report, the majority of research and PhD education in Sweden is financed by external sources (Swedish Higher Education Authority). In Sweden, external competitive research funding accounts for almost 60% of university budgets for research (Swedish Higher Education Authority (UKÄ 2018)). External funding consists primarily of public funds from state authorities, municipalities, county councils, public research foundations and the EU.
The number of publications and the amount of external research funding secured may be strongly linked and dependent on one other, as it may be difficult for a researcher with a short publication list to receive external funding. Conversely, a lack of funds limits the studies that can be conducted and the chances of subsequent publishing. The Matthew effect in science is a well-established concept in studies of research performance. It suggests that past success affect future success (Merton Citation1988). In a review evaluating the empirical evidence for the theory, the authors concluded that the Matthew effect is present in several bibliometric indicators as well as in other research performance indicators (Perc Citation2014). Bol et al. showed further evidence for the effect when it came to funding (Bol, de Vaan, and van de Rijt Citation2018). A researcher's success in publishing as well as obtaining research grants is thus of great importance both for the researcher’s future academic career as well as for the ranking of the university.
However, this theory has been challenged and is empirically difficult to stringently test. It is vital to include past funding in models when studying research performance since one could argue that funding is a prerequisite for being able to conduct research and thus research performance. Taken together, this demonstrates the necessity of using longitudinal data, to enable the inclusion of past research performance when investigating current factors determining performance in research.
The aim of this study is to explore the relationship between the psycho-social work environment (PSWE) and research productivity. The purpose is to advance the knowledge regarding important factors contributing to the quality and impact of scientific endeavors at universities.
Research questions:
Is there an association between PSWE and future bibliometric performance?
Is there an association between PSWE and future success in obtaining external funding?
Are the associations above, if any, affected by previously obtained external funding?
Are the associations above, if any, affected by the time devoted to different types of work tasks?
Are specific leadership styles of importance for research performance?
Do the factors of work demand/control and support contribute to the explanation of future research performance?
Psycho-social work environment
In this study, the term PSWE includes psycho-social factors of work environment on individual, workplace and organizational levels. The psycho-social factors included in this study are described in the methods section.
Performance vs. productivity
The concepts of performance and productivity differ. Performance is related to how you produce (both quantity and quality), while productivity sets the performance in relation to the conditions/resources (inputs) in which the production or the performance took place. Examples of inputs can be financial resources, the number of researchers in the group or the working environment (Tangen Citation2005).
Economic performance can be regarded as either an outcome or as a prerequisite (input) for research performance. A relatively new approach in research evaluation is to calculate the return on investments (ROI) where external funding is seen as the investment and the return is performance indicators such as bibliometric indicators and impact on society (NIH Citation2016). In this report, we consider economic achievement as an outcome along with bibliometry. Productivity according to this model then has PSWE as an input, and research performance (bibliometry and external funding) as outputs.
Method
Material
The study is a longitudinal register-based study with data from 2007 to 2014. The study participants are employees (researchers and teachers) at a medical university in Sweden who participated in web-based employee surveys in 2009 and 2011. Informed consent allowing the use of their data in research was obtained from all invited participants (all employees at the university) via an information letter as well as an information screen when they logged onto the web survey.
The survey was distributed on two occasions to all employees, in 2009 (n = 4643) and 2011 (n = 5260), in all departments (n = 25, including non-research departments i.e. administration, library, animal houses). As the purpose was to investigate the significance of the psycho-social working environment for research performance, non-research departments were thus excluded and only employees whose job titles indicated research activity (researchers, post docs, PhD students, lecturers etc.) were included. All participating departments also needed to have data on bibliometric and external funding. The study material covers 22 departments and the total number of researchers at these departments was 2809 in 2009 and 3202 in 2011. The response rate was 68% (n = 1916) in 2009 and 66% (n = 2121) in 2011. The proportion of women was 51% in 2009 and 45% in 2011.
Ethical approval
All individual data were anonymized by an external party administering the employee survey and aggregated on department level. The project was approved by the Swedish Regional Ethics Committee (# 2015/5: 2).
Measures
Psycho-social working environment
The employee survey was conducted using a questionnaire covering different aspects of the psycho-social work environment. The questionnaire was developed by our research group and tested in several studies (Bergstrom et al. Citation2008) and is largely based on the validated QPS Nordic questionnaire, developed and tested by a group of Nordic researchers in the field, commissioned by the Nordic Council of Ministers (Dallner et al. Citation2000).
Empowering leadership (EL) and fair leadership (FL). Empowering leadership is a characteristic of a leader who has the ability to motivate people, spread energy and enthusiasm, encourage employees to express their opinions and provide an opportunity for personal development. A fair leader displays fairness by holding themselves and others to clear standards and by being reasonable in their responses. They engage others without judgment or prejudice.
Transformational leadership. A transformational leader is a leader who acts as a role model and raises questions about morality and ethics, as well as acting upon a set of visualized values. He or she inspires and motivates in order to encourage participation and creativity in the workgroup. Providing support, while not avoiding confrontation when it is necessary, is another feature of the transformational leader. There is evidence that improved effectiveness is seen in organizations with a high level of transformational leadership (Bass and Steidlmeier Citation1999). In this study, we are using the Swedish version of transformational leadership called developmental leadership, developed by the Swedish Defence University (Larsson Citation2006). It includes the following three characteristics: (1) acting as a role model, Exemplary model (DLEM); (2) showing concern for employees, Individualized considerations (DLIC); (3) being inspirational and motivational (DLI).
Organizational climate describes the social and emotional atmosphere of the workplace. An organization consists of structures and processes, and the daily interaction of people in the organization results in behavioral patterns, attitudes and emotions which, together with a host of other factors, forms the organizational climate. The organizational climate is measured by two different indices: social climate (SC) and innovative climate (IC). The social climate has to do with whether the working environment is relaxed, pleasant, encouraging, supportive or suspicious. An innovative climate is characterized by encouraging employees to take initiatives, to make improvements in the workplace and by how communication works within the group.
Social support is about the confidence one has that one can rely on others for help and support, not only in a crisis, but also in day-to-day work. In this study. the dimension emotional support, which is about empathy, friendship, reliance and concern is measured. Social support in this study included both support from manager (SSM) and colleagues (SSC).
Job demands (JD) could be defined as the circumstances where the employee is required to take action or behave in some way. There are different types of job demands, for example too much/too little work, excessive time pressure, irregular working hours, and high pace of work. In this study, two different job demands were included: quantitative demands (JDQ) and decision demands (JDD).
Job control (JC) could be described as the individual’s perception of their ability to control, manage and make decisions about their work, i.e. the scope or the freedom they have to choose between different alternatives. The concept of control may be linked to self-determination, involvement in planning and decision-making. In this study, two different job demands were included: control of work pace (JCWP) and control of decisions (JCD).
The factors Job control and Job demands are from the extensively studied job-control model (JDC model) developed by Karasek and Theorell, further developed to include the factor Social support (JDC (S)) (Fila Citation2016).
Performance
The university board granted us access to two administrative registries at the university where data on research performance is recorded: bibliometric indicators and external funding. Data, at individual level, were obtained for all subjects participating in the employee survey. The performance data was obtained by providing the university library and the financial department with the individual participant identification code so that they could obtain data for each participant. However, the board only allowed us to access the performance data aggregated at departmental level.
Bibliometric indicators
In order to capture aspects of both quality and quantity related to published work, seven different indicators were selected, on the recommendation of bibliometric experts at the university library. The analysis is based on verified publications in the university’s bibliometric database. This database has high coverage since allocation of university block funding to departments and research groups is, since 2008, based on the bibliometric reporting. Thus, it is in research groups’ own interest to update the bibliometric database. The database contains information about international academic publications from 1995 onwards. It is based on information from the database Web of Science and Medline. For this study, bibliometric data was provided aggregated at departmental level for the years 2007–2014. Correction for potential double-counting was made by counting each article only once for the same research group. For the three quantity indicators, correction for the number of people who verified the publications has been made, so that the bibliometric value / person has been calculated (e.g. P total/N etc.). This correction has been used to prevent departments with many employees from having an advantage when different variables based on quantity are reported, a form of ‘per capita’ adjustment. The following indicators are used in this study:
Indicators of quantity
P total = The number of verified papers in the bibliometric database (P total/N).
Σ Cf = The sum of an individual’s publications’ field-normalized citations. This can be seen as a ‘quality adjusted for quantity’ indicator. High values indicate that many publications are highly cited within their own fields. Field standardization means taking into account differences in publication and reporting behavior between research areas. Thus, production can be compared between fields (Σ Cf/N).
nTop 5% = The number of publications belonging to the top 5% most cited publications in their field. A high value indicates that several publications are highly cited as compared to publications in the same research field (nTop5%/N).
Indicators of quality
Cf = The mean value of a publication's field-normalized citation level. A high value indicates that many publications are highly quoted compared with publications in the same research area. As an example, a value of 0.9 means that the group's publications are cited about 10% below the world average and 1.2 means that they are quoted approximately 20% above the world average.
Avg Perc Cf = The average field-normalized citation percentile for the publications. A high value (the average percentage is about 50%) indicates that many publications are highly quoted in the field of research. This factor is less sensitive than Cf for extreme values from single publications.
Share Top 5% = The share of publications belonging to the 5% most quoted in their field. A high value indicates that many of the publications are among the world's most quoted articles in the area. The world average is around 5%.
Avg JCf = The mean of field-normalized citation rates of the journals in which the verified articles were published. A high value indicates that many of the publications are published in highly cited journals in the area.
External funding
In this study, we used only funding obtained in competition. Block funding was not used since the overall block funding in Sweden, obtained from the government, is not based on research performance. However, the allocation of the yearly block funding within the present university, to the different departments, is based heavily on research performance (bibliometrics and obtained competitive funding). For this reason, block funding is not included in our analyses.
Information about the total amount of external funding granted per year was obtained from the finance department at the university. Data was provided for the years 2007–2014, again at department level. The data is presented as funding per year. For example, if a 3-year project is awarded a grant of 3 million, and the cost is the same for each year and the financier allocates funds per year, the income is reported as 1 million / year for the 3 years. For the economic indicator, the sum has been divided by the number of researchers in the group, a form of ‘per capita’ adjustment (Σ external funding/N).
Statistics
For PSWE data from 2009 and 2011, employee survey measurements (ESM) was used. For the performance indicators, register data on all subjects participating in the ESM was obtained thus providing complete data without any missing values for the outcome measures. The bibliometric data from 2009 to 2014 were calculated and transformed into 3-year periods to take into account the time lag in the publication process. Therefore, PSWE data from 2009 were analyzed in relation to bibliometric achievements for 2010–2012 and PSWE from 2011 to bibliometric achievements from 2012 to 2014. For external funding, data from 2008 to 2014 are used. Funding is included as an additional factor in the analysis of the relation between PSWE and bibliometric achievements. The mean of external funding one year before and the year for each ESM were introduced in the analyses of bibliometric performance to adjust for potential effects of previous success to future success in performance (i.e. the Matthew effect).
A separate analysis of funding as an outcome related to previous PSWE data was also done, using funding as mean of the three years following the year after the PSWE data (2010–2012, 2012–2014). All analyses are made with aggregated data on department level. The sample in each ESM is to be considered as a closed cohort with a three-year follow up as only those responding to the ESM are followed prospectively. Analyses were made for each year of ESM separately and in combination, i.e. merged over the whole observation period, 2009 and 2011.
A confirmatory approach using structural equation models (SEM) analysis was used where theoretical and empirical models were built to test the hypothesis. SEM involves observed variables, manifest data, and constructs not directly observed, i.e. latent factors. Our approach in SEM analysis is the most common, where the latent variable is supposed to cause the responses in the manifest variables. The analyses were carried through in three basic domains.
The first domain related a general selection of basic factors covering the PSWE to the outcome of bibliometric performance. Two latent variables were included, one for the PSWE, one for the bibliometric performance. Six observed variables of PSWE were tested in the measurement model: EL, FL, SC, IC, JCWP and JCD, see previous description of measures. For bibliometric performance, the seven observed variables as described in the section on measures were all used. Funding for the years before the years when the PSWE data were collected was included in the final models, but analysis not included funding was also done. In this domain we also performed analysis for the year 2009, where a factor of time devoted to different work tasks was added in the SEM analysis. In the analyses amount of time for research was controlled by including time devoted to research, teaching and clinical tasks/department. Due to the limited sample size, each work task was introduced separately into the model.
The next domain was more specific as it concerned the area of leadership. The latent variable for bibliometric performance was also used here, and the latent factor leadership was observed through the manifest variables EL, FL, DLEM, DLI and DLIC, see previous description of measures.
The third and final domain was also specific as it concerned the job demand-control model. The latent factor bibliometric performance was the same as in other domains. The latent factor Demand/Control was observed through the manifest variables JCD, JCWP, JDQ, JDD, SSC and SSM, see previous description of measures.
The SEM models have a theoretical background especially concerning the psycho-social environment, a research area the authors have been active in for many years. However, relating these concepts to bibliometric performance is a novel area of research and therefore an amount of exploratory approach was appropriate. The models were evaluated for goodness of fit, primarily using the comparative fit index (CFI), the root mean squared error approximation (RMSEA) and the standardized root mean squared residual (SRMR). Ideally, measures for CFI would be larger than 0.90 and preferably larger than 0.95, for RMSEA smaller than 0.08 or preferably 0.05, and for SRMR smaller than 0.08. We also refer to the likelihood ratio test of the actual model versus the saturated model where a non-significant result (p > .05) is preferable.
An improvement of the model is called for if the above-mentioned criteria indicate a bad fit. We considered the modification index supplied with the estimation result. and, if this index was substantial as well as justified by theoretical considerations, we introduced changes to the model.
Results from the SEM analysis are presented with the appropriate figures for SEM indicating the different variables (latent and manifest) and the structural relationships between these different concepts. The standardized effect estimates, equivalent to standardized regression coefficients and correlation coefficients, are shown.
Data analysis was carried out with the statistical packages Stata (version 15.2) for the SEM analyses (following the guidance of/procedure described by (Acock Citation2013), and SPSS (version 25) for the descriptive statistics.
Results
Descriptive
In , a brief description of the study sample is presented, per survey year. The only major difference between the samples is that there were more PhD students and fewer researchers in 2011 survey.
Table 1. Description of the respondents in the two employee surveys.
In and , an overview of the estimates of all the exposure variables and the outcome variables are presented. The response options for all exposure items range from 1–5 with 1 being the most negative (not at all) and 5 the most positive (totally agreeing).
Table 2. Descriptive statistics for the psycho-social work environment factors used in the study at each assessment.
Table 3. Descriptive statistics for the performance indicators at the university level at each assessment.
The JDC categories are based on the job demand and job control items assessed in accordance with the Job demand/control model (JDC) (Karasek and Theorell Citation1990). These are categorized into two factors: Job demand (JD) and a Decision latitude (DL) which are dichotomized into low and high. Thus, four different types (active, passive, low and high strain) of job descriptions are obtained. The JDC has more recently been further developed to include social support as a third dimension, moderating the effect of the different job factors (JDC(S)).
As shown in the table, most researchers have an active work with high demands but also high influence/control. About eleven percent experience job strain, with high demands and low control. The level of support from colleagues was somewhat higher than support from managers.
As shown in , publications from the university are above the world average of field normalized citations (Cf), and when it comes to share of top 5% of publications. The range of the value of external funding received is quite wide. However, the figures do not consider the size of departments which of course differs. In the analyses, we account for this by calculating values per capita.
To provide an interpretation framework for the results of the different departments, we describe in the different tasks performed. These variables were further introduced in the SEM analyses as explanatory factors. The table shows, on the one hand, the proportion of work hours dedicated to research as well as the share for teaching and clinical work. These are factors likely to have significant impact on research performance indicators. In relation to the above, a question was asked ‘Do you feel that you can handle all your tasks (research, teaching, clinics, etc.) within normal working hours’.
Table 4. 1 Descriptive data from the 2009 employee survey showing the distribution of research time, teaching time and clinical work per department and the ability to cope with the different work tasks in the research role.
As shown in the table, the departments differ, in some cases radically, in terms of research time and teaching responsibilities. At some departments, researchers have a high proportion of teaching, while at others they have a high proportion of research time in their positions. The results further show that less than half of the employees at a majority of departments report that they can cope with the different tasks within their normal work hours.
A chi-square test revealed significant differences between the sexes with regard to teaching tasks with females devoting more time to teaching (mean proportion time devoted ♀ 27.1% ♂ 18.9% p ≥ .001).
Psycho-social work environment and future performance
All analyses in the SEM analysis is presented using aggregated data from the two employee surveys and performance data for the following three years for both periods. SEM analysis has also been conducted for 2009 and 2011 separately and the results vary slightly but do not differ in any decisive way. If there is any separate analysis that differs substantially, these are reported. and , are translated and adapted versions of those previously published in a Swedish project report presented to the university board (Jensen et al. Citation2018).
Figure 1. Results from the SEM analysis of the association between PSWE and future bibliometric performance. EM: Empowering leadership; FL: Fair leadership; SC: Social climate; IC: Innovative climate; JCWP: Job control of work pace; JCD: Job control of demands. See section Measures for description of the bibliometric indicators.
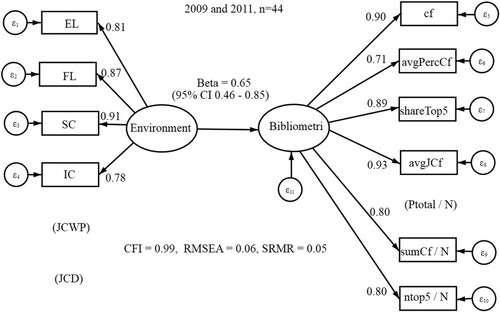
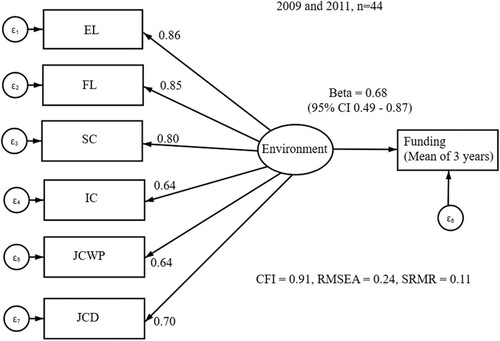
Figure 2. Results from the SEM analysis of the association between PSWE and future financial performance. EM: Empowering leadership; FL: Fair leadership; SC: Social climate; IC: Innovative climate; JCWP: Job control of work pace; JCD: Job control of demands. See section Measures for description of the bibliometric indicators.
The basic SEM analysis in our first domain of analysis is shown in .
The effect estimate in the SEM model is expressed as a standardized regression coefficient beta. The value was 0.65 which indicates a relatively strong association between PSWE and bibliometric performance (). In the present model, the two factors of job control, previously shown to be of importance for work performance, did not fit well into the model. However, the job control factors are included in our third domain analyses. Neither did the bibliometric variable P total/N. Goodness of fit was fair but below the suggested limits. Fair leadership and social climate had the highest loadings with respect to PSWE (0.87 and 0.91). The quality bibliometric indicators Avg JCF, Share top5 and Cf had similar loadings (0.93, 0.89, 0.90) and are therefore important in the estimated relationship between PSWE and research quality.
Of importance is how the theoretical model matches the empirical data for the relationship between PSWE and bibliometric indicators. The adjustment measures CFI, RMSE and SRMR show a good fit of the model (CFI = 0.99, RMSEA = 0.06, SRMR = 0.05) (Schreiber et al. Citation2006).
As for the financial performance, the result () indicates a relatively strong positive association between the PSWE and obtained external funding (beta = 0.68). Encouraging leadership (0.86) and fair leadership (0.85), as well as a good social climate (0.80), had the highest loadings with respect to funding. The adjustment measurements CFI, RMSE and the determination coefficient were inferior compared with the usual rule of thumb in the SEM analysis. This indicates the need to introduce other factors in the model to better explain economic performance and improve the model fit.
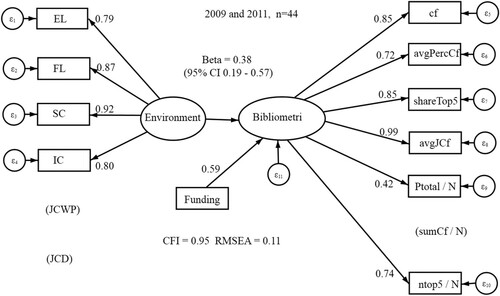
In an attempt to control for the so-called Matthew effect (Merton Citation1988; Perc Citation2014), we introduced funding as an additional factor in the model relating PSWE to bibliometric performance. We used the mean of the year before and of the ESM (e.g. for ESM 2009, we used mean funding for 2008–2009 and likewise for 2011).
When controlling for the effect of previous funding, PSWE still had a moderately strong association with bibliometric performance (beta 0.39, 95% CI 0.18–0.59). Leadership and social climate were still the strongest factors explaining bibliometric success. The goodness of fit parameters had acceptable values. In comparison with the SEM analyses in , an additional psycho-social indicator was excluded, i.e. IC, innovative climate. With that variable included, the goodness of fit was below the recommended cut-offs for SEM analysis ().
Figure 3. Results from the SEM analysis of the association between PSWE and future bibliometric performance when controlling for funding obtained before and the year of the employee survey. EM: Empowering leadership; FL: Fair leadership; SC: Social climate; IC: Innovative climate; JCWP: Job control of work pace; JCD: Job control of demands. See section Measures for description of the bibliometric indicators.
The next step in the analyses was to, in the same model, introduce the explanatory factors of the time devoted to different job tasks (research time, teaching and clinical work) assessed in the 2009 employee survey. The work tasks were only assessed in the 2009 survey which limited the analysis to 22 observations thus the tasks were introduced separately due to the low number of observations. The results show that even after introducing these as explanatory factors, the PSWE factors were still strongly associated with future bibliometric performance (). Time spent in teaching was shown to have the strongest explanatory negative effect on future bibliometric performance. Time devoted to research contributed only to a small positive effect on future bibliometric performance, while time spent in clinical work showed a small negative association with future bibliometric performance.
Table 5. Results from the SEM analysis of the associations between psycho-social work environment and bibliometrics when introducing time spent on different work tasks into the model. Data from 2009 only.
Transformational leadership and performance
Leadership style, and specifically transformational leadership, has in previous research been shown to be associated with higher academic performance. Therefore, a separate SEM analysis was conducted for all leadership factors measured in the employee survey. The results indicated a relatively strong correlation between leadership and bibliometric performance (beta = 0.39) (). Funding shows a factor of 0.53. The estimates of model fit show that the model has a very good fit when excluding the bibliometric indicator of n top5/N. The highest loadings for leadership were Individualized considerations (DLIC) followed by Fair (FL) and Exemplary model (DLEM), 0.92, 0.90 and 0.89, respectively. The bibliometric indicators of quality had the highest loading, particularly avgJCF (0.99).
Figure 4. Results from the SEM analysis of the association between leadership styles and future bibliometric performance. EM: Empowering; FL: Fair leadership; DLEM: Exemplary model; DLI: Inspiring and motivational; DLIC: Individual considerations.
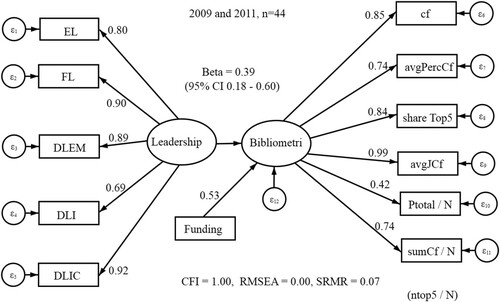
In this model, we also analyzed the effect when excluding funding. The results show that the association between leadership and bibliometric performance was higher, beta = 0.57 95% CI 0.36-0.79 and a similar fit as above. We consider the analysis with funding included as the preferable one to avoid the risk of a somewhat higher and biased estimate of the effect of leadership on bibliometric performance.
Job demand- control (support) model – JDC (S) and performance
In our first SEM model, job control did not fit into the model with the other explanatory factors used and was thus excluded. However, in the model analyzing financial performance (external funding) these factors did contribute to the model. Previous research in work and health lends strong support to the Job-demand-control (support) models, JDC(S), being important as a risk factor for ill-health and production losses, mainly due to sick leave (Fila Citation2016). An additional analysis was therefore conducted to specifically examine all factors in the JDC(S)-model together. The results show that JDC(S) is strongly associated with future bibliometric performance (beta = 0.77, 95% CI 0.61–0.94), with the strongest explanatory factors being social support from colleagues and managers. The most affected bibliometric indicators are again the indicators of quality (JCf, Cf, Share Top5). The estimates of model fit show that the model has an excellent fit, CFI = 1.00, RMSEA = 0.00 and SRMR = 0.04. In this model, we further introduced previous funding (), based on the previously mentioned argument to avoid an increased and biased effect estimate when funding is not included. In this model, the relation between the JDC(S) factors and bibliometric performance decreased somewhat, but was still high, beta = 0.52 (95% CI 0.15–0.88), the parameter for funding was 0.29. The highest loading for demand/control was now for JCWP with a value of 0.79, that is, the indicator that was excluded in our first analysis of a wider scenario of PSWE.
Figure 5. Results from the SEM analysis of the association between job types and future bibliometric performance. JCD: Job control of demands; JCWP: Job control of work pace; JDQ: Job demand of workload; JDD: job demands on decisions; SSC: Social support colleagues; SSM: Social support manager.
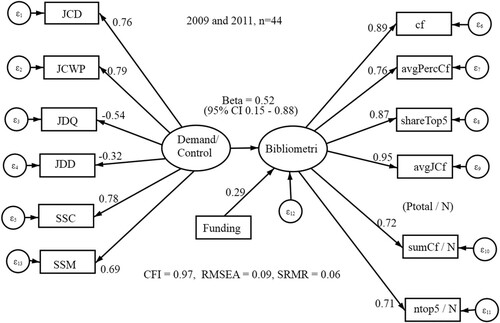
The model fit and the strong associations with the JDC(S) factors remained and decreased only a little. Funding contributed moderately to the model.
Discussion
Several attempts have been made to identify factors associated with success in research, i.e. with enhanced production and benefit to society. Our results may prove to be an important contribution to the field due to the unique longitudinal datasets and the multidisciplinary approach used. They may also be directly applicable to the strategic work of universities who are concerned with improving the quality of research, a prerequisite for excellence and scientific breakthroughs.
The results show that several psycho-social work environment factors including leadership are of major importance for the production of science. A research leader who is fair, who is a good role model and who shows consideration for the individual members of the research team has a strong positive effect on the research performance of the team. Further, a good work climate with supportive colleagues has a positive influence on research performance. Even though indicators of both quantity and quality are associated with the psycho-social work environment, results consistently show that the strongest associations are found between work environment and the indicators of quality, such as publications in high impact journals and the share of the top 5% of publications in the world. Thus, a good psycho-social work environment appears to improve the chances of achieving excellence in research.
The job-demand-control (support) model (JDC (S)) (Fila Citation2016) is a well-established concept in research on occupational health and safety. It has been extensively studied in relation to health. Decades of research have shown that high demands with low control and influence in the work situation is strongly related to future health problems, e.g. CVD, back pain, mental illness. It has further been shown, although not as convincingly, that the so-called buffering effect i.e. reducing demands and increasing control, can support health and well-being (Fila Citation2016). Since the effect on ill-health is well established, we hypothesized in the present study that JDC (S) also affects performance. We found that in the first general model () that the chosen control factors in JDC (S) did not contribute to the explanatory model, however, social support did. But, when analyzed in a separate model, introducing all the factors of the JDC(S) model results again showed that social support from colleagues is of utmost importance for good research performance, that high workload has a negative impact, and high control over work tasks has a positive impact, on research performance.
Being a successful researcher holding a research position involves many different work tasks. These can be categorized into research activities, educational activities (program directors for educational programs, lecturing, supervisions etc.), clinical work (at medical universities) and administrative work. A successful researcher is supposed to have a good-to-excellent performance in all these work tasks. In the present study, we had access to self-reported data on three activities: amount of time spent on research, teaching and clinical tasks in the current position. Introducing these separately into the model showed that amount of time spent on teaching activities was associated negatively with research performance. Amount of research time and clinical work did contribute to the explanatory model but not to a high degree. Overall, the results showed that the work environment, even when controlling for work tasks, was associated with research performance. Female researchers spent significantly more time on teaching and other work tasks.
The term ‘academic housework’ refers to all the academic service work within the department that is performed by academic staff, but that receives little recognition or reward in terms of career advancement. It includes various teaching activities, administrative work and other assignments for the good of the university and its employees (Heijstra, Steinthorsdóttir, and Einarsdóttir Citation2017). It has been shown that junior and female researchers carry the heaviest load of this type of work (Heijstra, Steinthorsdóttir, and Einarsdóttir Citation2017; MacFarlane and Burg Citation2019). In light of our results which shows that time spent in teaching is related to a decreased research production, universities should take measures to prevent inequality by distributing this ‘housework’ equal between the sexes so that independent of sex, researchers have equal opportunities to become successful.
Financial resources are a prerequisite for producing any goods, even a product such as research results. In university settings, funding can be considered a necessary commodity for producing research. However, depending on the resource allocation system at the university, the importance of external funding probably varies (Sandstrom and Van den Besselaar Citation2018). The prevailing hypothesis guiding how many countries allocate research funds is that the more competition, the better the research output, thus the trend for more open, competitive calls and less institutional funding. However, some reports argue that the more funding that is allocated directly to the university, and the less that comes from open calls, the higher the output (Sandstrom and Van den Besselaar Citation2018). If, as at the present investigated university, each research group is highly dependent on external funding, the funding should be a factor to consider when analyzing research performance as, simply put, without money, there can be no studies and thus no publications.
To further elaborate the model, we introduced previous funding into the model. We found that the results regarding the effect of the psycho-social work environment on research performance were still valid, however, the beta values were lower. Previous funding seems to affect research performance to the same degree as the work environment. Thus, from this one can conclude that a university which facilitates funding for its research groups and has good working conditions, with transformative leaders and a supportive climate, has good opportunities to achieve excellence in research production.
Strengths and limitations of the study
The strength of the present study is the prospective longitudinal approach using data from employee surveys to investigate performance during the following three years. Furthermore, performance was measured using only international established performance indicators, obtained from register data. All data on the follow-up measures (performance variables) were complete, i.e. there were no missing data, which further strengthens the study since missing data can be a serious threat in SEM-analyses (Schreiber et al. Citation2006). To facilitate the interpretation of results, we were guided by the recommendations in Schreiber et al. (Schreiber et al. Citation2006).
Even though no causal inference can be drawn when performing ecological studies with aggregated data, using SEM-analysis allows us to model the directions of the associations. Compared to previous cross-sectional and retrospective studies, the prospective data set, together with application of SEM, takes us a step further in the exploration of the causal relationship in what affects research performance.
One limitation of the study is that we only had data from one large university in Sweden and because it was a specialized university, only one discipline (medicine). The academic profession and organizations vary both within Sweden and between disciplines and countries. This limits our possibility to generalize the results to other faculties and other international academic settings. As demonstrated in several studies, there is a great variation across countries and disciplines in higher academic organizations (Clark Citation1987; Techler and Hohle Citation2013). These differences may interact with both work environment and performance factors and thus limit the application of results from one organizational setting to another. Our present results should be interpreted within two different complimentary theoretical frameworks. The theoretical model of scientific performance by Hurley (Citation1997) highlights the importance of the combination of organizational variables with individual variables in predicting performance (Hurley Citation1997). Complementary to Hurley’s model, a theoretical model () including employee health, developed in a joint Nordic project on work place productivity and health, is applicable (Foldspang et al. Citation2014). In this model, the basic assumption is an interaction between employee health status, work environment and other workplace and organizational factors affecting the productivity of the enterprise. In view of this, our results are consistent with previous findings from different international academic settings with other types of performance measures, demonstrating the role of work environmental factors on performance (Ryan and Hurley Citation2007). Furthermore, research from many different types of enterprises and sectors of the labor market has consistently demonstrated the link between work environment and performance, as our study confirms in the academic setting. So, while our study may be viewed as a case study exploring the prospective association between work environment and research productivity, the substantial amount of international research on productivity in other sectors and organizational settings using many different types of outcome measures supports the notion that our results may be valid in other academic settings and countries.
We only had access to aggregated data on department level for the outcome measures, thus limiting the sample size. To try and compensate for that we treated the two separate employee surveys, 2009 and 2011, as independent samples, merging them together into one enlarged database. Treating them as two independent samples was motivated partly by a high turnover rate at the university (short employment, limited tenure positions, PhD students that enter and leave at graduation, post doc positions, etc.) and partly as our descriptive data from the employee survey showed response rates for the two years 2009 and 2011 around 66–68%. Both these facts suggested that a relatively high percentage of subjects were included in only one of the yearly datasets.
As the data was aggregated, it was not possible to introduce confounding factors into the model and this prevented our possibility to control for more individual factors such as e.g. intellectual capabilities, health status, family situation, motivation. Future research should test our results using a larger study sample and ensure access to data on an individual level is available.
Conclusion
The results of this study are consistent with what previous international research has shown. Our study strengthens the state of evidence as it was a longitudinal study using objective indicators of performance. Improving the psycho-social work environment should be considered a vital part of a university’s strategic work, in order to improve research performance. Funding and the work environment together affect the performance of researchers. It is not possible to draw any conclusions on impact on society from the results. However, the bibliometric indicators of research quality, including share of top publications and citations, indicate that the dissemination of research results is improved when the work environment is good and funding is greater. In addition, supporting the international evidence of important factors for scientific performance, new findings from our study show that work demands and perceived influence/control affects research performance. The results further illustrate which leadership dimensions are the most important for research performance.
Acknowledgements
The authors would like to thank the financial department and the university library for astute assistance in attaining the data and for helping us to understand the challenges with bibliometric indicators.
Disclosure statement
No potential conflict of interest was reported by the author(s).
Additional information
Funding
References
- Acock, A. C. 2013. Discovering Structural Equation Modeling Using Stata. College Station: Stata Press.
- Bass, B. M., and P. Steidlmeier. 1999. “Ethics, Character, and Authentic Transformational Leadership Behavior.” The Leadership Quarterly 10 (2): 181–217. doi: https://doi.org/10.1016/S1048-9843(99)00016-8.
- Bergstrom, G., C. Bjorklund, I. Fried, J. Lisspers, L. Nathell, U. Hermansson, A. Helander, L. Bodin, and I. B. Jensen. 2008. “A Comprehensive Workplace Intervention and its Outcome with Regard to Lifestyle, Health and Sick Leave: The AHA Study.” Work 31 (2): 167–80.
- Bjorkqvist, K., K. Osterman, and M. Hjeltback. 1994. “Aggression among University Employees.” Aggressive Behavior 20 (3): 173–84. doi: https://doi.org/10.1002/1098-2337(1994)20:3<173::Aid-Ab2480200304>3.0.Co;2-D. doi: https://doi.org/10.1002/1098-2337(1994)20:3<173::AID-AB2480200304>3.0.CO;2-D
- Bol, T., M. de Vaan, and A. van de Rijt. 2018. “The Matthew Effect in Science Funding.” Proceedings of the National Academy of Sciences 115 (19): 4887–90. doi: https://doi.org/10.1073/pnas.1719557115
- Bornmann, L., and R. Mutz. 2015. “Growth Rates of Modern Science: A Bibliometric Analysis Based on the Number of Publications and Cited References.” Journal of the Association for Information Science and Technology 66 (11): 2215–22. doi:https://doi.org/10.1002/asi.23329.
- Clark, B. R. 1987. The Academic Profession. National, Disciplinary, and Institutional Settings. 1987. BerkeIcy, CA: University of California Press.
- Clarke, M., A. Kenny, and A. Loxley. 2015. Creating a Supportive Working Environment for Academics in Higher Education. Countyr Report Ireland. Dublin: The Irish federation of university teachers.
- Cronin, B., and C. R. Sugimoto. 2014. Beyond Bibliometrics: Harnessing Multidimensional Indicators of Scholarly Impact. Cambridge, MA: The MIT Press.
- Dallner, M., A. Elo, F. Gamberale, V. Hottinen, S. Knardahl, K. Lindström, A. Skogstad, and E. Orhede. 2000. Validation of the General Nordic Questionnaire(QPSNordic) for Psychological and Social Factors at Work. Copenhagen: Nordic Council of Ministers.
- Fila, M. J. 2016. “The job Demands, Control, Support Model: Where are we now?” TKM International Journal for Research in Management 1/1: 15–44.
- Foldspang, Lars, Michael Mark, Laurits Rømer Hjorth, Christian Langholz-Carstensen, Otto Melchior Poulsen, Ulf Johansson, Guy Ahonen, Steinar Aasnæss, and Louise Lund Rants. 2014. Working Environment and Productivity: A Register-Based Analysis of Nordic Enterprises. Copenhagen, Denmark: Nordic Council of Ministers.
- Heijstra, T., F. S. Steinthorsdóttir, and T. Einarsdóttir. 2017. “Academic Career Making and the Double-Edged Role of Academic Housework.” Gender and Education 29 (6): 764–80. doi: https://doi.org/10.1080/09540253.2016.1171825
- Hurley, J. 1997. Organisations and Scientific Discovery. Chichester: Wiley.
- Jensen, I. B., C. Björklund, E. Aboagye, J. Hagberg, and L. Bodin. 2018. Arbetsmiljö och produktivitet inom akademin. En studie om den psykosociala arbetsmiljöns betydelse för forskares prestation. (eng: Working environment and productivity in academia. A study on the importance of the psychosocial work environment for researchers ‘performance. Unit of intervention and implementation research. Kaolinska institute.
- Karasek, Robert, and Töres Theorell. 1990. Healthy Work. New York, USA: Basic Books.
- Larsen, P. O., and M. von Ins. 2010. “The Rate of Growth in Scientific Publication and the Decline in Coverage Provided by Science Citation Index.” Scientometrics 84 (3): 575–603. doi:https://doi.org/10.1007/s11192-010-0202-z.
- Larsson, G. 2006. “The Developmental Leadership Questionnaire (DLQ): Some Psychometric Properties.” Scandinavian Journal of Psychology 47 (4): 253–62. doi:https://doi.org/10.1111/j.1467-9450.2006.00515.x.
- Lohela-Karlsson, M., L. Nybergh, and I. Jensen. 2018. “Perceived Health and Work-Environment Related Problems and Associated Subjective Production Loss in an Academic Population.” BMC Public Health 18 (257).
- Lohela Karlsson, M., G. Bergström, C. Björklund, J. Hagberg, and I. Jensen. 2013. “Production Loss due to ill-Health and Work Environment Problems – Construct Validity and Implications.” JOEM 55 (12): 1475–83.
- MacFarlane, B., and D. Burg. 2019. “Women Professors and the Academic Housework Trap.” Journal of Higher Education Policy and Management 41 (3): 262–74. doi: https://doi.org/10.1080/1360080X.2019.1589682
- Merton, R. K. 1988. “The Matthew Effect in Science 2. Cumulative Advantage and the Symbolism of Intellectual Property.” Isis 79 (299): 606–23. doi: https://doi.org/10.1086/354848
- Moed, H. F. 2005. Citation Analysis in Research Evaluation. Dordrecht: Springer.
- Moed, H. F., R. E. De Bruin, and T. N. Van Leeuwen. 1995. “New Bibliometric Tools for the Assessment of National Research Performance – Database Description, Overview of Indicators and First Applications.” Scientometrics 33 (3): 411. doi: https://doi.org/10.1007/BF02017338
- NIH. 2016. “Citations Per Dollar as a Measure of Productivity.” https://nexus.od.nih.gov/all/2016/04/28/citations-per-dollar/.
- Perc, M. 2014. “The Matthew Effect in Empirical Data.” Journal of The Royal Society Interface 11 (98): 20140378. doi:https://doi.org/10.1098/rsif.2014.0378.
- Rinia, E. J., T. N. van Leeuwen, H. G. van Vuren, and A. F. J. van Raan. 1998. “Comparative Analysis of a set of Bibliometric Indicators and Central Peer Review Criteria: Evaluation of Condensed Matter Physics in the Netherlands.” Research Policy 27 (1): 95–107. doi: https://doi.org/10.1016/S0048-7333(98)00026-2
- Ryan, James C, and John Hurley. 2007. “An Empirical Examination of the Relationship Between Scientists’ Work Environment and Research Performance.” R&D Management 37 (4): 345–54.
- Sandstrom, U., and P. Van den Besselaar. 2018. “Funding, Evaluation, and the Performance of National Research Systems.” Journal of Informetrics 12 (1): 365–84. doi:https://doi.org/10.1016/j.joi.2018.01.007.
- Schreiber, J. B., A. Nora, F. K. Stage, E. A. Barlow, and J. King. 2006. “Reporting Structural Equation Modeling and Confirmatory Factor Analysis Results: A Review.” The Journal of Educational Research 99 (6): 323–38. doi: https://doi.org/10.3200/Joer.99.6.323-338.
- Tangen, S. 2005. “Demystifying Productivity and Performance.” International Journal of Productivity and Performance Management 54 (1): 34–46. doi: https://doi.org/10.1108/17410400510571437.
- Techler, U., and E. A. Hohle. 2013. The Work Situation of the Academic Profession in Europe: Findings of a Survey in Twelve Countries. Dordrecht, Netherlands: Springer.
- Van, R., and F. J. Anthony. 2006. “Statistical Properties of Bibliometric Indicators: Research Group Indicator Distributions and Correlations.” Journal of the American Society for Information Science and Technology 57 (3): 408–30. doi: https://doi.org/10.1002/asi.20284
- Wenner-Gren International Series. 2014. Bibliometrics: Use and Abuse in the Review of Research Performance. Stockholm: Wennergren Centre.
- Widenberg, L. 2003. “Psychosocial Research Environment and Scientific Productivity. Gothenburg: Department of Psychology, University of Gothenburg.