
ABSTRACT
Rising inflation and slow growth globally have led to governments focussing on value for money, and in the sphere of higher education policy that is often translated into graduate outcomes. In England, the Office for Students (OfS) has created the progression metric which for full-time, first degree and UK domiciled students requires courses to have 60% of graduates with positive outcomes 15 months after graduation. This paper utilises simulations to evaluate the likelihood that the OfS’s approach will fail to identify courses below the threshold (false positives) and incorrectly identify courses at or above the threshold (false negatives). The simulation adapts the levels of positive outcomes within the population (20-90%), sample size (40–1000), percentage sampled (30-90%) and crucially confidence intervals applied (90%, 95% and 99%) to identify courses below threshold. The three main findings are: the choice of 90% CI minimises the likelihood of false positives compared to 95% or 99% CIs; second, larger samples are essential to reduce likelihood of false positives; and third, preferring the 95% confidence interval instead of 99% for taking regulatory action will result in more courses incorrectly identified as below threshold. Governments that choose a statistical approach to regulate educational standards, like the application of confidence intervals to identify provision below quality standards, should utilise simulations to check the likelihood of false positives and false negatives since failure to do so could lead to both: (a) courses below standard not being identified and (b) regulatory action taken incorrectly against provision at or above standards.
Introduction
Over the last couple of years, countries around the world have experienced challenging economic conditions often with high inflation and slowing growth rates, which has led to an increased focus from the government and the public on the value for money (IMF Citation2023; ONS Citation2022). In higher education policy this has led to a drive to measure and evaluate the value for money of higher education. Whilst higher education has many benefits (e.g. often creating citizens who are more likely to volunteer, vote, engage in healthier lifestyles), the debate is often reduced to economic benefits of higher education, like the likelihood of graduates gaining a professional occupation (Brand Citation2010; De Walque Citation2004; Droomers et al. Citation1999; Feinstein and Duckworth Citation2006; Ma, Pender, and Welch Citation2016). One example of this approach is England’s Office for Students (OfS) B3 progression metric which requires that all UK domiciled full time and first-degree graduate coursesFootnote1 have 60% of their students gain a positive outcome (OfS Citation2022c) which is defined as professional occupation or further studyFootnote2 within 15 months of their degree (OfS Citation2022b). Failure to attain the threshold could lead to financial penalties and, in the worst-case scenario, the removal of degree-awarding powers. We know from previous work by Bradley and Quigley (Citation2023) that the progression metric is at a population level accurate; however, the precision of its confidence intervals drops with smaller sample sizes. This imprecision makes classification and detection of underperforming courses increasingly unreliable the closer one gets to a threshold like 60% (leading to false positives). This analysis does not address the important question regarding how such imprecision impacts false negative misclassifications, or – to put more simply – whether a university provision will be investigated when it is actually above the threshold; nor Bradley and Quigley (Citation2023) tackle the issue of how regulatory preference of one confidence level to another may affect false positive and false negative rates.
The present research aims to explore how the OfS’s choices of confidence intervals for investigation and regulatory action impact the correct classification of courses as above or below the threshold. We know from a consultation with the sector (containing responses of 244 participants) that the OfS’s selection of levels at which statistical confidence is set, handling of statistical significance and sample size were all important concerns raised within the consultation (Alma Economics Citation2022). These choices are of fundamental importance to providers who may receive financial and reputational damage should incorrect classification occur (i.e. identifying a provider below baseline despite their true population value being at or above a threshold). We shall now review international approaches to measuring and evaluating employability before looking in detail at England’s approach to regulating employability, and outlining the current study.
Measuring employability internationally
There are a number of different metrics that can be used to assess employability from whether a graduate is employed or unemployed, to how much a graduate gets paid, if the work is professional (as for teachers, doctors, solicitors) or nonprofessional (i.e. customer service advisor, bar staff), and whether there are horizontal (e.g. graduates employed in an area unrelated to their studies) or vertical mismatches (such as a job which does not match the level of education attained) (McGuinness, Pouliakas, and Redmond Citation2018; Somers et al. Citation2019). These metrics are either tracked through administrative data collected by government bodies or through large-scale surveys of graduates. As an example of administrative data in the UK, the Longitudinal Educational Outcomes (LEO) dataset collects earnings one, three and five years after graduation (Department for Education Citation2017, Citation2024). However, administrative data is unlikely to be able to tell us how meaningful graduates find their careers, the extent to which they utilise skills from their degree, or the indicators of the quality of the jobs they do – their level of autonomy, or amount of responsibilities, etc.
To address these types of questions and many others, a large-scale survey can be conducted by governments, sector bodies or implemented by higher education institutions. For example, the EU has launched Eurograduate Pilot survey which sampled 21,000 bachelor and master’s graduates from eight EU countries (Austria, Czechia, Croatia, Germany, Greece, Lithuania, Malta and Norway) with plans to have a comprehensive graduate tracking system – survey and administrative – across the European Education Area by 2025 (European Commission Citation2021; European Commission et al. Citation2020a, Citation2020b). Data when gathered from administrative records or a survey is rarely inert; instead, it is often used to evaluate current educational practices and encourage change through different policy levers.
How employability is evaluated across different countries
Governments have a range of different mechanisms at their disposal to ensure that higher education institutions focus on the outcomes of their graduates: from soft touch, information-based approaches (i.e. providing employment rates or salaries of graduates from universities/courses to prospective students) to harder, more financial based approaches; we review three harder approaches.
The first approach uses employability outcomes to directly impact the funding that higher education institutions receive. For example, in Denmark, funding of higher education programmes is dependent on graduate employment rates at 12–23 months after graduation, or in Finland tracking of graduate outcomes will determine 2% of the performance-based funding for universities (European Commission et al. Citation2020b).
The second approach uses labour market information to identify skills needs within the economy, which is then used to adjust the number of places on courses available or which impacts the costs of courses depending upon how sought for those graduates are in the labour market. For example, a consultation in 2022 by the English government suggested reducing the number of places available on courses which are known to have poor labour market outcomes (Department for Education Citation2023).
The third approach is to design specific targets that universities and their courses have to meet or surpass in order to avoid financial or regulatory consequences, like fines or the removal of degree-awarding powers. The problem with setting targets or having performance-related funding when graduate outcomes are measured using self-report surveys (often with small samples of the population) is that their ability to estimate the true employability values within the population can be inaccurate, thus leading to incorrect imposition of fines or erroneous reductions to performance-based financial funding.
England’s approach to measuring and regulating employability
This work focuses on the Office for Students (OfS) who regulate English HE providers. The OfS have in the past three years brought in a series of reforms, such as the B3 condition of registration, modified the Teaching Excellence Framework (TEF) and introduced Access and Participation Plans (APP) to address widening participation. These three reforms contain the progression metric; however, it is only the B3 that currently has scope to incur serious financial penalties and more existential threats (like the revoking of degree-awarding powers), hence this has become the focus of the current research.
The progression metric is the percentage of graduates who are either in professional work, further study, or are caring, retired or travelling after 15 months. The thresholds applied to the progression metric vary by mode of study (full time, part time or apprenticeship) as well as by level of study (first degree, masters, other undergraduate, etc.) (OfS Citation2022c). So, for example, a full-time first degree has a threshold of 60% in a positive outcome, which is also the centre of interest for the present study since it represents the largest population of students (in particular, 58% of the total student population in 2021/2022 academic year (HESA Citation2023a)) – as compared to a full-time Post Graduate Certificate in Education which has an 85% threshold (OfS Citation2022c). To further complicate the picture, in addition to different thresholds by mode and level of study, there are also split indicators which include different subject areas of study, gender, ethnicity, disability and relative deprivation measures (OfS Citation2022a).
In all instances where a threshold exists, the OfS will begin investigation when the upper edge of the 90% confidence interval falls below a threshold and can take regulatory action when the upper 95% confidence interval is below the threshold (OfS Citation2022a). The implications of such actions for English providers are serious, with potentially fines up to £500,000, restricting students access to finances, removing degree-awarding powers (OfS Citation2022a). With more countries now collecting graduate outcomes data (European Commission et al. Citation2020a), there will be a temptation for policymakers to possibly follow a path similar to the Office for Students in England, therefore it is essential that the impact of sampling error and sample size on the application of confidence intervals to adjudicate provision above or below thresholds are more clearly understood.
Current study
Previously, Bradley and Quigley (Citation2023) assessed accuracy of the composite Proceed metric (in the present research we refer directly to its revised ‘Progression’ constituent) through the following measures: bias (difference between sample and population estimate), coverage probability (proportion of true population estimates within confidence intervals) and precision (average range of confidence intervals). Three main findings were highlighted: (a) the Progression metric is accurate in terms of projected bias and coverage probability, (b) the estimates lack precision, especially with small sample sizes and (c) the imprecision will impact the Progression metric ability to correctly classify courses as below or above a set numeric threshold. However, this study did not identify the likelihood of false negatives which is crucial to understanding whether university provision will be falsely investigated or have regulator action taken against them. Second, this study does not ask the question of whether a 99% confidence interval would be more appropriate than the current levels of 90% and 95%; therefore, it was not in a position to provide alternatives to the OfS current paradigm.
In light of Bradley and Quigley’s analysis of how this inherent inexactness of statistical measurements and confidence intervals bears non-negligible challenges for the OfS to evaluate providers’ performance effectively, the present study aims to explore the consequences of regulatory choices in setting thresholds for investigating and taking enforcement measures against universities for poor graduate outcomes. Thus, it investigates if and what changes can be deployed to mitigate related problems. Currently, the OfS uses a 90% confidence interval (CI) below a 60% thresholdFootnote3 to trigger an investigation and a 95% CI to provide evidence for taking regulatory action which can include financial penalties and even, at the extreme, revoking degree-awarding powers. The decision of the choice of a confidence interval is therefore an important consideration for the OfS and providers. Simulation of varying levels of confidence intervals are used to show how choice of 90%, 95% or 99% confidence levels influences risks of misclassifying courses:
which fall below a 60% threshold for positive outcomes and
incorrectly investigating and acting against courses at or above the threshold.
Second, we predict 90% CI will have the greatest likelihood of misclassifying courses above the threshold whilst 99% (false negative) will have the lowest likelihood.
Method
Simulation description
This study is a simulation study designed to replicate the OfS B3 progression metric. For the present simulation, we needed to reproduce three key variables used by Bradley and Quigley (Citation2023): the percentage with a positive outcome, population size and percentage sample. Each is outlined in more detail below.
First, the percentage of graduates in the population with a positive outcome varied from 20% up to 95% increasing by 5% increments (20%, 25%, … , 95%). These levels were chosen as limits because anything less than 20% was not likely to be identified as above the 60% target and anything greater than 95% would be unlikely to be identified as below the threshold.
Second, we vary the population size from 40 students up to 1000 students going up in increments of 10. These limits were chosen as it was thought to be unlikely that courses below 40 students would be included as the OfS does not use samples less than 23 students (OfS Citation2022b).
Third, we varied the percentage sampled from the population from a minimum of 30%, as set by the OfS, to 90% going up in increments of 5% (30%, 35%, … , 90%) (OfS Citation2022b).
Simulation procedure
To create the simulation, we took as a model the simulation procedure and code produced in Bradley and Quigley (Citation2023). Similarly, we implemented the following three steps: data generation, sampling of the data and calculating statistics from each of the samples.
Data generation involved the creation of 97 data frames each with 16 variables (columns). The 97 datasets, representing student outcomes, went from 40 rows in length up to 1000 rows long in ten increments per dataset (e.g. the second dataset had 50 rows). Each row symbolises a graduate with a positive outcome (1) or negative outcome (0). Each variable within a data frame represented a population with a certain percentage of positive outcomes. The first variable in a dataset had 20% of the rows with a 1 symbolising a population with 20% positive outcomes, whilst the second variable had 25% with a positive outcome, and this percentage increased by 5% in each variable till the 16th variable which had 95% with a positive outcome.
The second step was to take a randomly selected sample, without replacement, from each of the 16 variables in each of the 97 datasets. This sample varied from 30% of the population to 90% of the population. This process was then repeated 100 times for each of the 16 variables in all 97 datasets.
Finally, from each of the samples, four statistics were calculated. The first one is the percentage with a positive outcome/graduate job. Then, three levels of confidence intervals – 90%, 95% and 99%. The Jeffreys method has been used to calculate confidence intervals, since Jeffreys confidence intervals were chosen by the OfS as they are known to have favourable properties when estimating intervals on binomial proportions and when used on small samples (Brown, Cai, and DasGupta Citation2001; OfS Citation2022b). Due to the OfS not using a student population of less than 23, any samples with less than this number were removed before analysis (20,800 cases were removed). The final dataset had 1,996,800 observations. Simulations were performed with R Studio (version 2023.06.2 Build 561) running R version 4.3.0 and using four packages (‘tidyverse’, ‘DescTools’, ‘kableExtra’, ‘modelsummary’). All the data and code for simulation are available from the Open Science Framework (OSF): https://osf.io/pd43c/?view_only = bb46a701d69846d99c0518616737df4f.
Confidence interval measure
Unlike Bradley and Quigley (Citation2023), in addition to the 90% and 95% confidence intervals we also included a 99% confidence interval and, crucially, calculated measures of false positives and false negatives which are described in more detail below.
False positives
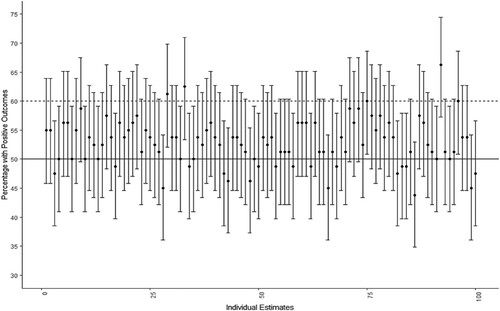
In this study, false positive misclassifications describe the cases when an upper limit of a confidence interval, that is calculated for an estimate from a population with less than 60% with a positive outcome, crosses the 60% threshold, and so there could be not enough statistical certainty to believe that a provider’s underlying performance can indeed be below the threshold. For instance, shows different estimates for a population with 50% in positive outcomes and their respective confidence intervals set at 90% level of statistical confidence. It can be observed that in 72 out of 100 cases, the upper limit of the confidence interval crosses the 60% threshold. Therefore, University ‘X’ could have an underperforming course with 50% of positive outcomes, yet – due to sampling and the quality of statistical evaluations around uncertainty levels – confidence intervals may fail to identify it correctly (or with strong enough statistical evidence) as below.
Figure 1. This graph depicts 100 estimates with 90% CI from a population with 50% of positive outcomes and a sample size of 80 students from a course of 160 students. The figure shows how many samples would not be properly identified as below the 60% threshold.
False negatives
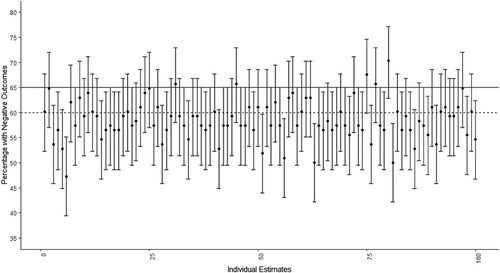
False negative misclassifications denote in this study the cases when a population level of positive outcomes is at or above the 60% threshold, but the sampled estimate and the upper limit of its respective confidence interval suggest the course is below the threshold. For example, has a population of 65% with positive outcomes and shows that 5 times out of 100 the samples with the upper limits of their 90% CIs falsely suggested that the underlying performance of the courses were below the threshold. Thus, University ‘Y’ could be wrongly identified as underperforming due to sampling when, in fact, the unknown level of positive outcomes was 65% – above the threshold.
Figure 2. This graph depicts 100 estimates with 90% CI from a population with 65% of positive outcomes and a sample size of 108 students from a course of 360 students. Five samples would be identified as being below the 60% limit with an upper confidence interval below the 60% threshold.
Odds ratio
In the end, binomial logistic regression modelling was used to determine odds of false positives and false negatives at 90%, 95% and 99% levels of confidence intervals. In addition, for each type of misclassifications odds ratios across the three confidence intervals were calculated. This was done in order to quantify and provide a clearer explanation of the change in risk rates associated with the variables under study.
Results
False positive misclassification
Mean risk levels
Risks of false positive misclassifications present themselves at different degrees for different levels of confidence intervals: the lowest risks are recorded for 90% CI, while the highest – for 99% CI. In fact, demonstrates that on average 8.22% of courses will have an upper confidence interval above the 60% threshold if 90% CI is applied to an estimation. When 95% CI is used to measure providers’ performance, the mean value for such false positives will rise by 28.8% to 10.59, and if 99% CI is used for evaluation, then the percentage of false positives almost doubles and reaches 15.71%.
Table 1. Demonstrates the number and percentage of false positives by confidence intervals.
A logistic regression model was performed using 90, 95 and 99% CIs to predict the likelihood of misclassifying a course as being above the 60% threshold when it is not. shows that choosing 95% CI over 90% CI as the measure of performance, the odds of misclassifying courses as being potentially above the threshold will grow on average by 32%. At the same time, odds of false positives are more than 2 times higher if 99% CI is set compared to the 90% CI.
Table 2. Results of a logistic regression model predicting the likelihood of misclassification by 95% and 99% CIs compared to 90%.
Risks of false positives using 90%, 95%, 99% confidence intervals with varying percentages in positive graduate outcomes
As the percentage in positive outcomes approaches the 60% threshold so do the risks of false positives. shows that, when 95% CI is deployed for samples from the population level of 55% with a positive outcome, more than a half of courses (56.27%) will not be classified as being sufficiently below the 60% threshold. Using a lower 90% CI, this number will decrease to 45.13%. Setting a higher 99% level, instead, means that more than three quarters (76.41%) of courses will be classified as not having very strong statistical evidence of low performance. The issue of appropriate choice of confidence interval level is more apparently acute since, even for a population with as low as 45% of courses with a positive outcome (15% lower than the threshold), degrees of false positive classifications are identified to be non-trivial at 12.65% for the 99% CI, 7.78% for the 95% and 5.67% for the 90% CI.
Table 3. Illustrates how the percentages in graduate jobs impact the number of false positives for 90%, 95% and 99% CIs.
Risks of false positives using small sample sizes
demonstrates a significant inability for small sample sizes (especially, of 100 or less) to accurately identify courses below the 60% threshold, even when the graduate outcomes are as low as 40 or 45% with positive outcomes. For example, when 45% have a positive outcome within the population with a sample of 50 or less, there is an 80% chance that a course will not be correctly identified as being below the threshold if 99% CI is chosen. Setting lower confidence levels however, such as 95% and 90%, a lesser degree of considerably underperforming courses will remain undetected – respectively, 61% and 50%. Yet, the numbers remain very high when the percentage with positive outcomes gets closer to the 60% threshold. Even using 90% CI for estimation of populations with 55% of students in positive outcomes, 87% of courses with sample sizes of less than 50 students and three quarters (74%) of those comprising 51–100 will not provide enough statistical certainty to be classified as below the threshold. Under these circumstances, deployment of 99% confidence level would lead to almost all of the ‘low-value’ courses (98.73% for 24–50 sample size and 94.4% for 51–100) being unidentified.
Figure 3. These graphs depict the percentage of false positive cases by confidence interval and sample size that is sampled from the population. Each graph represents the percentage with a positive outcome in the population starting from 40% top left to 55% bottom right. The horizontal lines represent levels of error expected for each confidence interval: the dotted line (•••) – 10% error for 90% CI; the dashed line (- - -) – 5% error for 95% CI.
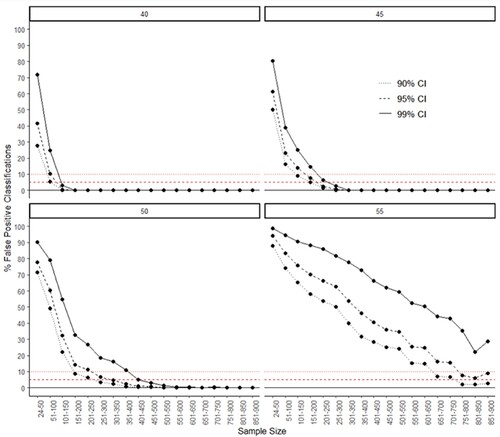
and clearly show how in many situations distinctively higher rates of false positive classifications are for 99% CI, while 90% and 95% CIs are at much closer levels. Nevertheless, in certain occasions increasingly higher sample sizes grant similarly good results in false-positive performance regardless of a confidence interval level applied. For example, when there are 50% of positive outcomes in a population, sample sizes over 550 help identify markedly as below the threshold more than 99% of courses even if 99% CI is set. At 45% of graduates with positive outcomes the same result is achieved already with sample sizes over 350. Yet, any similar extent of considerable reduction and assimilation in CI efficiency is hardly detectable in case of various response rates (as represented by percentages of populations sampled in ).
Figure 4. These graphs depict the percentage of false positive cases by confidence interval and percentage of the population that is sampled. Each graph represents the percentage with a positive outcome/graduate job in the population starting from 40% top left to 55% bottom right. The horizontal lines represent levels of error expected for each confidence interval: the dotted line (•••) – 10% error for 90% CI; the dashed line (- - -) – 5% error for 95% CI.
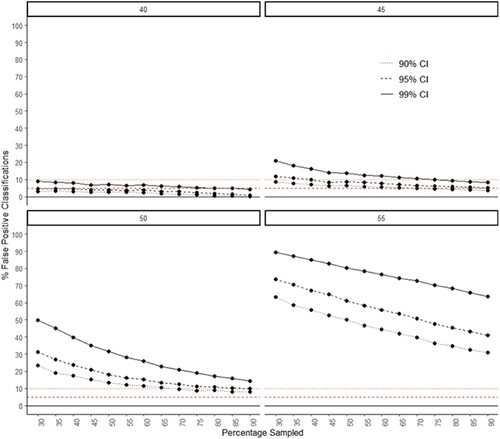
Overall, across populations with different levels of attaining a positive outcome, there are increasing rates of false positives from 90% to 95% to 99% CIs. For instance, highlights that on average, when a population with 55% of positive outcomes is sampled, using 99% CI rather than 90% will increase the odds of false positives by almost 4 times, while applying 95% CI – only by a factor of 1.56. Even for courses lying farther from the 60% threshold, such as with 50% of positive outcomes in a population, a similar picture is observed: the respective values of growth in odds for 95% and 99% CIs as compared to 90% are 1.39 and 2.67.
Table 4. Results of two logistic regression models on positive outcomes at 50% and 55% in the population with 90%, 95% and 99% CIs.
False negatives
Mean risk levels
shows that risks of false negative misclassifications represent much lower levels in comparison to false positive classifications. When 90% CI is selected, only 0.57% of courses will be treated incorrectly as those falling below the 60% threshold; while measuring their performance via 95% and 99% CIs, the amount of such misclassifications will be merely 0.24% and 0.03% respectively. Notably, this false negative phenomenon presents an inverted dependency on confidence intervals used upon estimations as opposed to the cases of false positives: the higher the level of a confidence interval is, the lower is the rate of misclassifications.
Table 5. Demonstrates the number and percentage of false negatives by confidence intervals on samples with 60% or above in positive outcomes.
Risks of false negatives using 90%, 95%, 99% confidence intervals for percentages with positive outcomes getting closer to the 60% threshold
The risk of misclassifying courses as underperforming reaches quite tangible numbers when percentages of a population with a positive outcome are very close to the threshold. For instance, demonstrates that rates of false negatives will be zero or close to zero for all three levels of confidence intervals when the populations of 70% or even 65% of graduates with positive outcomes are sampled. However, for the population of 60% with a positive outcome the usage of 90% CI will markedly increase the risk to 4.41%. 95% CI observes 1.86% of misclassifications and 99% CI – only 0.2%.
Table 6. Illustrates how the number of false negatives fluctuates for 90%, 95% and 99% CIs depending on the percentages in graduate jobs.
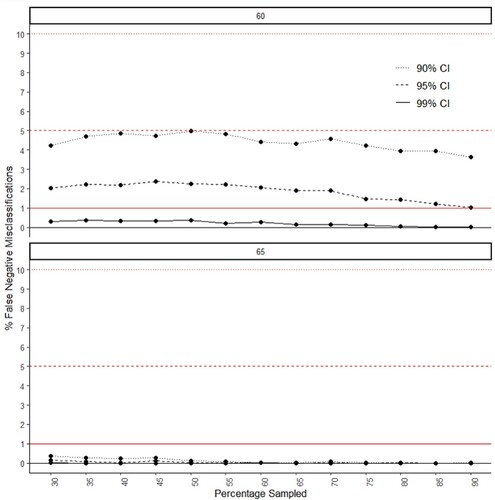
demonstrates that selecting 90% CI for different sample sizes can even lead to the evaluation of more than 5% of courses as underperforming and, in case of our simulation, this choice resulted in up to 7.71% of misclassifications (for samples between 551 and 600). Unlike in the case of false positive classifications, various levels of sample sizes or percentages of a population sampled (see ) presented less apparent impact on false negative misclassifications, decreasing at higher sample sizes and response rates. Yet, importantly, and illustrate how the false negative rates are greatly reduced with the deployment of 95% CI and almost completely eliminated when 99% CI is applied.
Figure 5. These graphs illustrate the percentage of false negative cases by confidence interval and sample size that is sampled from the population. The two graphs represent the percentage with a positive outcome/graduate job in the population: 60% top and 65% bottom. The horizontal lines represent levels of error expected for each confidence interval: the dotted line (•••) – 10% error for 90% CI; the dashed line (- - -) – 5% error for 95% CI; the straight line (━) – 1% error for 99% CI.
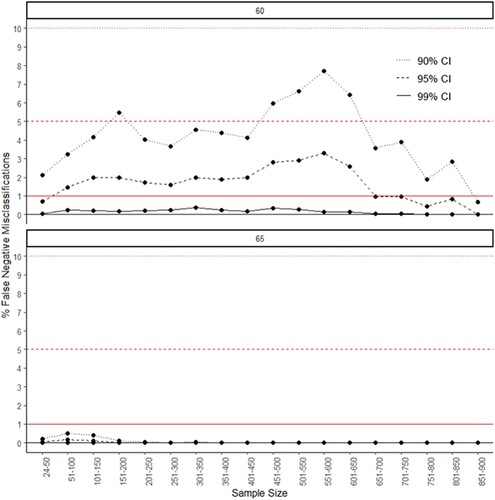
Figure 6. These graphs illustrate the percentage of false negative cases by confidence interval and the percentage of the population that is sampled. The two graphs represent the percentage with a positive outcome/graduate job in the population: 60% top and 65% bottom. The horizontal lines represent levels of error expected for each confidence interval: the dotted line (•••) – 10% error for 90% CI; the dashed line (- - -) – 5% error for 95% CI; the straight line (━) – 1% error for 99% CI.
summaries that, in general, deploying 95% CI we experienced a decrease of 58.2% in the odds of false negative misclassification, while a reduction of the odds of 95.5% is observed when setting 99% CI.
Table 7. Results of a logistic regression model predicting the likelihood of false negatives by 95% and 99% CIs as compared to 90%.
Discussion
The OfS's approach to using statistical measures when considering a provider’s performance has not faced unanimous support: a considerable share of respondents to their consultation on the metrics in question either disagreed with the approach (17%), or abstained from declaring their position (13%) – in total, almost a third of all respondents (Alma Economics Citation2022). Therefore, our research tries to address prevalent doubts with regard to the OfS's numeric thresholds and indicators, bearing in mind that the choice by the OfS of parameters determining the progression metric is of substantial importance both for higher education providers and for the regulatory body itself. For the former, the confidence interval applied could make the difference between financial penalties and even revocation of degree-awarding powers though universities’ effective results, without sample error, may meet the established targets. For the OfS, inaccurate calculations could mean an inability to identify low-value courses resulting for the government in poor returns on investment in funding students on these courses. This simulation provides three main findings: (1) the 90% CI is better at reducing false positives; (2) the size of the sample matters since larger samples see reductions in false positives; (3) 99% CI can substantially reduce false negatives. These three findings will now be discussed in more detail.
One prominent theme within the OfS’s sector consultation centred around the handling of statistical uncertainty with respondents frequently questioning the choice of 90% and 95% as being too low to be optimal (Alma Economics Citation2022). Our simulation directly addresses this commonly raised concern showing that the 90% CI delivers better results in terms of prevention of false positive cases. 95% and 99% CIs due to wider ranges of values will usually have a greater likelihood of misclassifying courses as potentially above an established threshold while their underlying performance is below. This illustrates that the regulator by choosing the 90% level as the criterion for launching investigation of underperforming providers should be able to more accurately discern courses as those below the threshold. On average, using 90% CI instead of 99% CI will result in an almost two-fold decrease in unidentified courses, and they will reduce by a third when the 90% level is preferred to 95%. This guarantees a greater degree of regulatory efficiency at the first stage of intervention (i.e. time and money saved on investigating courses).
The consultation with the sector also found a number of respondents voicing concerns around small samples (especially from smaller providers or those ‘providing highly specialist/technical courses where small cohorts are unavoidable’) leading to unfair judgements of outcomes (Alma Economics Citation2022, 44). The results from the simulation validate these concerns and highlight the importance of larger samples to reduce the risk of false positives. For example, for sample sizes between 24 and 50 students of the population with 50% in positive outcomes, the rate of false positives ranged widely from 71.42% (90% CI) to 90.41% (99% CI), and the equivalent range was from 49.13% (90% CI) to 79.21% (99% CI) with samples having 51–100 students. But for sample sizes comprising from 551 to 600 respondents, the number of false positive misclassifications was below 1% even with 99% CI. Small sample sizes – in particular, those involving less than 100 respondents – incur significant challenges in identifying courses that have fallen below the threshold. This issue is particularly pressing considering that the latest OfS data for the progression metric based on 2017–2020 surveys of courses at all levels and modes of study (excluding those with no outcome indicator values) revealed 47% of samples being under 100 students. This finding has two implications: first, every effort possible should be made to enhance the response rates to the graduate outcomes surveys which have over recent years seen declining numbers of respondents (HESA Citation2023b). One way to do this is through the use of financial incentives to increase response rates (Church Citation1993; Singer et al. Citation1999). Second, regulators ought to be wary of trying to regulate at micro-levels, such as courses, since their ability to identify courses’ true population value accurately will be impaired (Bradley and Quigley Citation2023). Inherently, smaller universities and courses are disadvantaged since, in view of the statistical nature of the progression metric, their survey results are more prone to be erroneous.
Respondents to the consultation were right to highlight that lower confidence intervals can at times have adverse consequences (Alma Economics Citation2022). For example, the simulations show that choosing 99% CI instead of 95% to take concrete regulatory actions against courses would help to reduce from 2% to 0.2% the risk of false negatives. As it currently stands, if we estimate using the last four years of data across all modes and levels of study, split indicators for each provider across all the years of the survey from the OfS data dashboard (Citation2023a) and select progression indicator values between 0-1% above threshold, we estimate 534 cases. Using the 95% CI, 10 would be incorrectly identified as below the level – compared to 1 if 99% CI were used. That means nine additional providers (or multiple areas within a provider) could have part of their provision incorrectly identified as below the threshold who could be liable to investigation and, if these did not come back positively, financial and regulatory penalties.
It should be noted that in between identification and financial/regulatory penalties the OfS does conduct an investigation with inspectors on the ground (for example, see OfS Citation2023b), nevertheless, the procedures this follows are yet to be fully spelt out. It would seem prudent for the OfS to adopt 99% CI instead of 95% CI to provide greater confidence and trust within its regulatory framework since it can’t be sure which area of provision that is below the threshold with 95% CI is below due to sample error, as opposed to their real population value falling short of the threshold.
Limitations
Whilst this research accounts for sampling error, it should be recognised that measurement error is also important for accurate assessment (Mokkink et al. Citation2023), and we know from an evaluation conducted by HESA and the Office for National Statistics that there was around a 10% error in positive outcomes (HESA Citation2021) – in this case, professional occupations – being categorised as a negative outcome (i.e. non-professional job). Measurement error would add further noise to false positives and false negatives, therefore this work could well represent a lower bound to these phenomena.
Finally, a broad point is that the OfS’s conceptualisation of a positive outcome primarily in terms of professional occupation or further study is rather narrow since the benefits of HE extend well beyond attaining professional-level jobs: contributing to citizens being more socially and politically conscious, leading healthier lifestyles, engaging in more volunteering and providing more educational activities for their children (Ma, Pender, and Welch Citation2016). It would be useful to create a more comprehensive measure of the value of HE that would be holistically designed to capture a broad range of outcomes beyond professional-level employment.
Conclusions and recommendations
The findings of this article address important concerns raised by the sector on the management of statistical uncertainty, the challenge of smaller samples and the accuracy with which smaller provider results and smaller areas of provision can be understood. The results showed the 90% confidence interval was a good choice as an investigation threshold since it represents a reasonable level of certainty that the expected value lies within its range and minimises false positives. But the simulated effects of sample sizes and the latest graduate outcomes survey results suggest that the metric is to be dealt with care. The simulation clearly highlights that the best way to minimise false negatives is to use the 99% confidence interval which helps to fairly adjudicate where provision is at the threshold. If the OfS continues to use the 95% confidence level, around 2% of courses at the threshold – as the simulation study indicates – would be incorrectly identified as below which, given financial and reputational consequences of investigation, ought not to be taken lightly. Therefore, we recommend that the OfS continues to use the 90% threshold for investigation, but adopts the 99% threshold for regulatory action. We also recommend that the OfS works closely with Jisc/HESA who run the graduate outcomes survey to ensure actions are taken to boost response rates which have been consistently falling since the 2019/2020 release.
Another major contribution this article aspires to provide is demonstration of how the simulation technique can be a valuable and useful tool to inspect the implications of higher education policy decisions in real time and cost-effective manner. In the field of higher education policy, resorting to simulations could help to clearly showcase the relative trade-offs of different policy decisions and provide an empirical evidence base for those policy decisions.
Author contributions
VA is the guarantor. AB and VA created the simulator data. VA analysed the data. VA and AB drafted the manuscript. All authors read, provided feedback and approved the final version of the manuscript.
Consent to publish
All authors approved the final manuscript before it was sent off for review.
Ethics approval
No ethics approval was required since no data was collected.
Data availability statement
The dataset and code to reproduce the results are available from the Open Science Framework at: https://osf.io/pd43c/?view_only = bb46a701d69846d99c0518616737df4f.
Disclosure statement
No potential conflict of interest was reported by the author(s).
Additional information
Funding
Notes
1 Courses are assessed at the Common Aggregation Hierarchy 3 level. For more details see: https://www.hesa.ac.uk/support/documentation/hecos/cah
2 Those graduates that are caring, retired or travelling are also counted as a positive outcome (OfS Citation2022b).
3 As said above, threshold levels vary by mode and level of study. However, for readability the 60% threshold is chosen as this applies to first-degree, full-time students who make up the majority of the student population.
References
- Alma Economics. 2022. “A New Approach to Regulating Student Outcomes: Analysis of Consultation Responses.” https://www.officeforstudents.org.uk/media/7301/alma_student_outcomes.pdf.
- European Commission, Shane Beadle, Patricia Vale, Sigrid Mannsberger-Nindl, Arthur Hannah, Ali Zaidi, Claudia Abdallah and Andrea Kottmann. 2020b. “Mapping the State of Graduate Tracking Policies and Practices in the EU Member States and EEA Countries.” https://doi.org/10.2766/09070.
- Bradley, Alex, and Martyn Quigley. 2023. “Governments Harnessing the Power of Data to Get ‘Value for Money’: A Simulation Study of England’s Office for Students B3 Proceed Metric.” Studies in Higher Education 48 (8): 1289–302. https://doi.org/10.1080/03075079.2023.2196292.
- Brand, Jennie E. 2010. “Civic Returns to Higher Education: A Note on Heterogeneous Effects.” Social Forces 89 (2): 417–33. https://doi.org/10.1353/sof.2010.0095.
- Brown, Lawrence D., T. Tony Cai, and Anirban DasGupta. 2001. “Interval Estimation for a Binomial Proportion.” Statistical Science 16 (2): 101–33. https://doi.org/10.1214/ss/1009213285.
- Church, Allan H. 1993. “Estimating the Effect of Incentives on Mail Survey Response Rates: A Meta-Analysis.” Public Opinion Quarterly 57 (1): 62–79. https://doi.org/10.1086/269355.
- Department for Education. 2017. “Employment and Earnings Outcomes of Higher Education Graduates by Subject and Institution: Experimental Statistics Using the Longitudinal Education Outcomes (LEO) Data.” https://assets.publishing.service.gov.uk/government/uploads/system/uploads/attachment_data/file/718225/SFR_18_2017_LEO_mainText.pdf.
- Department for Education. 2023. “Higher Education Policy Statement and Reform: Government Consultation Response.” https://assets.publishing.service.gov.uk/media/6516a49b6a423b0014f4c5fe/CP876_Higher_Education_policy_statement_and_reform_government_consultation_response_web_.pdf.
- Department for Education. 2024. “LEO Graduate Outcomes Provider Level Data.” Department for Education: Explore Education Statistics. https://explore-education-statistics.service.gov.uk/find-statistics/graduate-outcomes-leo-provider-level-data/2021-22.
- De Walque, Damien. 2004. Education, Information, and Smoking Decisions Evidence from Smoking Histories, 1940–2000. Washington, DC: World Bank Group. http://documents.worldbank.org/curated/en/408411468760767791/Education-information-and-smoking-decisions-evidence-from-smoking-histories-1940-2000.
- Droomers, Mariël, Carola T. M. Schrijvers, Karien Stronks, Dike van de Mheen, and Johan P. Mackenbach. 1999. “Educational Differences in Excessive Alcohol Consumption: The Role of Psychosocial and Material Stressors.” Preventive Medicine 29 (1): 1–10. https://doi.org/10.1006/pmed.1999.0496.
- European Commission. 2021. “European Graduate Tracking Initiative Demystified.” https://data.europa.eu/doi/10.27665990.
- Feinstein, Leon, and Kathryn Duckworth. 2006. “Are There Effects of Mothers’ Post-16 Education on the Next Generation?: Effects on Children’s Development and Mothers’ Parenting.” https://discovery.ucl.ac.uk/id/eprint/10005969/1/Feinstein2006Are.pdf.
- HESA (Higher Education Statistics Authority). 2021. Graduate Outcomes Soc Coding - Independent Verification Analysis Report. https://www.hesa.ac.uk/files/Graduate-Outcomes-SOC-coding-Independent-verification-analysis-report-20210429.pdf.
- HESA (Higher Education Statistics Authority). 2023a. “Who’s Studying in HE?” HESA. https://www.hesa.ac.uk/data-and-analysis/students/whos-in-he.
- HESA (Higher Education Statistics Authority). 2023b. “Graduate Outcomes 2020/21: Summary Statistics – Summary.” HESA. https://www.hesa.ac.uk/news/31-05-2023/sb266-higher-education-graduate-outcomes-statistics.
- IMF (International Monetary Fund). 2023. “World Economic Outlook: Navigating Global Divergences.” https://www.imf.org/-/media/Files/Publications/WEO/2023/October/English/text.ashx.
- Ma, Jennifer, Matea Pender, and Meredith Welch. 2016. “Education Pays 2016: The Benefits of Higher Education for Individuals and Society.” https://files.eric.ed.gov/fulltext/ED572548.pdf.
- McGuinness, Seamus, Konstantinos Pouliakas, and Paul Redmond. 2018. “Skills Mismatch: Concepts, Measurement and Policy Approaches.” Journal of Economic Surveys 32 (4): 985–1015. https://doi.org/10.1111/joes.12254.
- European Commission, Christoph Meng, Katarina Wessling, Kai Mühleck, and Martin Unger. 2020a. “Eurograduate Pilot Survey: Design and Implementation of a European Graduate Survey.” https://doi.org/10.2766/149071.
- Mokkink, Lidwine B., Iris Eekhout, Maarten Boers, Cees P. M. van der Vleuten, and Henrica C. W. de Vet. 2023. “Studies on Reliability and Measurement Error of Measurements in Medicine – From Design to Statistics Explained for Medical Researchers.” Patient Related Outcome Measures 14:193–212. https://doi.org/10.2147/prom.s398886.
- OfS (Office for Students). 2022a. “Consultation on a New Approach to Regulating Student Outcomes: Analysis of Responses to Consultation and Decisions.” https://www.officeforstudents.org.uk/media/7362/regulating-student-outcomes-analysis-of-responses-reformatted.pdf.
- OfS (Office for Students). 2022b. “Description of Student Outcome and Experience Measures Used in OfS Regulation: Definition of Measures and Methods Used to Construct and Present Them.” https://www.officeforstudents.org.uk/media/8060/description-of-student-outcome-and-experience-measures.pdf.
- OfS (Office for Students). 2022c. “Setting Numerical Thresholds for Condition B3.” https://www.officeforstudents.org.uk/media/7522/setting-minimum-numerical-thresholds-for-condition-b3.pdf.
- OfS (Office for Students). 2023a. “Student Outcomes Data Dashboard.” Accessed November 30, 2023. https://www.officeforstudents.org.uk/data-and-analysis/student-outcomes-data-dashboard/get-the-data/.
- OfS (Office for Students). 2023b. “Quality Assessments.” Office for Students. https://www.officeforstudents.org.uk/for-providers/quality-and-standards/quality-assessments.
- ONS (Office for National Statistics). 2022. “Global Inflation: 1970 to 2022.” Office for National Statistics. https://www.ons.gov.uk/economy/inflationandpriceindices/articles/globalinflation/1970to2022.
- Singer, Eleanor, John van Hoewyk, Nancy Gebler, Trivellore Raghunathan, and Katherine McGonagle. 1999. “The Effect of Incentives on Response Rates in Interviewer-Mediated Surveys.” Journal of Official Statistics 15 (2): 217–30.
- Somers, Melline A., Sofie J. Cabus, Wim Groot, and Henriëtte Maassen van den Brink. 2019. “Horizontal Mismatch Between Employment and Field of Education: Evidence From a Systematic Review.” Journal of Economic Surveys 33 (2): 567–603. https://doi.org/10.1111/joes.12271.