Abstract
Coccidiosis is a significant disease of poultry caused by different species of Eimeria. Differentiation of Eimeria species is important for the quality control of the live attenuated Eimeria vaccines derived from monospecific lines of Eimeria spp. In this study, high-resolution melting (HRM) curve analysis of the amplicons generated from the second internal transcribed spacer of nuclear ribosomal DNA (ITS-2) was used to distinguish between seven pathogenic Eimeria species of chickens, and the results were compared with those obtained from the previously described technique, capillary electrophoresis. Using a series of known monospecific lines of Eimeria species, HRM curve analysis was shown to distinguish between Eimeria acervulina, Eimeria brunetti, Eimeria maxima, Eimeria mitis, Eimeria necatrix, Eimeria praecox and Eimeria tenella. Computerized analysis of the HRM curves and capillary electrophoresis profiles could detect the dominant species in several specimens containing different ratios of E. necatrix and E. maxima and of E. tenella and E. acervulina. The HRM curve analysis identified all of the mixtures as “variation” to the reference species, and also identified the minor species in some mixtures. Computerized HRM curve analysis also detected impurities in 21 possible different combinations of the seven Eimeria species. The PCR-based HRM curve analysis of the ITS-2 provides a powerful tool for the detection and identification of pure Eimeria species. The HRM curve analysis could also be used as a rapid tool in the quality assurance of Eimeria vaccine production to confirm the purity of the monospecific cell lines. The HRM curve analysis is rapid and reliable and can be performed in a single test tube in less than 3 h.
Introduction
Coccidiosis of chickens is an intestinal parasitic disease caused by one or more species of the protozoan parasite genus Eimeria (Apicomplexa: Eucoccidia: Eimeriidae), and is one of the commonest and economically most important diseases of poultry worldwide (Shirley et al., Citation2005). This disease causes production losses, and sometimes leads to high mortality. While the control of coccidiosis has relied mainly on the preventative use of anti-coccidial drugs (coccidostats), together with the induction of species-specific natural immunity in chicken flocks (Shirley et al., Citation2004, Citation2005), this widely used approach is costly and has led to serious problems with drug resistance in Eimeria populations (Williams, Citation1998). Thus, live attenuated or precocious vaccines are now finding widespread application, particularly in intensive establishments (Williams, Citation2002b; Shirley et al., Citation2004, Citation2005).
Since the immunity in chickens is specific to a particular species of Eimeria, vaccines need to contain each relevant species (usually multiple) in order to be effective. Live, attenuated (sporulated oocyst) vaccines containing three to seven species of Eimeria have been released. These include Livacox® Q, Livacox® T, Paracox®, Paracox® 8 and Eimeriavax® 4m (Shirley, et al., Citation1995; Shirley & Bedrnik, Citation1997; Williams, Citation1998, Citation2002a, Citationb). A number of Eimeria vaccine candidates have been attenuated by selection for the ability to replicate in chicken embryos (Long, Citation1974; Shirley, Citation1979; Norton & Joyner, Citation1981; Long et al., Citation1982; Gore et al., Citation1983), but most attenuated lines have been selected for rapid passage (i.e. having a shortened pre-patent period) through the chicken host (Shirley & Bedrnik, Citation1997). Consequently, they have a low reproductive potential and have a reduced virulence, but still have a strong immunogenicity in chickens (Shirley & Bedrnik, Citation1997; Shirley et al., Citation1995; Williams, Citation1998). Therefore, such vaccines (with or without preventative, chemotherapeutic treatment) provide the best prospects for the control of coccidiosis in the immediate future (Chapman et al., Citation2002; Shirley et al., Citation2005).
Central to the production of such live vaccines is the maintenance (by serial passage) of monospecific lines of Eimeria in chickens under stringent conditions. The production of live vaccines via propagation and passage in chickens is expensive and they can be readily contaminated during production and/or processing. Therefore, the production of such vaccines on a commercial scale requires the rigorous monitoring of quality, including species composition at each step of production. Traditionally, conventional coproscopic methods were used for the detection and enumeration of Eimeria oocysts purified from the faeces from infected chickens. However, given that there is significant overlap in the size and shape of oocysts between/among some species of Eimeria (Long & Joyner, Citation1984), a range of molecular-diagnostic methods have been developed (Morris & Gasser, Citation2006). A number of previous studies (Schnitzler et al., Citation1998, Citation1999; Fernandez et al., Citation2003) have developed polymerase chain reaction (PCR)-based techniques for detection and identification of Eimeria species. However, these techniques are relatively time-consuming, as they require agarose gel electrophoresis for visualization of the PCR products (Schnitzler et al., Citation1998; Fernandez et al., Citation2003), or lack the capacity to detect non-specific (false positive) amplifications (Schnitzler et al., Citation1999). Rapid real-time PCR assays specific to four species of Eimeria have recently been described (Blake et al., Citation2008) but require separate reaction tubes for detection of each of the species tested. Also, other PCR-coupled techniques such as high-throughput capillary electrophoresis, high-resolution electrophoretic procedures and single-strand restriction fragment length polymorphism analysis have found applicability (Woods et al., Citation2000a, Citationb; Gasser et al., Citation2005; Morris et al., Citation2007a, Citationb). While these approaches have been useful and effective, they have relied on the high-resolution analysis of denatured PCR products on electrophoretic gels, taking a day to carry out. The advent of high-resolution melting (HRM) curve analysis circumvents the use of such gels, substantially decreasing the analysis time, and has been reported to achieve high mutation detection rates for amplicon sizes of 100 to 300 base pairs (bp) (Wittwer et al., Citation2003; Herrmann et al., Citation2006; Varga & James, Citation2006). In the present study, we report a simple and effective PCR-coupled HRM, using the ITS-2 region, for the verification of monospecificity of Eimeria lines maintained in chickens specifically for commercial anti-coccidia vaccine production, and discuss the implications of such a tool.
Materials and methods
Eimeria species and isolates
Monospecific lines of Eimeria (originally isolated from naturally infected chickens in Australia; ) were passaged in specific pathogen-free chickens held in custom-built isolators under stringent conditions to prevent cross-contamination. Eimeria were originally identified to species based on the morphometry of sporulated oocysts, the prepatent period, the location of gross lesions in the intestine(s) and using PCR-coupled capillary electrophoretic analysis of the second internal transcribed spacer of nuclear ribosomal DNA (ITS-2), as described previously (Gasser et al., Citation2005). Between four to eight isolates from each of the seven known species of Eimeria were used in this study. The isolates were labelled as follows: Eimeria acervulina (A4, A14, A16, A23, A35, A38, A65), Eimeria brunetti (B2, B12, B15, B17, B21, B29), Eimeria maxima (M5, M20, M25, M48, M50, M51, M91), Eimeria mitis (Mt2, Mt4, Mt8, Mt9), Eimeria necatrix (N4, N7, N13, N16, N32, N42, N52, N90), Eimeria tenella (T2, T5, T8, T11, T14, T15, T16), and Eimeria praecox (P2, P3, P7, P11, P12, P33, P67).
Table 1. Melting points for the peaks and HRM curve profiles of ITS-2 PCR products from selected Eimeria isolates
Extraction of genomic DNA
Oocysts were isolated from faeces using saturated NaCl (Shirley et al., Citation1995), washed extensively in 50-ml volumes of water and made up to a final aqueous suspension (10 ml containing 5×10⁶ oocysts). The oocysts were then purified using a sucrose-gradient centrifugation method (Gasser et al., Citation1987), which removed faecal components inhibitory to the PCR, washed (as previously) and then resuspended in 1 ml water. Glass beads, proteinase K and sodium dodecyl sulphate were added, and the sample was vortexed and incubated overnight at 37°C. DNA was isolated from oocysts using a Wizard® Genomic DNA Purification Kit (Promega) and eluted in 50 µl water (thus containing DNA from approximately 105 oocyts/µl). The concentration of eluted DNA ranged from 30 to 150 ng/µl as determined by spectrophotometry absorbance at 260 nm.
PCR amplification
The PCR was carried out as reported previously (Woods et al., Citation2000a), using oligonucleotide primers WW2 (5′-ACGTCTGTTTCAGTGTCT-3′) and WW4r (5′-aaattcagcgggtaacctcg-3′). The PCR was performed in 25 µl volumes, containing 200 µM each dATP, dCTP, dGTP and dTTP, 2mM MgCl2, 250 µM each primer, 0.5 U GoTaq (Promega), 5x buffer, 5 µM SYTO®9 green fluorescent nucleic acid stain (Invitrogen) and, with the exception of the no-template control, 2 µl genomic DNA (from approximately 2×10⁵ oocysts). The detection limit of GoTaq was 1 to 2 pmol DNA, as previously shown (Gasser et al., Citation2001). The amplification mixture was incubated at 94°C for 3 min, then 35 cycles of 94°C for 30 sec, 55°C for 30 sec, 72°C for 60 sec, with a final incubation at 72°C for 3 min. In each set of reactions, water instead of template was included as a negative control. Amplification of target sequences was carried out in triplicate on a RotorGene thermal cycler (RG6000; Corbett Research Pty Ltd). Optical measurements in the green channel (excitation at 470 nm and detection at 510 nm) were recorded during the extension step. Following the PCR, samples were subjected to agarose gel electrophoresis, capillary electrophoresis (CE) analysis and/or HRM curve analysis.
Agarose gel electrophoresis
After PCR, 10 µl individual amplicons were mixed with 2 µl loading buffer (10 mM NaOH, 95% formamide, 0.05% of both bromophenol blue and xylene cyanole) and the intensity of selected samples verified on SYBR safe™ (Invitrogen)-stained 2% agarose gels using 0.5x TBE (65 mM Tris–HCl, 27 mM boric acid, 1 mM ethylenediamine tetraacetic acid, pH 9; Bio-Rad) as the buffer, and molecular weight marker (PCR marker; Sigma) as a size marker. After electrophoresis, gels were photographed (Kodak) upon ultraviolet transillumination.
Capillary electrophoresis
CE was performed according to the method described previously (Gasser et al., Citation2005). Briefly, primer WW2 labelled with 6-fluorescein (FAM) was used in the PCR. The PCR products were subjected to electrophoresis on Long-Ranger gels in an ABI Prism 377 DNA Sequencer. The resultant gel image was captured, and the chromatograms analysed and compared using GelScan software.
HRM curve analysis
After completion of the PCR cycles, the melt curve was generated by increasing the temperature from 71°C to 90°C at different ramp speeds from 0.1 to 0.8 °C/sec and recording fluorescence. HRM curve analysis was performed using the software Rotor-Gene 1.7.27, with normalization regions of 72 to 73 and 88 to 89 and an average confidence threshold of approximately 90%.
Results
Adjustment of the yield of PCR products
To adjust the yield of the PCR products prior to HRM analysis, PCR was performed and the amount of products generated from each Eimeria species was visualized by gel electrophoresis. Adjustments to the dilution of the DNA template were made to obtain approximately the same visual staining density for the PCR products. shows examples of PCR products generated from a representative isolate from each of the Eimeria species. As expected, amplicons of approximately 490 bp were generated for E. tenella, 340 bp for E. maxima, 390 bp for E. acervulina, 450 bp for E. mitis, 530 bp for E. preacox, 560 bp for E. necatrix and 430 bp for E. brunetti.
Figure 1. Agarose gel electrophoresis of PCR products of the ITS-2 gene from different Eimeria species: A, E. acervulina; B, E. brunetti; M, E. maxima; MT, E. mitis; N, E. necatrix; T E. tenella; and P, E. praecox. MW, molecular weight marker (PCR marker; Sigma).
Correlation of the HRM melt-curve profiles of the ITS-2 PCR products with those of CE profiles
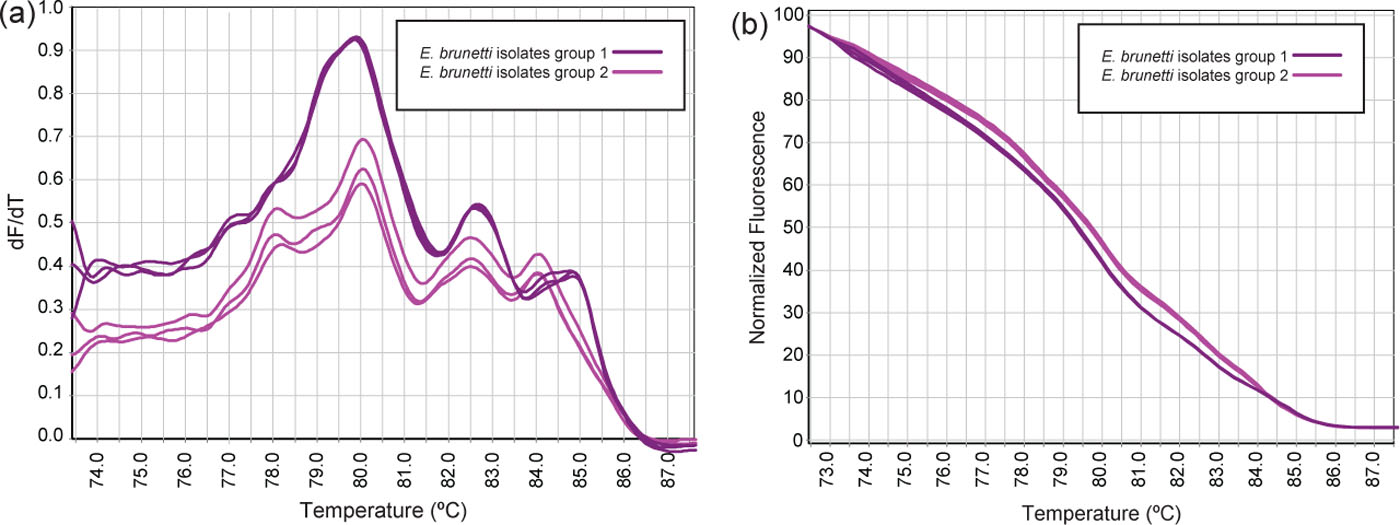
A subset of monospecific Eimeria species vaccine lines, as determined by their CE profile and morphological analysis, were selected and subjected to PCR of the ITS-2 region and HRM curve analysis. Preliminary optimization revealed that melting between temperatures 75°C and 90°C with an optimal ramp of 0.2°C/sec resulted in detectable and consistent differences between species (). Lower ramps resulted in variation in isolates from E. brunetti ().
Figure 2. Representative (a) and conventional (b) normalized HRM melt curves of PCR products of the ITS-2 gene from different Eimeria species.
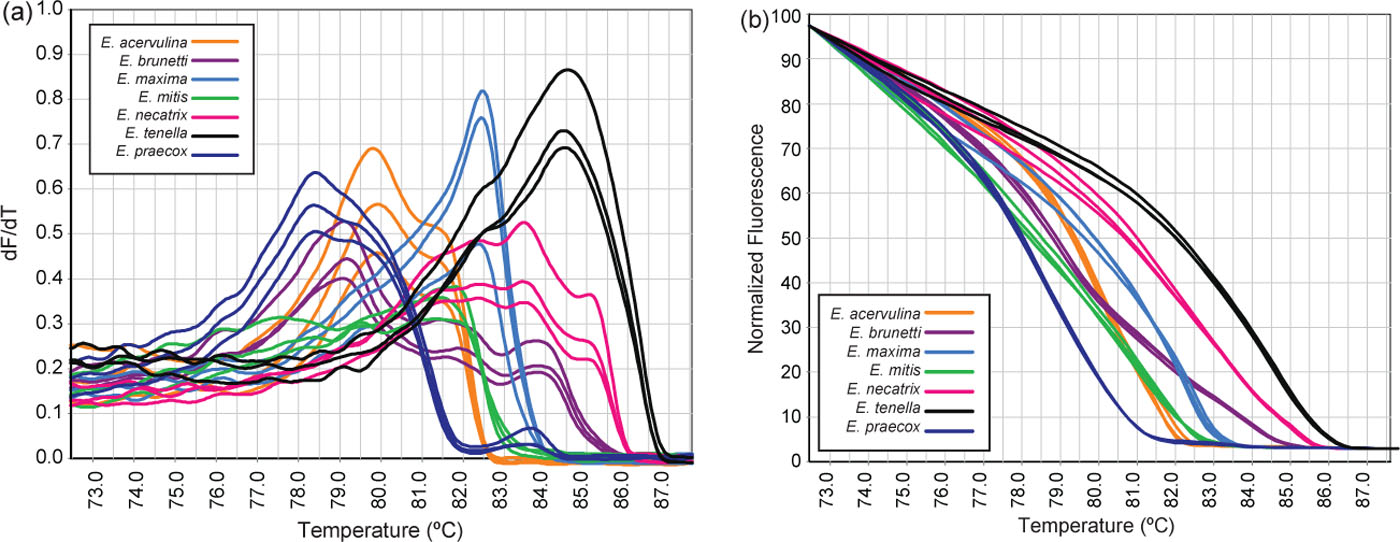
Figure 3. Replicates of (a) conventional and (b) normalized HRM melt curves of PCR products of the ITS-2 gene from E. brunetti isolates.
Using an optimal ramp of 0.2°C/sec, one, two or three peaks were generated between 75°C and 90°C depending on the species tested ( and a). E. maxima, E. mitis and E. tenella all generated one major peak. E. acervulina generated two major peaks, with the right peak being slightly smaller. E. praecox generated two peaks, as well, with one being a minor shoulder peak at higher temperature than the major peak. E. brunetti generated three peaks, with two smaller shoulder peaks at higher temperature than the major peak. E. necatrix generated three peaks, one smaller shoulder peak on either side of the major peak. Analysis of the conventional (a) or normalized curves (b) revealed seven distinct HRM genotypes in agreement with the CE profiles (). Eimeria species with identical CE profiles generated identical HRM genotypes. For example, Eimeria isolates A4, A14 and A16 produced the same HRM curve profile (a). Similarly isolates B2 and B5, and B12 also produced the same profile (b). Several HRM runs (performed on different days) using at least one representative from each profile resulted in only minor variations in melting temperatures of the peaks (). Following normalization of data, genotypes were consistent with those described in .
Table 2. Melting points for the peaks of different profiles resulted from several runs of ITS-2 PCR followed by HRM curve analysis
Sensitivity of the HRM curve analysis for the detection of impurities in Eimeria species
To assess the capacity of HRM curve analysis for the detection of specimens containing mixture of species, all combinations of two species of Eimeria, at similar concentrations, were assessed. Visual assessment of the conventional and normalized curves could distinguish both species within each mixture, with the genotype of the mixture represented as “variation” after analysis of the melt curve by the software (). shows an example of conventional (a) and normalized (b) melt curves resulting from an E. acervulina and E. necatrix mixture.
Figure 4. Conventional (a) and normalized (b) HRM melt curves of E. acervulina, of E. necatrix and of a mixed sample (1:1 ratio).
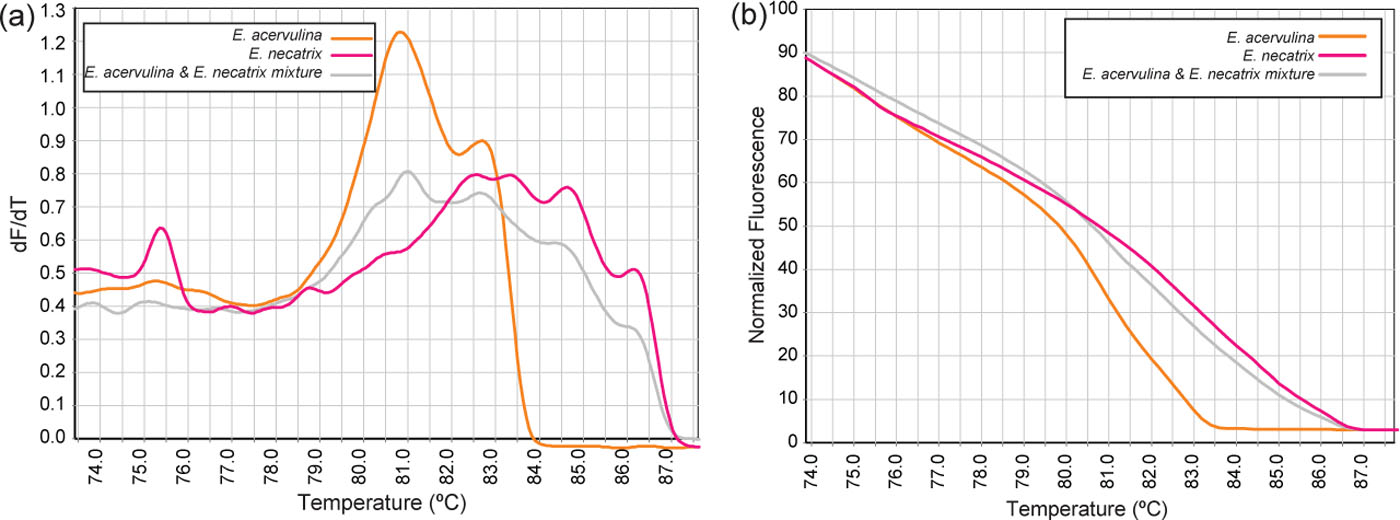
Table 3. Capacity of HRM curve analysis for the detection of two species of Eimeria mixed at similar concentrations
To further assess the capacity of the HRM curve analysis for detection of small amounts of contaminating Eimeria species, DNA from four representative isolates of the known Eimeria species (E. acervulina, E. maxima, E. necatrix and E. tenella) were spiked (simulating contamination) with other Eimeria species and subjected to CE and HRM curve analysis. Different combinations of DNA from two species of Eimeria were mixed into one PCR reaction at various concentrations and were subjected to ITS-2 PCR followed by either CE or HRM curve analysis (). Examples of the melt curve and HRM analysis for E. tenella and E. acervulina mixtures (, reactions 6 to 9) and the pure species are shown in a,b. Both CE and HRM curve analysis could detect the dominant species in all samples. The presence of the exact minor species was detected in 4 and 3 specimens by CE and HRM curve analysis respectively. Variation in HRM curve analysis was detected where the exact minor species could not be defined.
Figure 5. Conventional (a) and normalized (b) melt curves of E. acervulina and E. tenella mixed samples at 1:1, 1:10−3 and 10−3:1 ratio.
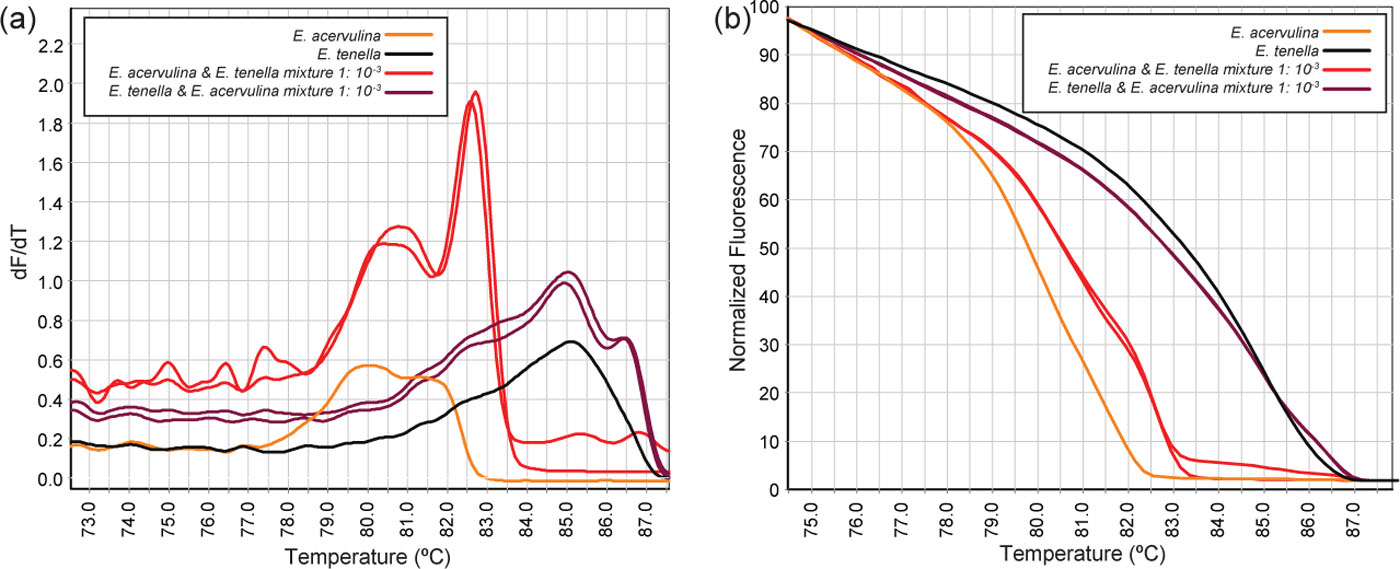
Table 4. Detection limits of mixed sample examples (dominant and minor amounts) using the CE and the HRM methods
Discussion
The present study describes, for the first time, the use of real-time PCR followed by melt curve analysis for detection and classification for Eimeria species, and also provides a comparison between this newly developed method and CE for detection of impurities in the Eimeria vaccine batches.
Current molecular methods for differentiation of pathogenic chickens Eimeria species include nucleotide sequence analysis and CE. Nucleotide sequencing is now available to many diagnostic facilities at a low cost, and CE is also relatively inexpensive to perform. However, both these techniques require sophisticated equipment, are time-consuming procedures and require skill for interpretation of the results. Performing HRM melt-curve analysis also requires relatively expensive equipment (real-time thermocycler), although in recent years, with the introduction of real-time PCR assays for varieties of pathogens, a real-time thermocycler has become an inevitable and essential piece of equipment in every diagnostic laboratory. In contrast to nucleotide sequencing and CE, the HRM curve analysis is rapid and convenient, with all relevant procedures including PCR and melt-curve analysis able to be performed in a single tube and one machine. An additional advantage of the HRM curve analysis is that it can be performed in an automated module, obviating the need for extensive interpretation of results. Furthermore, with each unknown specimen, a library of prototype profiles can be used to facilitate determination of the identity of the profile and possible inter-species variation or to facilitate the discovery of a new species. Research within our laboratory has shown that such a library of prototype PCR products (which include SYTO®9) can be reused several times without a detectable effect on the melting curve temperature (results not shown). This is in agreement with previous studies (Herrmann et al., Citation2006; Morris et al., Citation2007b) in which SYBR Green I was compared with SYTO®9, with SYTO®9 shown to produce highly reproducible DNA melting profiles and to be less selective in its incorporation into particular amplicons.
Experience with HRM curve analysis in our laboratory has shown that a higher level of consistency and reproducibility of HRM curve profiles are achieved when similar quantities of PCR products are used for comparison (unpublished data). In this study, adjustment of the quantity of PCR products prior to HRM curve analysis was carried out by a preliminary PCR, visualization and quantification of the PCR bands on an agarose gel and subsequent adjustments of the template DNA. Alternatively, adjustment of the quantity of PCR products prior to HRM curve analysis can be carried out rapidly by spectrophotometry and adjustment of the template DNA.
Results from this study show that the HRM method can detect species impurities (variations/contaminants) more reliably than CE, although visual examination of the HRM curves could only determine which species was contaminating the dominant species in some cases. Further research and analysis may be required to investigate the criteria for interpretation (visual and software based genotyping) of curves of mixed-species samples. Once these criteria are established, determining the contaminations in an otherwise ‘pure’ species will be feasible.
Only two combinations of Eimeria species (E. maxima and E. necatrix; and E. acervulina and E. tenella) were used in this study to investigate the capacity of the HRM curve analysis for detection of minor populations. The combination of E. maxima and E. necatrix were chosen since both these species inhibit mainly the same part of the intestinal tract (mid-intestine). The combination of E. acervulina and E. tenella was also chosen to examine the combination of two other Eimeria species in the Eimeriavax® 4m that was available for this study.
Results from this study also showed that the HRM curve analysis can detect small differences between specimens identified by other techniques as the same species (e.g. samples of E. brunetti). Whether the difference detected was a reflection of interstrain ITS-2 sequence variation or due to impurities in some of the specimens was not investigated in this study. However, this highlights an additional advantage of HRM curve analysis that may also be useful for detecting new or mutated species in the field.
Although quantification of Eimeria spp was not a primary aim of this study, the HRM curve analysis described here demonstrated some capacity to do so. A number of previous studies (Blake et al., Citation2006, Citation2008; Swinkels et al., Citation2006, Citation2007) have developed assays for quantification of Eimeria spp., but they lack the cross-species breadth of the real-time PCR HRM curve analysis described here. Further studies are necessary to fully investigate the capacity of the real-time PCR HRM curve analysis for quantification of Eimeria spp.
The undiluted (extracted Eimeria) DNA used in PCR contained DNA from approximately 2×10⁵ oocyts/2 µl. Considering the 10−4 dilution of the template for E. maxima and E. acervulina used as examples to examine the capacity of the HRM curve analysis for detection of minor oocyst population (), it can be postulated that the HRM curve analysis can potentially detect as few as 20 contaminant oocysts in a 2×10⁵ alternative oocyst population.
In summary, the combination of PCR and HRM curve analysis is a rapid and specific technique for the characterization of Eimeria species. The entire process including PCR and HRM curve analysis can be completed within 2 to 3 h. This time-frame obviously excludes the time required for recovery of oocysts and extraction of DNA prior to PCR. Studies are currently under way in our laboratory to adopt and adapt this assay as the first-stage tool for rapid direct identification of Eimeria in clinical specimens collected from diseased birds.
Acknowledgements
Funding for this project was provided by the Australian Poultry Cooperative Research Centre. The authors would like to thank Tony Belfiore and Penelope Steer for technical support.
References
- Blake , D.P. , Hesketh , P. , Archer , A. , Shirley , M.W. and Smith , A.L. 2006 . Eimeria maxima: the influence of host genotype on parasite reproduction as revealed by quantitative real-time PCR . International Journal of Parasitology , 36 : 97 – 105 .
- Blake , D.P. , Qin , Z. , Cai , J. and Smith , A.L. 2008 . Development and validation of real-time polymerase chain reaction assays specific to four species of Eimeria . Avian Pathology , 37 : 89 – 94 .
- Chapman , H.D. , Cherry , T.E. , Danforth , H.D. , Richards , G. , Shirley , M.W. and Williams , R.B. 2002 . Sustainable coccidiosis control in poultry production: the role of live vaccines . International Journal of Parasitology , 32 : 617 – 629 .
- Fernandez , S. , Pagotto , A.H. , Furtado , M.M. , Katsuyama , A.M. , Madeira , A.M. and Gruber , A. 2003 . A multiplex PCR assay for the simultaneous detection and discrimination of the seven Eimeria species that infect domestic fowl . Parasitology , 127 : 317 – 325 .
- Gasser , R.B. , Eckert , J. and Rohrer , L. 1987 . Infectivity of Swiss Giardia isolates to jirds and mice, and in vitro cultivation of trophozoites originating from sheep . Parasitology Research , 74 : 103 – 111 .
- Gasser , R.B. , Woods , W.G. , Wood , J.M. , Ashdown , L. , Richards , G. and Whithear , K.G. 2001 . Automated, fluorescence-based approach for the specific diagnosis of chicken coccidiosis . Electrophoresis , 22 : 3546 – 3550 .
- Gasser , R.B. , Skinner , R. , Fadavi , R. , Richards , G. and Morris , G. 2005 . High-throughput capillary electrophoresis for the identification and differentiation of seven species of Eimeria from chickens . Electrophoresis , 26 : 3479 – 3485 .
- Gore , T.C. , Long , P.L. , Kogut , M. and Johnson , J. 1983 . Attenuation of Eimeria necatrix and E. tenella of U.S. origin by serial embryo passage . Avian Diseases , 27 : 569 – 576 .
- Herrmann , M.G. , Durtschi , J.D. , Bromley , L.K. , Wittwer , C.T. and Voelkerding , K.V. 2006 . Amplicon DNA melting analysis for mutation scanning and genotyping: cross-platform comparison of instruments and dyes . Clinical Chemistry , 52 : 494 – 503 .
- Long , P.L. 1974 . Further studies on the pathogenicity and immunogenicity of an embryo-adapted strain of Eimeria tenella . Avian Pathology , 3 : 255 – 268 .
- Long , P.L. and Joyner , L.P. 1984 . Problems in the identification of species of Eimeria . Journal of Protozoology , 31 : 535 – 541 .
- Long , P.L. , Johnson , J. and Gore , T.C. 1982 . Attenuation of a strain of Eimeria mivati of U.S. origin by serial embryo passage . Avian Diseases , 26 : 305 – 313 .
- Morris , G.M. and Gasser , R.B. 2006 . Biotechnological advances in the diagnosis of avian coccidiosis and the analysis of genetic variation in Eimeria . Biotechnology Advances , 24 : 590 – 603 .
- Morris , G.M. , Woods , W.G. , Grant Richards , D. and Gasser , R.B. 2007a . The application of a polymerase chain reaction (PCR)-based capillary electrophoretic technique provides detailed insights into Eimeria populations in intensive poultry establishments . Molecular Cell Probes , 21 : 288 – 294 .
- Morris , G.M. , Woods , W.G. , Richards , D.G. and Gasser , R.B. 2007b . Investigating a persistent coccidiosis problem on a commercial broiler-breeder farm utilising PCR-coupled capillary electrophoresis . Parasitology Research , 101 : 583 – 589 .
- Norton , C.C. and Joyner , L.P. 1981 . Eimeria acervulina and E. mivati: oocysts, life-cycle and ability to develop in the chicken embryo . Parasitology , 83 : 269 – 279 .
- Schnitzler , B.E. , Thebo , P.L. , Mattsson , J.G. , Tomley , F.M. and Shirley , M.W. 1998 . Development of a diagnostic PCR assay for the detection and discrimination of four pathogenic Eimeria species of the chicken . Avian Pathology , 27 : 490 – 497 .
- Schnitzler , B.E. , Thebo , P.L. , Tomley , F.M. , Uggla , A. and Shirley , M.W. 1999 . PCR identification of chicken Eimeria: a simplified read-out . Avian Pathology , 28 : 89 – 93 .
- Shirley , M.W. 1979 . Studies on the pathogenicity of chicken-maintained (virulent) and embryo-adapted (attenuated) strains of Eimeria mivati . Avian Pathology , 8 : 469 – 475 .
- Shirley , M.W. and Bedrnik , P. 1997 . Live attenuated vaccines against avian coccidiosis: success with precocious and egg-adapted lines of Eimeria . Parasitology Today , 13 : 481 – 484 .
- Shirley , M.W. , in: Eckert , J. , Braun , R. , Shirley , M.W. , & Coudert , P. ( Eds. ), 1995 . Guidelines on techniques in coccidiosis research, office for official publications of the European Communities, Luxembourg , pp. 103 – 166 .
- Shirley , M.W. , Ivens , A. , Gruber , A. , Madeira , A.M. , Wan , K.L. , Dear , P.H. and Tomley , F.M. 2004 . The Eimeria genome projects: a sequence of events . Trends in Parasitology , 20 : 199 – 201 .
- Shirley , M.W. , Smith , A.L. and Tomley , F.M. 2005 . The biology of avian Eimeria with an emphasis on their control by vaccination . Advances in Parasitology , 60 : 285 – 330 .
- Swinkels , W.J. , Post , J. , Cornelissen , J.B. , Engel , B. , Boersma , W.J. and Rebel , J.M. 2006 . Immune responses in Eimeria acervulina infected one-day-old broilers compared to amount of Eimeria in the duodenum, measured by real-time PCR . Veterinary Parasitology , 138 : 223 – 233 .
- Swinkels , W.J. , Post , J. , Cornelissen , J.B. , Engel , B. , Boersma , W.J. and Rebel , J.M. 2007 . Immune responses to an Eimeria acervulina infection in different broilers lines . Veterinary Immunology and Immunopathology , 117 : 26 – 34 .
- Varga , A. and James , D. 2006 . Real-time RT-PCR and SYBR Green I melting curve analysis for the identification of Plum pox virus strains C, EA, and W: effect of amplicon size, melt rate, and dye translocation . Journal of Virological Methods , 132 : 146 – 153 .
- Williams , R.B. 1998 . Epidemiological aspects of the use of live anticoccidial vaccines for chickens . International Journal of Parasitology , 28 : 1089 – 1098 .
- Williams , R.B. 2002a . Anticoccidial vaccines for broiler chickens: pathways to success . Avian Pathology , 31 : 317 – 353 .
- Williams , R.B. 2002b . Fifty years of anticoccidial vaccines for poultry (1952–2002) . Avian Diseases , 46 : 775 – 802 .
- Wittwer , C.T. , Reed , G.H. , Gundry , C.N. , Vandersteen , J.G. and Pryor , R.J. 2003 . High-resolution genotyping by amplicon melting analysis using LCGreen . Clinical Chemistry , 49 : 853 – 860 .
- Woods , W.G. , Richards , G. , Whithear , K.G. , Anderson , G.R. , Jorgensen , W.K. and Gasser , R.B. 2000a . High-resolution electrophoretic procedures for the identification of five Eimeria species from chickens, and detection of population variation . Electrophoresis , 21 : 3558 – 3563 .
- Woods , W.G. , Whithear , K.G. , Richards , D.G. , Anderson , G.R. , Jorgensen , W.K. and Gasser , R.B. 2000b . Single-strand restriction fragment length polymorphism analysis of the second internal transcribed spacer (ribosomal DNA) for six species of Eimeria from chickens in Australia . International Journal of Parasitology , 30 : 1019 – 1023 .