
Abstract
Mucosal application is the most common route of vaccination to prevent outbreaks of infectious diseases like Newcastle disease virus (NDV). To gain more knowledge about distribution and uptake of a vaccine after mucosal vaccination, we studied the distribution pattern of antigens after different mucosal routes of administration. Chickens were intranasally (i.n.), intratracheally (i.t.) or intraocularly (i.o.) inoculated with fluorescent beads and presence of beads in nasal-associated lymphoid tissue (NALT), Harderian gland (HG), conjunctiva-associated lymphoid tissue (CALT), trachea, lungs, air sacs, oesophagus and blood was characterized. The distribution patterns differed significantly between the three inoculation routes. After i.t. inoculation, the beads were mainly retrieved from trachea, NALT and lung. I.n. inoculation resulted in beads found mainly in NALT but detectable in all organs sampled. Finally, after i.o. inoculation, the beads were detected in NALT, CALT, HG and trachea. The highest number of beads was retrieved after i.n. inoculation. Development of novel vaccines requires a comprehensive knowledge of the mucosal immune system in birds in order to target vaccines appropriately and to provide efficient adjuvants. The NALT is likely important for the induction of mucosal immune responses. We therefore studied the phenotype of antigen-presenting cells isolated from NALT after i.n. inoculation with uncoated beads or with NDV-coated beads. Both types of beads were efficiently taken up and low numbers of bead+ cells were detected in all organs sampled. Inoculation with NDV-coated beads resulted in a preferential uptake by NALT antigen-presenting cells as indicated by high percentages of KUL01+-, MHC II+ and CD40+ bead+ cells.
Introduction
Outbreaks of infectious disease in the poultry industry are mainly prevented by vaccination. Mucosal application is the most common route of vaccination for viral vaccines like Newcastle disease virus (NDV) and infectious bronchitis virus. Most live vaccines are applied using spray or are applied via the oculonasal route and subsequently distribute throughout the respiratory tract and head-associated lymphoid tissue, where they can be recognized and taken up by antigen-presenting cells (APC). Deposition patterns after aerosol or spray vaccination were previously studied using beads. The deposition pattern of beads is dependent on the size of the beads, droplet size of the bead solution and on the age of the chickens. Larger beads (>3.7 µm) ended up primarily in the upper respiratory tract, whereas smaller beads distributed throughout the respiratory tract (Hayter & Besch, Citation1974, Tell et al., Citation2006, Corbanie et al., Citation2006). In two-week-old broiler chickens that received 1 µm beads by aerosol, beads were detected in, for example, oesophagus, thoracic air sacs, lungs, larynx and trachea and also in nose and eyes. In one-day-old chickens, higher numbers of large beads (>1 µm) were detected in lower airways. This can be explained by the fact the young chickens were constantly cheeping (Corbanie et al., Citation2006). After deposition, an antigen is taken up by phagocytic cells present in the respiratory tract, processed and may be presented on major histocompatibility complex (MHC) molecules (de Geus et al., Citation2012a). This process is crucial for the induction of adaptive immune responses and for the maintenance of homeostasis (reviewed by Holt et al., Citation2008, Braciale et al., Citation2012). Although chickens lack draining lymph nodes, a highly developed mucosal immune system is present (Balic et al., Citation2014), with several organized mucosa-associated lymphoid tissues described in the intestinal tract, the respiratory tract and the eye region. The bronchus-associated lymphoid tissue (BALT), nasal-associated lymphoid tissue (NALT), Harderian gland (HG) and conjunctiva-associated lymphoid tissue (CALT) are thought to play important roles in induction of respiratory tract immune responses.
BALT is located at the junctions between the primary bronchus and secondary bronchi. In the chicken, BALT is constitutively present and is thought to compensate for the lack of draining lymph nodes (Fagerland & Arp, Citation1993). We have previously observed that after tracheal inoculation of lipopolysaccharide-coated beads cells that had internalized these beads were located in BALT areas (de Geus et al., Citation2012a). This suggests that induction of respiratory tract immune responses may occur locally.
The NALT is the first tissue to come into contact with inhaled particles and pathogens, including mucosal vaccines. The nasal cavity might be the most attractive route for vaccine delivery, as it is easily accessible and has lower levels of proteolytic enzymes when compared to the oral route (Islam et al., Citation2012). In avian species, both diffused and organized NALT are found (Ohshima & Hiramatsu, Citation2000, Kang et al., Citation2013, Citation2014). Both soluble and particulate antigens can be taken up in the nasal cavity and can be transported from the epithelium to the lymphoid follicles of the NALT (Kang et al., Citation2013). A major characteristic of organized NALT is the formation of circumscribed B-cell areas occasionally displaying germinal centres, covered by a CD4+ T-cell cap (Ohshima & Hiramatsu, Citation2000).
The major eye-associated lymphoid tissues are located in the HG and in the conjunctiva of the lower eyelid (CALT). Secretions of the HG drain into the upper respiratory tract, thereby providing local protection by secretory Ig (Dohms et al., Citation1981) and antigen-specific antibody-secreting cells can indeed be detected in HG after local vaccination (van Ginkel et al., Citation2008). The HG is organized in two histologically distinct compartments, a head and a body. The head of the gland resembles a secondary lymphoid organ, with follicle-associated epithelium, lymphoid accumulations and germinal centres (Jeurissen et al., Citation1994).
To gain more knowledge about distribution patterns, uptake by APC and subsequent effects on phenotype of mucosally applied vaccines, we studied the distribution of particulate, non-immunogenic beads after different routes of inoculation (intranasal (i.n.), intratracheal (i.t.) and the intra-ocular (i.o.) route in the mucosal tissues of the head region and the respiratory tract. We chose to use 1-µm beads, as it was previously shown that these beads can be recovered from the entire respiratory tract (Corbanie et al., Citation2006) and are readily ingested by phagocytic cells (de Geus et al., Citation2012a). NDV has a size of 100–500 nm (DiNapoli et al., Citation2007) and is therefore smaller than a bead. However, because airborne NDV can be found in aerosols and dust particles, an NDV-bead does resemble the size of a droplet or particle at the moment of initial deposition. We determined whether deposition and uptake patterns were affected if immunogenic beads were applied by using beads coated with NDV. Finally, we studied the phenotype of NALT APC, including macrophages and dendritic cells, after i.n. inoculation with control beads or with NDV-coated beads.
Materials and Methods
Chickens
One-day-old specified pathogen-free layer chickens were obtained from MSD Animal Health (Boxmeer, the Netherlands). Birds were housed conventionally in groups and received food and water ad libitum. In compliance with Dutch law, all of the experiments were approved by the Animal Experimental Committee of the Faculty of Veterinary Medicine, Utrecht University, The Netherlands, in accordance with the Dutch regulations on experimental birds.
Newcastle disease virus
Formalin-inactivated NDV Clone 30 was obtained from MSD Animal Health. Before being coupled, the virus was centrifuged for 30 min at 3000 × g and the supernatant was concentrated by ultracentrifugation for 1 h at 100,000 × g. The supernatant was discarded and the pellet was resuspended in phosphate-buffered saline. Protein content was determined using a bicinchoninic acid protein assay kit (Pierce, Rockford, IL, USA).
Coating of beads
Carboxylated crimson fluorescent 1 μm beads (excitation/emission maxima 625/645; Molecular Probes, Eugene, OR, USA) were coated with inactivated NDV according to manufacturers’ procedures. All steps were performed in glass tubes. NDV was dissolved at a concentration of 2.5 mg/ml in 50 mM 2-(N-Morpholino)ethanesulphonic acid buffer (pH 6; Sigma Aldrich, St Louis, MO, USA), and an equal volume of beads was added. The solution was incubated for 15 min at room temperature and 1-ethyl-3-(3-dimethylaminopropyl) carbodiimide was added at a concentration of 5 mg/ml. After the pH was adjusted to 6.5 using 1 M NaOH, the solution was incubated for 2 h at room temperature on a rocker. To quench the reaction, glycine was added to a final concentration of 100 mM and the solution was incubated for 30 min at room temperature. Coated beads were washed three times and resuspended in PBS with 1% BSA and 2 mM NaN3.
Coating of NDV to beads was confirmed using fluorescence-associated cell sort (FACS) analysis. In brief, NDV-coated beads and control beads were incubated with mouse-anti-NDV antibody (Abcam, Cambridge, UK) for 30 min on ice, followed by staining with fluorescein isothiocyanate (FITC)-labelled goat anti-mouse IgG (H+L; Southern Biotech, Birmingham, AL, USA) for 30 min on ice. Beads were analysed using a FACSCanto (BD Biosciences, San Jose, CA, USA), and data were analysed using the software program FlowJo (Tree Star, Ashland, OR, USA).
Inoculation of chickens
To first determine the distribution patterns of beads after different routes of inoculation and in a subsequent experiment determine the effect of coating with viral antigen, four-week-old chickens were inoculated i.t., i.n. or i.o. with 200 µl bead solution, containing 7.2 × 10⁹ beads. For i.t. inoculation, a flexible oral gavage needle (Instech Solomon, Plymouth Meeting, PA, USA) was used. A pipette was used for i.n. and i.o. inoculation. Chickens received either uncoated or NDV-coated beads. To determine the distribution patterns of beads after different routes of inoculation, chickens were sacrificed 1 h or 6 h after inoculation.
In a follow-up experiment to determine the phenotype of APC subsets after inoculation with the different beads, chickens were killed 1 h, 6 h and 24 h after inoculation and NALT, CALT, HG, trachea, lung, oesophagus, thoracic air sacs and blood was collected for further analysis. NALT was isolated by collecting the part of the chicken beak containing NALT tissue (Kang et al., Citation2013) and enzymatic digestion. In all experiments, each group consisted of four chickens.
Preparation of single cell suspensions
NALT, CALT and lungs were cut into small pieces and digested with 2.4 mg/ml collagenase A (Roche, Basel, Switzerland) and 1 mg/ml DNAse I (Roche) solution for 30 min at 37°C (de Geus et al., Citation2012b). Single cell suspensions of NALT, CALT, lung and HG were prepared by gently squeezing through a 70 μm cell strainer. The oesophagus was opened longitudinally, cut into ~1 cm pieces and first digested using Hank's Balanced Salt Solution/10% foetal calf serum (FCS) supplemented with 0.6 mg/ml collagenase A (Roche) and 0.1 mg/ml DNAse I (Roche). Air sacs and longitudinally opened trachea were digested with 2.5 U/ml Dispase I (Roche) for 2 h at 37°C under continuous shaking, followed by digestion with 1 mg/ml collagenase A for 5 min at 37°C (Shen et al., Citation2010).
To characterize and quantify the distribution of the beads, leucocytes were isolated from lung, blood and oesophagus by density gradient centrifugation for 20 min at 1000 × g using Ficoll-Paque (GE Healthcare, Little Chalfont, UK). Before performing these experiments, we observed that after Ficoll-Paque density separation, >95% of extracellular beads located in the interphase and also in the fluid above the interphase (not shown) and therefore both interphase and the fluid above the interphase were collected and washed twice with PBS for 30 min at 3000 × g. No density separation was performed on cells isolated from NALT, CALT, HG, trachea and air sacs. Cells and extracellular beads were resuspended in PBS supplemented with 0.5% BSA and 0.005% NaN3 (FACS buffer) and were used to measure total numbers of beads per organ.
For phenotypical analysis, leucocytes were isolated by density gradient centrifugation for 20 min at 1000 × g using Ficoll-Paque (GE Healthcare, Little Chalfont, UK) and then washed twice with PBS. Cells were resuspended in FACS buffer.
Flow cytometry
For phenotypical analyses of cells isolated from NALT, lung, HG and CALT and for analyses of in vivo uptake, cells were stained on ice using FITC-labelled mouse anti-chicken KUL01 (Southern Biotech), FITC- or phycoerythrin (PE)-labelled mouse anti-chicken MHC II (Ia; Southern Biotech) and mouse anti-chicken CD40 (AbD Serotec, Kidlington, UK). PE-labelled goat anti-mouse IgG2a (Southern Biotech) was used as secondary antibody to detect CD40 expression. Unstained samples and conjugate controls were used to correct for background and/or non-specific staining. Based on the number of cells isolated, between 0.5 × 10⁶ and 1 × 10⁶ live cells (based on forward light scatter profile) were analysed per sample. Cells were analysed using a FACSCanto (BD Biosciences, San Jose, CA, USA), and data were analysed using the software program FlowJo (Tree Star).
Analysis of data
All data were analysed using Kruskal–Wallis or Mann–Whitney U test with SPSS 20 software (IBM, Armonk, NY, USA). Graphs were prepared using Prism Graphpad 6.
Results
Deposition patterns differ between different inoculation routes
We first studied the distribution of beads in mucosal tissues after different routes of inoculation. Chickens were inoculated i.t., i.n. or i.o. with 1 µm fluorescent beads and the number of beads per organ was determined after 1 hour. We collected both extracellular and intracellular beads and determined the grand total. The highest total number of beads including all tissues was retrieved after i.t. and i.n. inoculation, whereas the lowest number of beads was retrieved after i.o. inoculation ().
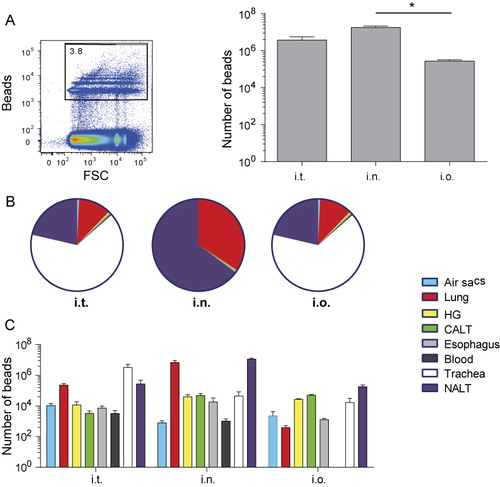
After i.t. inoculation, the highest number of beads was detected in trachea, but we found large numbers in lung and NALT tissues as well. Low numbers of beads were detected in air sacs, HG, CALT, oesophagus and blood. In chickens that were i.n. inoculated, beads were primarily retrieved from NALT and lung and low numbers of beads were retrieved from air sacs, HG, CALT, oesophagus, blood and trachea. The lowest number of beads was retrieved after i.o. inoculation and beads were primarily retrieved from HG, CALT and NALT. Low numbers were present in trachea, air sacs, lung and oesophagus. Interestingly, low numbers of beads were detected in blood of i.t. and i.n. inoculated chickens, but not in blood of i.o. inoculated chickens (, showing relative distribution of beads and , showing absolute numbers of beads).
Because the highest number of beads was consistently retrieved after i.n. inoculation and the beads were detected not only in NALT and lung but also in the eye-associated lymphoid tissues (HG and CALT), the i.n. route was used to study differences between distribution patterns of control (non-immunogenic) and immunogenic NDV-coated beads.
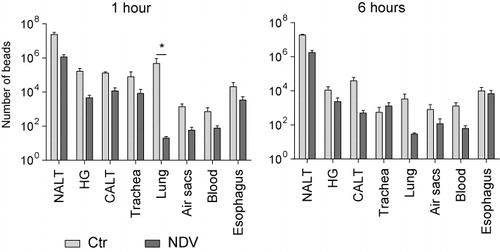
We then tested whether the distribution of immunogenic beads would differ from distribution patterns of non-immunogenic beads. To do so, beads were coated with inactivated NDV and chickens were i.n. inoculated with uncoated or NDV-coated beads. Distribution of beads, both intracellular and extracellular, was determined at 1 h post-inoculation (pi) and after 6 h pi.
At 1 h pi, a lower number of NDV-coated beads was detected as compared to uncoated beads in all organs. The biggest differences were observed in lungs. Numbers of beads did not change between 1 h pi and 6 h pi, except for a decrease in number of beads in lungs of chickens inoculated with uncoated beads (p = 0.025; .
NDV-coated beads are preferentially taken up by NALT APC
We analysed the phenotype of APC after i.n. inoculation with control beads or with NDV-coated beads. Chickens were i.n. inoculated and phenotypes of respiratory tract APC subsets were characterized at 1 h pi, 6 h pi and 24 h pi.
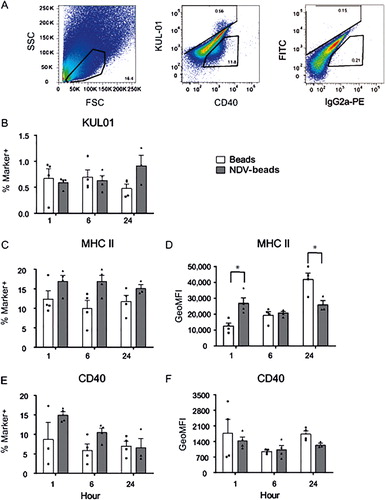
We first characterized the phenotype of the total population of NALT cells, which includes epithelial cells as well. Examples of FACS plots are shown in . Viable cells were gated based on FCS-SSC profile and this gate will contain both lymphocytes and epithelial cells. FITC (KUL01 in this example)-positive cells and PE (CD40 in this example)-positive cells (middle plot) were gated based on comparison with unstained control and conjugate control samples (right plot). As observed before in lung cells (de Geus et al., Citation2012a), the KUL01+ cells in NALT expressed CD40. Within the total population of NALT cells no significant differences in percentages of KUL01-expressing cells were detected between the uncoated bead group and the NDV-coated bead group (). Although the percentages of MHC II-expressing cells did not differ significantly between the experimental groups (), the cell surface expression of MHC II in the NDV-coated bead group differed significantly. At 1 h pi in the NDV-coated bead group the expression of MHC II was higher when compared to the control group (), whereas at 24 h pi, the cell surface expression of MHC II was significantly lower in the NDV-coated beads group when compared to the control group (). Another indication of increased activation is expression levels of CD40. But in contrast to the level of MHCII expression no differences in the percentage of CD40+ cells () nor in the expression levels per cell were detected between the treatment groups ().
We then continued to analyse the phenotype of bead+ NALT cells. Examples of FACS plots are shown in . Again gates were set by comparing plots with unstained control and conjugate control samples (right plot). Both types of bead were efficiently taken up by NALT phagocytic cells (). One hour after inoculation with control beads, within the population of bead+ cells percentages of KUL01+ cells (), MHC II+ cells () and percentages of CD40+ cells () were lower in bead+ NALT cells when compared to NDV-coated bead+ cells of chickens. These differences were less pronounced at 6 h pi and had disappeared after 24 h. At all time points after inoculation with NDV-coated beads, ~80% of bead+ cells expressed KUL01, MHC II and CD40. Cell surface expression levels of MHC II and CD40 did not differ between the two experimental groups, although at 24 h pi MHC II surface expression was increased in both groups ( and , respectively). In conclusion, at early time points (1 and 6 h pi) the uncoated beads were taken up more rapidly. Cells that took up NDV-coated beads express markers that are indicative for APC, both macrophages and dendritic cells. Although no marker for epithelial cells was included, these data suggest that the uncoated beads were likely to be taken up by epithelial cells whereas the NDV-coated beads were taken up by APC.
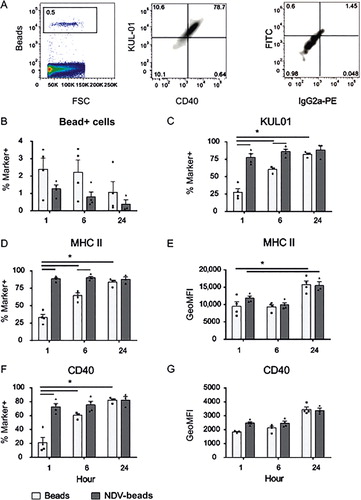
In earlier experiments, beads were detected in lung and eye-associated lymphoid tissues of i.n. inoculated chickens ( and . In line with those findings, low numbers of bead+ cells were detected both in lung and in pooled HG and CALT (data not shown). Furthermore, no differences were found in phenotype of blood mononuclear cells (data not shown).
Discussion
To study how a mucosally applied vaccine distributes over different mucosal tissues, we characterized deposition patterns of beads after different routes of inoculation. As the NALT is expected to be an important inductive site after mucosal vaccination, we characterized the phenotype of NALT APC subsets after i.n. inoculation with control beads or with NDV-coated beads as a model for a viral antigen.
Currently used vaccines against respiratory pathogens are not always protective in field situations. Possible explanations for vaccine failure include infection with heterologous viruses and inadequate storage or application of the vaccine (de Wit et al., Citation2010, Dortmans et al., Citation2012, Miller et al., Citation2013). For the development of novel vaccines, more information is needed on deposition and subsequent uptake by APC after mucosal application of a vaccine. In industry, vaccines are commonly applied using spray or aerosol or via eye drop application. We have retrieved the highest number of beads after i.t. or i.n. application and the lowest numbers after i.o. application.
In avian species, the anatomy of the nasal cavity and NALT has been described previously (Ohshima & Hiramatsu, Citation2000, Kang et al., Citation2013, Citation2014), but the phenotype of NALT resident APC subsets has not been studied. In mice and in humans, NALT is considered to play an important immune-inductive role (Zuercher et al., Citation2002, Fukuiwa et al., Citation2008, Brandtzaeg, Citation2011). In humans (Jahnsen et al., Citation2004) and in mice (Fukuiwa et al., Citation2008), DC are located strategically beneath the epithelium, where they can sample the nasal cavity. After i.n. vaccination with OVA + Flt3L, NALT DC efficiently activated OVA-specific T cells (Fukuiwa et al., Citation2008) and these DC are important for induction of mucosal IgA responses (Fukuyama et al., Citation2013). Also in the chicken, the NALT could be an important inductive site for mucosal immune responses. We observed high percentages of KUL01+, MHC II+ and CD40+ bead+ cells at early time points after i.n. inoculation with NDV-coated beads. Probably these virus-coated beads are preferentially taken up by APC subsets, although we cannot formerly distinguish DC from macrophages using these antibodies, whereas at early time points control beads are taken up most likely by epithelial cells. Possibly, the NDV-coated beads can be recognized and/or taken up via more or different pattern-recognition receptors compared to uncoated beads, resulting in a preferential uptake by APC or enhanced trans-epithelial transport. In mice it was shown that vaccine transport across follicle-associated epithelium into the lymphoid tissues was enhanced by stimulating TLR4 signalling, resulting in higher concentrations of the vaccine in NALT (Fernandez et al., Citation2011). Uptake of NDV-coated beads by NALT APC did not result in upregulation of MHC II and CD40 expression, although MHC II cell surface expression was increased at 24 h pi in both groups (. However, in the total population of NALT cells, upregulation of MHC II expression was observed 1 h after inoculation with NDV-coated beads (.
After i.n. application, beads were deposited not only in the nasal cavity, but also in the eye-associated lymphoid tissue, probably as a result of transport via the lachrymal duct. It has been described previously that the lachrymal duct is a two-way system and after nasal vaccination ocular immune responses can be detected in rabbits (Chentoufi et al., Citation2010). Beads were also detected in the lung. Therefore, we expect that APC subsets in eye-associated lymphoid tissues and lung can be activated as well after i.n. vaccination. Indeed, in our experiments beads were detected in those tissues and also low percentages of bead+ cells were present, although the numbers of bead+ cells were not sufficient to determine the phenotypes of these cells. Interestingly, after i.n. application of both control beads and NDV-coated beads we found low numbers of bead+ cells back in blood. This was not observed after i.t. inoculation (de Geus et al., Citation2012a). One could speculate that systemic responses could be induced at early time points after i.n. vaccination, but less so after i.o. vaccination. It does not seem likely that beads end up in blood as a result of damage caused by the i.n. inoculation procedure as a droplet is pipetted onto the nostril and not directly into the nasal cavity. More likely, beads can be transferred across the epithelial layer and directly enter the circulation because the nasal mucosal layer is thin and well vascularized.
In summary, to study the distribution of a vaccine after mucosal application we have characterized how antigen that is applied via different routes in the head region is distributed over the local mucosal tissues by measuring the distribution of beads after different routes of application. The highest number of beads was retrieved after i.n. inoculation and using this route high numbers of beads were found in NALT, lung and eye-associated lymphoid tissues. Both control and NDV-coated beads were efficiently taken up by NALT cells and low numbers of bead+ cells were detected in lung, in eye-associated lymphoid tissue and in blood. NDV-coated beads were preferentially taken up by APC based on the detection of increased percentages of KUL01+, MHC II+ and CD40+ cells, whereas control beads may have been taken up more often by epithelial cells.
Although high numbers of beads were detected after i.n. vaccination, high numbers were lost as well. The NDV-coated beads were efficiently taken up by APC, but uptake of these beads did not result in strong activation of the APC. Therefore, adjuvants will often be needed for inactivated mucosal vaccines.
Acknowledgements
We thank Dr Christine Jansen for technical assistance and Prof. Willem van Eden for critically reading the manuscript.
Additional information
Funding
References
- Balic, A., Garcia-Morales, C., Vervelde, L., Gilhooley, H., Sherman, A., Garceau, V., Gutowska, M.W., Burt, D.W., Kaiser, P., Hume, D.A. & Sang, H.M. (2014). Visualisation of chicken macrophages using transgenic reporter genes: insights into the development of the avian macrophage lineage. Development, 141, 3255–3265.
- Braciale, T.J., Sun, J. & Kim, T.S. (2012). Regulating the adaptive immune response to respiratory virus infection. Nature Reviews Immunology, 12, 295–305.
- Brandtzaeg, P. (2011). Potential of nasopharynx-associated lymphoid tissue for vaccine responses in the airways. American Journal of Respiratory and Critical Care Medicine, 183, 1595–1604.
- Chentoufi, A.A., Dasgupta, G., Nesburn, A.B., Bettahi, I., Binder, N.R., Choudhury, Z.S., Chamberlain, W.D., Wechsler, S.L. & BenMohamed, L. (2010). Nasolacrimal duct closure modulates ocular mucosal and systemic CD4+ T cell responses induced following topical ocular or intranasal immunization. Clinical and Vaccine immunology, 17, 342–353.
- Corbanie, E.A., Matthijs, M.G., van Eck, J.H., Remon, J.P., Landman, W.J. & Vervaet, C. (2006). Deposition of differently sized airborne microspheres in the respiratory tract of chickens. Avian Pathology, 35, 475–485.
- DiNapoli, J.M., Yang, L., Suguitan, A. Jr., Elankumaran, S., Dorward, D.W., Murphy, B.R., Samal, S.K., Collins, P.L. & Bukreyev, A. (2007). Immunization of primates with a Newcastle disease virus-vectored vaccine via the respiratory tract induces a high titer of serum neutralizing antibodies against highly pathogenic avian influenza virus. Journal of Virology, 81, 11560–11568.
- Dohms, J.E., Lee, K.P. & Rosenberger, J.K. (1981). Plasma cell changes in the gland of Harder following infectious bursal disease virus infection of the chicken. Avian Diseases, 25, 683–695.
- Dortmans, J.C., Peeters, B.P. & Koch, G. (2012). Newcastle disease virus outbreaks: vaccine mismatch or inadequate application? Veterinary Microbiology, 160, 17–22.
- Fagerland, J.A. & Arp, L.H. (1993). Distribution and quantitation of plasma cells, T lymphocyte subsets, and B lymphocytes in bronchus-associated lymphoid tissue of chickens: age-related differences. Regional Immunology, 5, 28–36.
- Fernandez, S., Cisney, E.D., Hall, S.I. & Ulrich, R.G. (2011). Nasal immunity to staphylococcal toxic shock is controlled by the nasopharynx-associated lymphoid tissue. Clinical and Vaccine Immunology, 18, 667–675.
- Fukuiwa, T., Sekine, S., Kobayashi, R., Suzuki, H., Kataoka, K., Gilbert, R.S., Kurono, Y., Boyaka, P.N., Krieg, A.M., McGhee, J.R. & Fujihashi, K. (2008). A combination of Flt3 ligand cDNA and CpG ODN as nasal adjuvant elicits NALT dendritic cells for prolonged mucosal immunity. Vaccine, 26, 4849–4859.
- Fukuyama, Y., Tokuhara, D., Sekine, S., Aso, K., Kataoka, K., Davydova, J., Yamamoto, M., Gilbert, R.S., Tokuhara, Y., Fujihashi, K., Kunisawa, J., Yuki, Y., Kiyono, H., McGhee, J.R. & Fujihashi, K. (2013). Potential roles of CCR5(+) CCR6(+) dendritic cells induced by nasal ovalbumin plus Flt3 ligand expressing adenovirus for mucosal IgA responses. PLoS One, 8, e60453.
- de Geus, E.D., Jansen, C.A. & Vervelde, L. (2012a). Uptake of particulate antigens in a nonmammalian lung: phenotypic and functional characterization of avian respiratory phagocytes using bacterial or viral antigens. Journal of Immunology, 188, 4516–4526.
- de Geus, E.D., Rebel, J.M. & Vervelde, L. (2012b). Kinetics of the avian influenza-specific humoral responses in lung are indicative of local antibody production. Developmental and Comparative Immunology, 36, 317–322.
- Hayter, R.B. & Besch, E.L. (1974). Airborne-particle deposition in the respiratory tract of chickens. Poultry Science, 53, 1507–1511.
- Holt, P.G., Strickland, D.H., Wikstrom, M.E. & Jahnsen, F.L. (2008). Regulation of immunological homeostasis in the respiratory tract. Nature Reviews Immunology, 8, 142–152.
- Islam, M.A., Firdous, J., Choi, Y.J., Yun, C.H. & Cho, C.S. (2012). Design and application of chitosan microspheres as oral and nasal vaccine carriers: an updated review. International Journal of Nanomedicine, 7, 6077–6093.
- Jahnsen, F.L., Gran, E., Haye, R. & Brandtzaeg, P. (2004). Human nasal mucosa contains antigen-presenting cells of strikingly different functional phenotypes. American Journal of Respiratory Cell and Molecular Biology, 30, 31–37.
- Jeurissen, S.H.M., Vervelde, L. & Janse, E.M. (1994). Structure and function of lymphoid tissues of the chicken. Poultry Science Reviews, 5, 183–207.
- Kang, H., Yan, M., Yu, Q. & Yang, Q. (2013). Characteristics of nasal-associated lymphoid tissue (NALT) and nasal absorption capacity in chicken. PLoS One, 8, e84097.
- Kang, H., Yan, M., Yu, Q. & Yang, Q. (2014). Characterization of nasal cavity-associated lymphoid tissue in ducks. Anatomical Record (Hoboken), 297, 916–924.
- Miller, P.J., Afonso, C.L., El Attrache, J., Dorsey, K.M., Courtney, S.C., Guo, Z. & Kapczynski, D.R. (2013). Effects of Newcastle disease virus vaccine antibodies on the shedding and transmission of challenge viruses. Developmental and Comparative Immunology, 41, 505–513.
- Ohshima, K. & Hiramatsu, K. (2000). Distribution of T-cell subsets and immunoglobulin-containing cells in nasal-associated lymphoid tissue (NALT) of chickens. Histology and Histopathology, 15, 713–720.
- Shen, C.I., Wang, C.H., Liao, J.W., Hsu, T.W., Kuo, S.M. & Su, H.L. (2010). The infection of primary avian tracheal epithelial cells with infectious bronchitis virus. Veterinary Research, 41, 6–16.
- Tell, L.A., Smiley-Jewell, S., Hinds, D., Stephens, K.E., Teague, S.V., Plopper, C.G. & Pinkerton, K.E. (2006). An aerosolized fluorescent microsphere technique for evaluating particle deposition in the avian respiratory tract. Avian Diseases, 50, 238–244.
- Van Ginkel, F.W., Toro, H., Tang, D.C. & Gulley, S.L. (2008). Induction of mucosal immunity in the avian Harderian gland with a replication-deficient Ad5 vector expressing avian influenza H5 hemagglutinin. Developmental and Comparative Immunology, 33, 28–34.
- de Wit, J.J., Swart, W.A. & Fabri, T.H. (2010). Efficacy of infectious bronchitis virus vaccinations in the field: association between the alpha-IBV IgM response, protection and vaccine application parameters. Avian Pathology, 39, 123–131.
- Zuercher, A.W., Coffin, S.E., Thurnheer, M.C., Fundova, P. & Cebra, J.J. (2002). Nasal-associated lymphoid tissue is a mucosal inductive site for virus-specific humoral and cellular immune responses. Journal of Immunology, 168, 1796–1803.