
Abstract
Avian metapneumovirus (aMPV) is a pathogen with worldwide distribution, which can cause high economic losses in infected poultry. aMPV mainly causes infection of the upper respiratory tract in both chickens and turkeys, although turkeys seem to be more susceptible. Little is known about virus–host interactions at epithelial surfaces after aMPV infection. Tracheal organ cultures (TOC) are a suitable model to investigate virus–host interaction in the respiratory epithelium. Therefore, we investigated virus replication rates and lesion development in chicken and turkey TOC after infection with a virulent aMPV subtype A strain. Aspects of the innate immune response, such as interferon-α and inducible nitric oxide synthase mRNA expression, as well as virus-induced apoptosis were determined. The aMPV-replication rate was higher in turkey (TTOC) compared to chicken TOC (CTOC) (P < 0.05), providing circumstantial evidence that indeed turkeys may be more susceptible. The interferon-α response was down-regulated from 2 to 144 hours post infection in both species compared to virus-free controls (P < 0.05); this was more significant for CTOC than TTOC. Inducible nitric oxide synthase expression was significantly up-regulated in aMPV-A-infected TTOC and CTOC compared to virus-free controls (P < 0.05). However, the results suggest that NO may play a different role in aMPV pathogenesis between turkeys and chickens as indicated by differences in apoptosis rate and lesion development between species. Overall, our study reveals differences in innate immune response regulation and therefore may explain differences in aMPV – A replication rates between infected TTOC and CTOC, which subsequently lead to more severe clinical signs and a higher rate of secondary infections in turkeys.
Introduction
Avian metapneumovirus (aMPV) is a widely distributed pathogen in poultry as well as in some other avian species, including wild birds (Jones, Citation1996). It may cause respiratory diseases and subsequently lead to high economic losses to the poultry industry (Roussan et al., Citation2008; Catelli et al., Citation2010). aMPV belongs to the family Paramyxoviridae, subfamily Pneumovirinae. In turkeys, it causes turkey rhinotracheitis and it is involved in a disease called swollen head syndrome in chickens. In young turkeys, signs such as ocular and nasal discharge, sneezing, coughing and swelling of the infraorbital sinuses may be observed (Jirjis et al., Citation2004; Sugiyama et al., Citation2006). The respiratory signs in aMPV-mono-infected chickens are normally less clear and milder than in turkeys (Lu et al., Citation1994; Banet-Noach et al., Citation2005). In chickens additional clinical signs including disorientation, torticollis and opisthotonus are seen (Cook, Citation2000). Furthermore, in breeders of both species, a drop in egg production and changes in egg quality can be found (Cook, Citation2000). aMPV infections in chickens and turkeys are frequently exacerbated by bacterial pathogens such as Escherichia coli, Bordetella avium and Mycoplasma gallisepticum (Naylor et al., Citation1992; Jirjis et al., Citation2004) or respiratory viruses, including infectious bronchitis virus and Newcastle disease virus (Cook, Citation2000; Jirjis et al., Citation2004; Villarreal et al., Citation2007).
Experimental infection of chickens and turkeys with virulent aMPV subtypes A and B leads to thickening of the tracheal mucosa. This morphological change is due to congestion, oedema and mononuclear cell infiltration in the lamina propria of the trachea and is seen between three and seven days post infection. Furthermore, flattening of the epithelial cells and focal deciliation are apparent. In turkeys, an active regenerative process of the epithelia can be observed between 10 and 14 days post infection (Catelli et al., Citation1998). Similar findings were published for other pneumoviruses such as the human metapneumovirus (hMPV) and the respiratory syncytial virus (RSV), which show a clear tropism for epithelial cells. Infection with these viruses is manifested by a loss of nasal and lung epithelial cells, as has been shown in cotton rats (Williams et al., Citation2005). Similarly, RSV infection of explanted human bronchial cells reduced the ciliary beat frequency (Domachowske et al., Citation2001). RSV-infected cells became resistant to tumour necrosis factor-α-induced apoptosis followed by giant-cell syncytia formation and finally underwent necrosis. Nevertheless, the molecular basis of ciliostasis remains completely unknown for RSV. hMPV, as the closest relative to aMPV subtype C, is also known to infect ciliated respiratory epithelial cells and is associated with superficial erosive and inflammatory changes in the mucosa and submucosa of the airways, including loss of ciliation, oedema, transmigration of neutrophils and increased numbers of macrophages in the alveoli (Kuiken et al., Citation2004). Innate immune responses such as the IFN I response and the activation of NF-κB and interferon regulatory factor 3, two transcription factors necessary for the synthesis of inflammatory and antiviral cytokines, are inhibited during RSV and hMPV infection, but the IFN II (IFN-γ) response is not (Garcia-Sastre, Citation2001; Horvath, Citation2004; Ramaswamy et al., Citation2004; Bao et al., Citation2007, Citation2008; Kolli et al., Citation2012; Leyrat et al., Citation2014). Αlpha (α) and beta (β) IFNs are cytokines, which play an important role in the antiviral immune response to aMPV in the turkey (Munir & Kapur, Citation2003). IFN induces a number of cellular genes, which suppress further virus replication, regulate adaptive immune responses and interfere with cell proliferation (Suresh et al., Citation1995).
In birds, little is known about virus–host interaction after aMPV infection and possible differences between avian species. The use of tracheal organ cultures (TOC) represents a good model for investigating virus–host interaction between the different species (Cook et al., Citation1976; Darbyshire et al., Citation1979; Jones, Citation1996).
The goal of our study was to identify possible differences between chickens and turkeys in innate immune responses, which may modify the pathogenesis and the outcome of the aMPV infection. Therefore, we investigated viral replication, the induction of ciliostasis and lesion development in TOC of both species after inoculation with aMPV subtype A. Selected aspects of the innate immune response, including the apoptosis rate and IFN-α and inducible nitric oxide synthase (iNOS) mRNA expression, were examined.
Materials and Methods
Tracheal organ cultures
The TOC were prepared from 20-day-old specific pathogen free chicken embryos (Lohmann, Cuxhaven, Germany) and 26-day-old turkey embryos (Moorgut Kartzfehn, Bösel, Germany) as previously described (Winter et al., Citation2008). Briefly, the tracheae were dissected and cleaned from connective tissue and attached muscles and cut with a sterile microtome blade into rings of approximately 1 mm thickness. Each ring was cultured separately in a 5-ml tube, containing 750 µl pre-warmed 199 Hanks medium (Sigma-Aldrich, Taufkirchen, Germany) including 1% penicillin/streptomycin (10,000 U/ml, 10,000 mg/ml, Biochrom, Berlin, Germany) and 1% l-Glutamine (200 mM, Biochrom). The tubes were placed in a rotating rack and turned overhead at 37°C at the lowest rotation speed. The infection was performed at day 4 post preparation, using rings showing 100% ciliary activity. Every ring was divided virtually into 10 parts to estimate the percentage of activity in 5% steps.
Experimental design
On the day of infection, tracheal rings of both species showing 100% ciliary activity were randomly assigned to non-infected or infected groups (n = 5/group and timepoint to be investigated). Before infection, the rings were washed with phosphate buffered saline (PBS) containing calcium and magnesium (PBS +/+, Biochrom). Rings of the virus-free control group were incubated with 100 µl of 0.2% BSA/PBS (bovine serum albumin in PBS, Carl Roth, Karlsruhe, Germany). TOC of the aMPV-infected group received the same amount of medium with aMPV (100 median ciliostatic doses [CD50]/ring). Both groups were incubated for 1 h at 37°C. Subsequently, 900 µl of 199 Hanks Medium, prepared as described above, containing 0.2% BSA was added to each tube without aspiration of the inoculum. Ciliary activity was monitored daily throughout each experiment. Five rings per group were collected at 24, 48, 72, 96, 120, 144, 168, 192, 216 and 240 hours post infection (hpi), if not stated differently, and investigated for the following parameters: lesion development by histology, viral replication by immunohistochemical staining for aMPV antigen and the induction of apoptosis by the TUNEL assay at 12 hpi and indicated timepoints. Furthermore, the induction of IFN-α as well as iNOS mRNA expression by qRT-PCR was investigated at 1, 2, 4, 8, 12, 24, 36, 48, 72, 96, 120, 144, 168, 192 and 240 hpi. Supernatants were harvested for the detection of bioactive IFN at 8, 12, 24, 36, 48, 72, 96, 168 and 192 hpi. For each species the experiment was performed three times.
Virus and infection
The aMPV subtype A strain BUT 8544, which had been isolated from turkeys, was kindly provided by Dr R. C. Jones, Liverpool University, UK, and subsequently propagated and titrated in chicken TOC (Cook et al., Citation1976). Individual rings were infected with a 102 CD50/ring in each of the experimental studies.
For the IFN protection assay, the vesicular stomatitis virus (kindly provided by Gert Zimmer, Institute for Virology, University of Veterinary Medicine, Hannover, Germany) was used. It had been propagated and titrated in chicken embryo fibroblasts (CEF).
Histology
Five replicate rings, collected at each timepoint and treatment, were placed together in one histology cassette, fixed in 4% paraformaldehyde and finally embedded in paraffin. Subsequently, rings were cut into 2 µm serial sections and stained with haematoxylin and eosin for histological examination following standard procedures. The sections were examined at 400-fold magnification for the presence of histopathological lesions such as degeneration, necrosis, apoptotic bodies, oedema, loss of cilia, hyperplasia and flattening of the epithelial cells.
Immunohistochemistry
Serial sections were also processed for immunohistochemical detection of viral antigen and apoptosis. Briefly, paraffin was removed by xylol treatment and descending alcohol concentrations and sections were then rehydrated. Endogenous peroxidase was blocked by H2O2 (3% in methanol) treatment and the cells were permeabilised with 0.2% Triton X-100 in PBS (Sigma-Aldrich, Steinheim, Germany).
For aMPV antigen staining, slides were washed with PBS and first treated with a polyclonal chicken aMPV-A-antiserum, which had been raised in aMPV-A vaccinated chickens in our clinic, at a 1:300 dilution in 3% BSA/PBS. The slides were incubated at 37°C in a humid chamber for 1 h. Subsequently, they were washed with PBS and incubated with a goat-anti-chicken IgG-HRP-labelled antibody at a 1:400 dilution (KPL, Gaithersburg, MD, USA) in a humid chamber.
For the TUNEL assay, 50 µl of the staining solution, containing the enzyme terminal deoxynucleotidyl transferase from calf thymus (EC 2.7.7.31, recombinant in E. coli, in situ cell death detection kit®, Roche Applied Science, Mannheim, Germany) and nucleotide mixture in reaction buffer, was added to each deparaffinised, blocked and permeabilised section and incubated in a humid chamber for 1 h. Slides were then washed with PBS according to the manufacturer's instructions for the in situ cell death detection kit® (Roche Applied Science). A further blocking step of 20 min with 3% BSA (PAA Laboratories, Pasching, Austria) in PBS was included before 50 µl of the converter – peroxidase (anti-fluorescein antibody, Fab fragment from sheep, conjugated with horse-radish peroxidase, ready-to-use, Roche Applied Science) was added to each section and incubated in a humid chamber for 45 min.
The slides of both staining procedures were covered with 500 µl DAB (3,3′-diaminobenzidin; Vector Laboratories, Inc., Burlingame, CA, USA) for 30 s and the reaction was finally stopped with PBS. Slides were counterstained with haemalaun for one minute and mounted with Aquatex® (Merck, Darmstadt, Germany). Antigen-positive and apoptotic cells showed brown staining. Positive cells were counted at 400-fold magnification in three microscopic fields per ring. The average of positive cells of five organ rings per timepoint and treatment was calculated.
Real-time qRT-PCR
Each TOC was placed in 500 µl of TriFast® GOLD reagent (PeqLab, Biotechnologie GmbH, Erlangen, Germany) and RNA was isolated according to the manufacturer's instructions. Real-time quantitative RT-PCR was performed using the Ambion AgPath-ID One-Step RT-PCR kit (Life Technologies, Carlsbad, CA, USA) for detection of chicken and turkey IFN-α and iNOS mRNA expression levels.
Primers and probes for chicken and turkey IFN-α were used as previously described (Petersen et al., Citation2013). For detection of iNOS mRNA expression, the following primers and probes were used: chicken: forward primer 5′-CAA CAG GAA CCT ACC ATC TGA C-3′, reverse primer 5′-GAC CAC TGG ATT CTC CCA ATA C-3′, probe 5′-(FAM)-ACT GAT CTT TGC TGC CAA ACA GGC-(TAMRA)-3′ (Genbank accession number NM_204961) and turkey: forward primer 5′-CTC TCC CAG GCT TTG ACA TAT T-3′, reverse primer 5′-GTT TGT CTC CTT CCG CTG TTA-3′, probe 5′-(FAM)-TCA CTA CTC CAC CCT CCC AAC AAT-(TAMRA)-3′ (Genbank accession number NM_001303213). For amplification and visualization of the specific PCR products, the Mx3005 PTM thermal cycle system and Mx3005 PTM Q PCR Software (STRATAGENE; Agilent Technologies Company) were used. The following cycle profile was applied: one cycle at 45°C for 10 min, one cycle at 95°C for 10 min, and 40 cycles at 95°C for 15 s and 57°C for 45 s. The results are displayed in threshold cycle values (Ct). Ct values were normalized based on the detection of 28S rRNA expression levels (Powell et al., Citation2009). The data are presented as fold change in mRNA expression levels in relation to ΔCt values from aMPV-free control groups (Pfaffl, Citation2001).
IFN protection assay
Supernatants of aMPV-infected chicken TOC (CTOC) and TTOC were tested for biologically active IFN. Before conducting the IFN protection assay, aMPV had to be inactivated. The TOC supernatants were dialyzed in glycine buffer (100 mM, pH 2) and subsequently neutralized with PBS. The supernatants were transferred into 2 ml tubes (Sarstedt, Nümbrecht, Germany) covered with a dialysis membrane (Visking Size 2 Dia 18/32′ – 4.3 mm, Medicell, London, UK). The tubes were placed upside down in the glycine buffer for 3 h and were subsequently retransferred for 12 h into a freshly prepared glycine buffer at 4°C. Finally, supernatants were neutralized with PBS (pH 7.4) for 3 h and placed again in fresh PBS for an additional 1 h at 4°C (Petersen et al., Citation2013).
For the IFN bioassay, CEF were seeded in 96-well cell culture plates. The following day, 2-fold serially diluted supernatants were transferred to CEF and incubated at 37.5°C and 5% CO2. A biologically active recombinant IFN-α (kindly provided by Bernd Kaspers, LMU, Muenchen, Germany) as a positive control and a negative medium control were included. After 24 h, supernatants were replaced with medium containing vesicular stomatitis virus (4 × 10⁴ TCID50/well) and incubated for 48 h. The CEF were evaluated for possible cytopathic effects with an inverted microscope. The antiviral IFN activity of the TOC supernatants is expressed in units/ml (U/ml). One unit is defined as the highest dilution of the sample that caused 100% protection against vesicular stomatitis virus-induced cytopathic effect (Karaca et al., Citation1996)
Statistical analysis
Testing for normality was performed using the Shapiro–Wilk test (P > 0.05). If the data showed approximately normal distribution, the values were statistically analysed using the t-Test. For non normal distributed data, the Wilcoxon Rank Sum Test was used. The difference between infected and control groups was considered significant at P < 0.05. All statistical analyses were carried out using Statistix® 9.0 (Analytical software, Tallahassee, FL, USA).
Results
Ciliary activity
After aMPV infection, the ciliary activity was monitored daily during the experiments. No reduction in ciliary activity was observed within 48 hpi in either aMPV-infected or non-infected groups of either species. A significant decrease was observed starting at 96 hpi in TTOC and at 168 hpi in CTOC compared to the virus-free controls (P < 0.05, (a) and (b)). Comparing the loss of ciliary activity between CTOC and TTOC, no significant differences were detectable in timing and intensity (P < 0.05, data not shown). At 216 hpi less than 15% and 5% ciliary activity remained in chicken and turkey TOC, respectively. At 240 hpi, TTOC showed only 1% and CTOC 5% of ciliary activity compared to virus-free controls ((a) and (b)).
Figure 1. Ciliary activity after aMPV infection. Mean ciliary activity of aMPV-infected (a) chicken (n = 5–35) and (b) turkey (n = 5–40) TOC compared to virus-free controls at indicated times. hpi = hours post infection. Error bars indicate standard deviation. All virus-free control TOC remained at 100% ciliary activity throughout. Asterisks indicate significant differences between controls and infected TOC per timepoint (P < 0.05 student's t-test). Experiments 2 and 3 as representative experiments for chicken and turkey TOC, respectively.
aMPV-induced lesion development
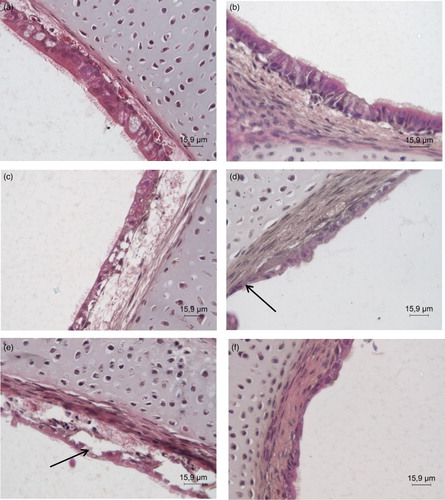
The histological examination of the aMPV-free controls revealed an intact structure and columnar cell morphology of the epithelium. The cilia covering the lumen of the control TOC were intact up to 144 hpi in both species, the last time histological examination was performed. In aMPV-infected TTOC, the epithelial cells started to degenerate and the density of cells decreased at 48 hpi, whereas the epithelium in aMPV-infected CTOC was still cylindrical (data not shown). At 96 hpi, the epithelial cells of the TTOC were partially detached from the lamina propria with focal cell and cilia loss ((d)). Desquamation and perforation of the epithelial layer were seen in CTOC at 96 hpi ((c)). The epithelium of infected TOC of either species was partially or fully detached from the lamina propria and showed further loss of cilia at 120 hpi ((e) and (f)). In TTOC 50% of the epithelial cells were lost and the lamina propria appeared thicker at 144 hpi; the remaining epithelium was degenerated. A thicker lamina propria was also observed in aMPV-infected CTOC compared to virus-free controls. The epithelial cells were degenerated and several apoptotic bodies were detected in the epithelial cells and in the cells of the lamina propria at 144 hpi (data not shown). Due to destruction of most of the epithelial layer of the infected TOC, sections were not evaluated histologically beyond 144 hpi.
Figure 2. H&E staining of histological sections. Histological staining with haematoxylin and eosin of (a)+(c)+(e) chicken and (b)+(d)+(f) turkey TOC at (a)+(b) 24 hpi, (c)+(d) 96 hpi. (e)+(f) 120 hpi. hpi = hours post infection. The pictures are representative for all three trials. Arrows: degenerated, disrupted epithelium with loss of cilia, and partially detached epithelial cell layer.
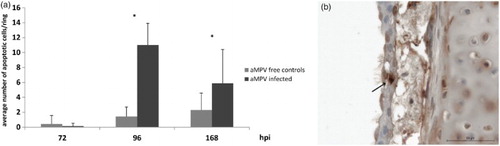
The number of apoptotic cells in aMPV-infected CTOC increased significantly compared to the virus-free control TOC (P < 0.05) (), starting at 96 hpi; this was not observed in TTOC (data not shown).
Figure 3. Average number of apoptotic cells per tracheal organ culture after aMPV infection. (a) Mean number of apoptotic cells in aMPV-infected chicken TOC (Experiment 2 as a representative experiment). n = 5/timepoint/group. hpi = hours post infection. Error bars indicate standard deviation. Asterisks indicate significant differences between controls and infected TOC per timepoint (P < 0.05 student's t-Test). (b) Detection of apoptotic cells (TUNEL assay), arrow indicates an example of an apoptotic epithelial cell of an aMPV-infected chicken TOC.
aMPV replication in CTOC and TTOC
No virus antigen was detected in virus-free control TOC of either species at any time ((a) and (b)). Significant differences in numbers of aMPV-positive cells/ring between CTOC and TTOC were detected at 24 and 48 hpi (P < 0.05). At 72, 96 and 120 hpi, the number of virus-positive cells was almost equal for both species (). Infected TTOC already showed aMPV antigen-positive cells at 24 hpi. In CTOC the first aMPV-stained cells were detected at 48 hpi. In the early phase after infection, virus antigen was located at the ciliary border (). At 48 hpi in TTOC and 72 hpi in CTOC epithelial cells were positively stained for aMPV (data not shown). The highest number of aMPV-positive cells was observed at 48 hpi and at 96 hpi in TTOC and CTOC, respectively ((d) and (e)). After 168 hpi almost complete loss (> 50%) of the epithelial layer was observed. At later time points, only a few aMPV-positive cells were detectable in the remaining epithelium, the surface of the lamina propria mucosae and basement membrane (data not shown).
Figure 4. Immunohistochemical staining of aMPV antigen in the epithelial layer of TOC. DAB staining for aMPV-positive epithelial cells in TOC of (a)+(c)+(e) chicken and (b)+(d)+(f) turkey at (a)+(b) 24 hpi (virus-free controls), (c)+(d) 48 hpi (e)+(f) 96 hpi. hpi = hours post infection. Brown staining indicates aMPV-positive cells. The sections are representative for all trials.
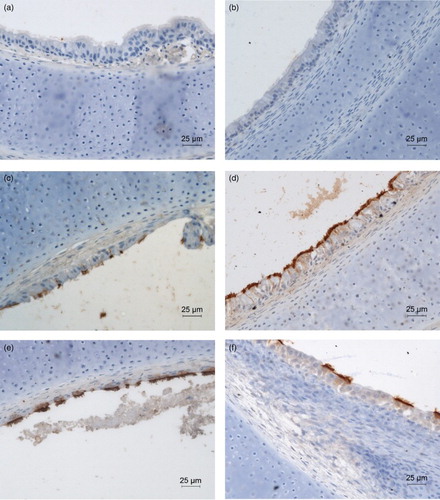
Figure 5. Average number of aMPV-positive cells in the epithelial layer of TOC. Mean number of aMPV-antigen-positive cells in aMPV-infected chicken (Experiment 2) and turkey (Experiment 3) TOC. Three microscopic fields were counted per organ culture and the mean of five cultures was calculated. Error bars indicate standard deviation. Graphs are representative for all three trials. Asterisks indicate significant differences between aMPV-infected chicken and turkey TOC per timepoint (P < 0.05 student's t-Test).
Induction of IFN and iNOS mRNA expression
There was a significant down-regulation of IFN-α mRNA expression between 2 and 144 hpi in aMPV-infected CTOC compared to the virus-free controls (P < 0.05). In aMPV-infected TTOC, a significant down-regulation was only observed at 12 and 96 hpi compared to virus-free controls (P < 0.05). At 192 hpi IFN-α expression was comparable between infected and non-infected TTOC. A non-significant up-regulation was observed at 192 hpi in CTOC ().
Figure 6. IFN-α mRNA expression after aMPV infection. In (a) chicken (Experiment 2) and (b) turkey (Experiment 3) TOC. Results are shown as fold change in comparison to the virus-free controls. n = 5/timepoint. Error bars indicate standard deviation. Asterisks indicate significant differences between virus-free controls and infected TOC per timepoint (P < 0.05 student's t-Test). The experiments shown are representative for all experiments.
No biologically active IFN was detected at the times tested in the IFN protection assay, confirming the results of the IFN mRNA expression detected by real-time qRT-PCR (data not shown).
In CTOC a steady increase in iNOS mRNA expression was determined. A significant up-regulation was detectable at 48, 96 and 120 hpi, with a 1.9–2.5- and 3-fold increase, respectively, compared to the aMPV-free control TOC. A significant increase in the induction of iNOS mRNA expression was seen in TTOC at 2 and 48 hpi compared to the aMPV-free controls (P < .05). At 2 hpi a 2.3-fold and at 48 hpi a 10.5-fold increase was measured ().
Figure 7. iNOS mRNA expression after aMPV infection. In (a) chicken (Experiment 2) and (b) turkey (Experiment 3) TOC compared to the virus-free controls. Results are shown as fold change in comparison to the virus-free controls. n = 5. Error bars indicate standard deviation. Asterisks indicate significant differences between controls and infected TOC per timepoint (P < 0.05 student's t-Test).
Discussion
The aim of this study was to investigate the interaction of a virulent aMPV subtype A strain with the respiratory epithelium of turkey and chicken tracheal organ explants of embryonic origin. TOC are considered as a valid model for the investigation of innate immune response parameters as well as viral replication, and furthermore allow comparison between tissue of turkey and chicken origin (Sekellick et al., Citation1990; Karpala et al., Citation2012).
After aMPV-A infection, ciliary activity was significantly affected in both species (P < 0.05), while the virus-free TOC remained almost 100% viable during the experimental period of up to 10 days. Also, other Pneumovirinae such as RSV induced ciliostasis after ex vivo infection of human bronchial epithelial cell explants. Interestingly, RSV already induced ciliostasis at 6 hpi, while aMPV-infected TOC showed the beginning of ciliostasis at the earliest between 48 and 96 hpi (Tristram et al., Citation1998). However, the RSV studies were conducted with a higher dose of 5 × 10⁵ plaque forming units for inoculation compared to 100 CD50 for aMPV.
We may speculate that aMPV is a relatively slowly replicating virus, which is also known to be the case for hMPV (Biacchesi et al., Citation2004; van den Hoogen et al., Citation2001; Reemers et al., Citation2009) compared to RSV and avian influenza virus. However, the duration of the aMPV-replication cycle is not known. A comparative study performed with Chlamydia psittaci and aMPV showed that this bacterium has a replication cycle of 50 h; less than 50 h was assumed for aMPV (Loock et al., Citation2006).
The decrease in ciliary activity started after 48 and 96 hpi in turkey and chicken TOC, respectively. Our in vitro observations confirm in vivo studies which suggested a higher susceptibility of turkeys for aMPV infection (Cook, Citation2000). Reports show that aMPV subtype A replicates to higher titre in turkeys than in chickens (Van de Zande et al., Citation1999) and an experimental infection with aMPV subtype B caused more severe clinical signs in broilers than a subtype A aMPV (Aung et al., Citation2008). It can be speculated that TTOC may be more susceptible and therefore more suitable for primary isolation of aMPV-A than CTOC.
This difference in in vivo and in vitro susceptibility could be also related to the host origin of the virus isolate. A turkey isolate was reported to be more virulent for turkeys than for chickens (Buys et al., Citation1989; Cook et al., Citation1993). The delay of two days in the induction of ciliostasis in CTOC compared to TTOC may therefore be influenced by species-specific glycosylation of the viral proteins, which may influence the biology of the virus. This has already been described for other viruses including influenza virus, hendra virus, SARS-CoV, hepatitis and West Nile virus (Suarez et al., Citation1998; Vigerust & Shepherd, Citation2007). The isolate used in this study is of turkey origin and had been passaged and propagated in CTOC. Other studies have demonstrated that turkey isolates are able to infect chickens in vitro and in vivo (Shin et al., Citation2000; Aung et al., Citation2008). Therefore, the influence of the glycosylation pattern on the susceptibility of birds for aMPV has to be investigated further.
The aMPV antigen was found in ciliated epithelial cells, therefore infection leads to destruction and loss of the epithelial cell layer, as also seen by histological examination (Catelli et al., Citation1998; Jirjis et al., Citation2002). aMPV antigen was already detected at 24 hpi in TTOC in contrast to 48 hpi in CTOC. This result again supports observations from the field that turkeys are more susceptible to aMPV infection (Cook, Citation2000; Shin et al., Citation2000). At the beginning of detectable infection at 24 and 48 hpi, aMPV antigen was found exclusively at the cilia border of TOC of both species. As early as one day later, virus antigen was also demonstrated in the cytoplasm of the epithelial cells. Our results suggest that aMPV infection takes place at the apical region of the epithelium, which is comparable to the observations made after RSV infection of human nasal, tracheobronchial and bronchiolar airway epithelial cells (Zhang et al., Citation2002). Cilia may allow the virus to attach and therefore it may be suggested that polarized epithelial cells are the main target cells of aMPV (Jones et al., Citation1986; O'Loan & Allan, Citation1990; Majó et al., Citation1995; Jirjis et al., Citation2001; Citation2002; Zhang et al., Citation2002). In the present state of knowledge, the oviduct epithelium is the only other surface susceptible to aMPV, apart from respiratory epithelia (Jones et al., Citation1988). In addition, it has been suggested that macrophages may carry the virus and act as vectors within the host (Sharma et al., Citation2004).
aMPV replication leads to the highest number of virus-positive cells at 48 and 96 hpi in TTOC and CTOC, respectively, which correlates with onset of ciliostasis in both species. Furthermore, this result coincides with the incubation period of three to seven days in experimentally infected turkeys (Van Loock, Citation2006). The data regarding in vivo infection of chickens with aMPV are less clear, therefore the time of incubation may vary and has to be investigated in more detail in the future.
As an innate immunity parameter, we investigated the induction of apoptosis after aMPV infection. It is well known that apoptosis is a highly efficient protective response of the host cells against an infection. Viruses may on the other hand develop strategies to avoid apoptosis (Domachowske et al., Citation2000). No apoptotic cells were detected in the TTOC, while low numbers were found at 96 and 168 hpi in the CTOC. This observation in CTOC correlates with the beginning of epithelial cell loss and peak of virus replication. Nevertheless, even in TTOC, we noted loss of epithelial cells after aMPV infection. Further investigation of histological sections of the infected TOC after haematoxylin and eosin staining showed flat and detached cells with few apoptotic bodies in CTOC, and indications of necrosis and degeneration of epithelial cells in the TTOC. Therefore, the reason for the observed loss of cells in TTOC might be necrosis. Likewise, infection of the respiratory epithelium with hMPV led to degeneration, necrosis and to a response of neutrophils and an increased mucus production as seen in pediatric respiratory samples (Vargas et al., Citation2004). A similar observation was seen in one study case of RSV infection of respiratory epithelial cells showing loss of ciliary activity without apoptotic signs (Domachowske et al., Citation2001). The tissue damage after RSV infection is suggested to be due to other destructive immune responses, induced to control virus replication (Zhang et al., Citation2002).
To investigate possible interference of aMPV with innate immune mechanisms, we determined IFN-α and iNOS mRNA expression. IFN-α mRNA expression was down-regulated in aMPV-infected TOC of both species compared to the aMPV-free controls. This observation may explain why aMPV-infected TTOC did not show an increase in the apoptosis rate, as IFN is known to be an inducer of apoptosis (Takaoka et al., Citation2003). Other Paramyxoviridae, such as RSV and hMPV, are also known to antagonize the effect of IFN I and therefore avoid innate immunity, which increases their pathogenicity (Guerrero-Plata et al., Citation2005). Both RSV and hMPV were shown to interfere with the IFN cascade and to inhibit IFN production in the lung (Guerrero-Plata et al., Citation2005). It is suggested that the non-structural proteins NS1 and NS2 of RSV and the G protein of hMPV are responsible for the resistance to IFN-α, by inhibiting the effect of antiviral proteins including MxA or by targeting signalling pathways such as the RIG-I-dependent gene transcription (Schlender et al., Citation2000; Gotoh et al., Citation2001; Leyrat et al., Citation2014). We were able to show that the down-regulation of IFN-α mRNA expression was more prominent in CTOC than in TTOC. The consequences for aMPV pathogenesis in these two species have to be elucidated further.
Significant up-regulation of iNOS mRNA expression was observed at 48 hpi in TTOC compared to the virus-free controls (P < 0.05). iNOS up-regulation coincided with the peak of aMPV-positive cells in TTOC. iNOS is known to be expressed in macrophages and epithelial cells (Lin et al., Citation1996; Miyamoto et al., Citation2011). The subsequently produced NO may be an inducer as well as an inhibitor of apoptosis and it can be cytotoxic to virus-infected cells and therefore contribute to the clearance of infection. NO may also lead to cell death in bystander cells (Nathan, Citation1992; Reiss & Komatsu, Citation1998; Brüne, Citation2003; Kaiser et al., Citation2003; Monteiro et al., Citation2004). The toxic effect is achieved by peroxynitrite, a product of NO and (Akaike et al., Citation1996). Our results suggest that NO may act as an inhibitor of apoptosis in TTOC, but it may also contribute to the control of virus replication, because the number of aMPV-positive cells was reduced after 48 hpi in TTOC, despite there being target cells still available. In CTOC the significant up-regulation of iNOS mRNA started at 48 hpi with the beginning of aMPV replication and increased further until 120 hpi, the last time iNOS expression was investigated. Possibly, there is a correlation with the up-regulation of the apoptosis rate at 96 and 168 hpi. The higher fold-change value for iNOS mRNA expression in TTOC compared to CTOC could possibly be due to species-specific differences in quality and quantity of the innate immune responses following aMPV infection, as shown previously for other respiratory viruses (Petersen et al., Citation2012). Our data suggest that iNOS expression may play a role in the pathogenesis of aMPV infection in both species.
Overall, TTOC showed a higher susceptibility to aMPV infection with faster and higher replication rates, which led subsequently to a slightly earlier decrease in ciliary activity and faster lesion development compared to CTOC. TTOC and CTOC also showed differences in innate immune responses, such as iNOS and IFN-α mRNA expression as well as the apoptosis rate, which may explain the higher susceptibility and more severe signs in turkeys as seen in TOC in vitro as well as under experimental and field conditions in vivo.
Acknowledgements
The authors would like to thank Henning Petersen and Christine Haase for their technical support. Furthermore, for helpful discussion and critical review of the manuscript we would like to thank Colin Pielsticker from the Clinic for Poultry. This manuscript is part of the doctoral thesis of Sandra Hartmann, which was published in June 2015 at the University of Veterinary Medicine Hannover with the following title: “Vergleich der Erreger-Wirt-Interaktionen nach Infektion von Trachealorgankulturen von Huhn und Pute mit dem aviären Metapneumovirus”.
References
- Akaike, T., Noguchi, Y., Ijiri, S., Setoguchi, K., Suga, M., Zheng, Y.M., Dietzschold, B. & Maeda, H. (1996). Pathogenesis of influenza virus-induced pneumonia: involvement of both nitric oxide and oxygen radicals. Proceedings of the National Academy of Sciences, 93, 2448–2453. doi: 10.1073/pnas.93.6.2448
- Aung, Y.H., Liman, M., Neumann, U. & Rautenschlein, S. (2008). Reproducibility of swollen sinuses in broilers by experimental infection with avian metapneumovirus subtypes A and B of turkey origin and their comparative pathogenesis. Avian Pathology, 37, 65–74. doi: 10.1080/03079450701802222
- Banet-Noach, C., Simanov, L. & Perk, S. (2005). Characterization of Israeli avian metapneumovirus strains in turkeys and chickens. Avian Pathology, 34, 220–226. doi: 10.1080/03079450500112625
- Bao, X., Liu, T., Shan, Y., Li, K., Garofalo, R.P. & Casola, A. (2008). Human metapneumovirus glycoprotein G inhibits innate immune responses. PLoS Pathogens, 4, 1–12, e1000077. doi: 10.1371/journal.ppat.1000077
- Bao, X., Liu, T., Spetch, L., Kolli, D., Garofalo, R.P. & Casola, A. (2007). Airway epithelial cell response to human metapneumovirus infection. Virology, 368, 91–101. doi: 10.1016/j.virol.2007.06.023
- Biacchesi, S., Skiadopoulos, M.H., Tran, K.C., Murphy, B.R., Collins, P.L. & Buchholz, U.J. (2004). Recovery of human metapneumovirus from cDNA: optimization of growth in vitro and expression of additional genes. Virology, 321, 247–259. doi: 10.1016/j.virol.2003.12.020
- Brüne, B. (2003). Nitric oxide: NO apoptosis or turning it ON? Cell Death and Differentiation, 10, 864–869. doi: 10.1038/sj.cdd.4401261
- Buys, S.B., du Preez, J.H. & Els, H.J. (1989). Swollen head syndrome in chickens: a preliminary report on the isolation of a possible aetiological agent. Journal of the South African Veterinary Association, 60, 221–222.
- Catelli, E., Cook, J.K.A., Chesher, J., Orbell, S.J., Woods, M.A., Baxendale, W. & Huggins, M.B. (1998). The use of virus isolation, histopathology and immunoperoxidase techniques to study the dissemination of a chicken isolate of avian pneumovirus in chickens. Avian Pathology, 27, 632–640. doi: 10.1080/03079459808419395
- Catelli, E., Lupini, C., Cecchinato, M., Ricchizzi, E., Brown, P. & Naylor, C.J. (2010). Field avian metapneumovirus evolution avoiding vaccine induced immunity. Vaccine, 28, 916–921. doi: 10.1016/j.vaccine.2009.10.149
- Cook, J.K.A. (2000). Avian pneumovirus infections of turkeys and chickens. The Veterinary Journal, 160, 118–125. doi: 10.1016/S1090-0233(00)90486-6
- Cook, J.K.A., Darbyshire, J.H. & Peters, R.W. (1976). The use of chicken tracheal organ cultures for the isolation and assay of avian infectious bronchitis virus. Archives of Virology, 50, 109–118. doi: 10.1007/BF01318005
- Cook, J.K.A., Kinloch, S. & Ellis, M.M. (1993). In vitro and in vivo studies in chickens and turkeys on strains of turkey rhinotracheitis virus isolated from the two species. Avian Pathology, 22, 157–170. doi: 10.1080/03079459308418907
- Darbyshire, J.H., Rowell, J., Cook, J.K.A. & Peters, R.W. (1979). Taxonomic studies on strains of avian infectious bronchitis virus using neutralisation tests in tracheal organ cultures. Archives of Virology, 61, 227–238. doi: 10.1007/BF01318057
- Domachowske, J.B., Bonville, C.A., Mortelliti, A.J., Colella, C.B., Kim, U. & Rosenberg, H.F. (2000). Respiratory syncytial virus infection induces expression of the anti-apoptosis gene IEX-1L in human respiratory epithelial cells. The Journal of Infectious Diseases, 181, 824–830. doi: 10.1086/315319
- Domachowske, J.B., Bonville, C.A. & Rosenberg, H.F. (2001). Gene expression in epithelial cells in response to pneumovirus infection. Respiratory Research, 2, 225–233. doi: 10.1186/rr61
- Garcia-Sastre, A. (2001). Inhibition of interferon-mediated antiviral responses by influenza a viruses and other negative-strand RNA viruses. Virology, 279, 375–384. doi: 10.1006/viro.2000.0756
- Gotoh, B., Komatsu, T., Takeuchi, K. & Yokoo, J. (2001). Paramyxovirus accessory proteins as interferon antagonists. Microbiology and Immunology, 45, 787–800. doi: 10.1111/j.1348-0421.2001.tb01315.x
- Guerrero-Plata, A., Baron, S., Poast, J.S., Adegboyega, P.A., Casola, A. & Garofalo, R.P. (2005). Activity and regulation of alpha interferon in respiratory syncytial virus and human metapneumovirus experimental infections. Journal of Virology, 79, 10190–10199. doi: 10.1128/JVI.79.16.10190-10199.2005
- van den Hoogen, B.G., de Jong, J.C., Groen, J., Kuiken, T., de Groot, R., Fouchier, R.A. & Osterhaus, A.D. (2001). A newly discovered human pneumovirus isolated from young children with respiratory tract disease. Nature Medicine, 7, 719–724. doi: 10.1038/89098
- Horvath, C.M. (2004). Weapons of STAT destruction. interferon evasion by paramyxovirus V protein. European Journal of Biochemistry, 271, 4621–4628. doi: 10.1111/j.1432-1033.2004.04425.x
- Jirjis, F.F., Noll, S.L., Halvorson, D.A., Nagaraja, K.V. & Shaw, D.P. (2001). Immunohistochemical detection of avian pneumovirus in formalin-fixed tissues. Journal of Veterinary Diagnostic Investigation, 13, 13–16. doi: 10.1177/104063870101300103
- Jirjis, F.F., Noll, S.L., Halvorson, D.A., Nagaraja, K.V. & Shaw, D.P. (2002). Pathogenesis of avian pneumovirus infection in turkeys. Veterinary Pathology, 39, 300–310. doi: 10.1354/vp.39-3-300
- Jirjis, F.F., Noll, S.L., Halvorson, D.A., Nagaraja, K.V., Martin, F. & Shaw, D.P. (2004). Effects of bacterial coinfection on the pathogenesis of avian pneumovirus infection in turkeys. Avian Diseases, 48, 34–49. doi: 10.1637/7017
- Jones, R.C. (1996). Avian pneumovirus infection: questions still unanswered. Avian Pathology, 25, 639–648. doi: 10.1080/03079459608419171
- Jones, R.C., Baxter-Jones, C., Wilding, G.P. & Kelly, D.F. (1986). Demonstration of a candidate virus for turkey rhinotracheitis in experimentally inoculated turkeys. Veterinary Record, 119, 599–600.
- Jones, R.C., Williams, R.A., Baxter-Jones, C., Savage, C.E. & Wilding, G.P. (1988). Experimental infection of laying turkeys with rhinotracheitis virus: distribution of virus in the tissues and serological response. Avian Pathology, 17, 841–850. doi: 10.1080/03079458808436506
- Kaiser, P., Underwood, G. & Davison, T.F. (2003). Differential cytokine responses following Marek's disease virus infection of chickens differing in resistance to Marek's disease. Journal of Virology, 77, 762–768. doi: 10.1128/JVI.77.1.762-768.2003
- Karaca, K., Sharma, J.M., Tomai, M.A. & Miller, R.L. (1996). In vivo and in vitro interferon induction in chickens by S-28828, an Imidazoquinolinamine Immunoenhancer. Journal of Interferon and Cytokine Research, 16, 327–332. doi: 10.1089/jir.1996.16.327
- Karpala, A.J., Bagnaud-Baule, A., Goossens, K.E., Lowenthal, J.W. & Bean, A.G. (2012). Ontogeny of the interferon system in chickens. Journal of Reproductive Immunology, 94, 169–174. doi: 10.1016/j.jri.2012.02.008
- Kolli, D., Bao, X. & Casola, A. (2012). Human metapneumovirus antagonism of innate immune responses. Viruses, 4, 3551–3571. doi: 10.3390/v4123551
- Kuiken, T., van den Hoogen, B.G., van Riel, D.A., Laman, J.D., van Amerongen, G., Sprong, L., Fouchier, R.A. & Osterhaus, A.D. (2004). Experimental human metapneumovirus infection of cynomolgus macaques (Macaca fascicularis) results in virus replication in ciliated epithelial cells and pneumocytes with associated lesions throughout the respiratory tract. The American Journal of Pathology, 164, 1893–1900. doi: 10.1016/S0002-9440(10)63750-9
- Leyrat, C., Paesen, G.C., Charleston, J., Renner, M. & Grimes, J.M. (2014). Structural insights into the human metapneumovirus glycoprotein ectodomain. Journal of Virology, 88, 11611–11616. doi: 10.1128/JVI.01726-14
- Lin, A.W., Chang, C.C. & McCormick, C.C. (1996). Molecular cloning and expression of an avian macrophage nitric-oxide synthase cDNA and the analysis of the genomic 5′-flanking region. Journal of Biological Chemistry, 271, 11911–11919. doi: 10.1074/jbc.271.20.11911
- Loock, M.V., Loots, K., Zande, S.V., Heerden, M.V., Nauwynck, H., Goddeeris, B.M. & Vanrompay, D. (2006). Pathogenic interactions between Chlamydophila psittaci and avian pneumovirus infections in turkeys. Veterinary Microbiology, 112, 53–63. doi: 10.1016/j.vetmic.2005.10.013
- Lu, Y.S., Shien, Y.S., Tsai, H.J., Tseng, C.S., Lee, S.H. & Lin, D.F. (1994). Swollen head syndrome in Taiwan – isolation of an avian pneumovirus and serological survey. Avian Pathology, 23, 169–174. doi: 10.1080/03079459408418985
- Majó, N., Allan, G.M., O'Loan, C.J., Pagès, A. & Ramis, A.J. (1995). A sequential histopathologic and immunocytochemical study of chickens, turkey poults, and broiler breeders experimentally infected with turkey rhinotracheitis virus. Avian Diseases, 39, 887–896. doi: 10.2307/1592428
- Miyamoto, D.M., Ruff, K., Beach, N.M., Stockwell, S.B., Dorsey-Oresto, A., Masters, I. & Temple, L.M. (2011). Bordetella avium causes induction of apoptosis and nitric oxide synthase in turkey tracheal explant cultures. Microbes and Infection, 13, 871–879. doi: 10.1016/j.micinf.2011.04.011
- Monteiro, H.P., Silva, E.F. & Stern, A. (2004). Nitric oxide: a potential inducer of adhesion-related apoptosis – anoikis. Nitric Oxide, 10, 1–10. doi: 10.1016/j.niox.2004.02.002
- Munir, S. & Kapur, V. (2003). Regulation of host cell transcriptional physiology by the avian pneumovirus provides key insights into host-pathogen interactions. Journal of Virology, 77, 4899–4910. doi: 10.1128/JVI.77.8.4899-4910.2003
- Nathan, C. (1992). Nitric oxide as a secretory product of mammalian cells. The FASEB Journal, 6, 3051–3064.
- Naylor, C.J., Al-Ankari, A.R., Al-Afaleq, A.I., Bradbury, J.M. & Jones, R.C. (1992). Exacerbation of a Mycoplasma gallisepticum infection in turkeys by rhinotracheitis virus. Avian Pathology, 21, 295–305. doi: 10.1080/03079459208418844
- O'Loan, C.J. & Allan, G. (1990). The detection of turkey rhinotracheitis virus antigen in formalin fixed, paraffin embedded tissue using a streptavidin-biotin-immunoperoxidase method. Avian Pathology, 19, 401–407. doi: 10.1080/03079459008418690
- Petersen, H., Matrosovich, M., Pleschka, S. & Rautenschlein, S. (2012). Replication and adaptive mutations of low pathogenic avian influenza viruses in tracheal organ cultures of different avian species. PLoS One, 7, 1–12, e42260. doi: 10.1371/journal.pone.0042260
- Petersen, H., Wang, Z., Lenz, E., Pleschka, S. & Rautenschlein, S. (2013). Reassortment of NS segments modifies highly pathogenic avian influenza virus interaction with avian hosts and host cells. Journal of Virology, 87, 5362–5371. doi: 10.1128/JVI.02969-12
- Pfaffl, M.W. (2001). A new mathematical model for relative quantification in real-time RT-PCR. Nucleic Acids Research, 29, 2002–2007, e45. doi: 10.1093/nar/29.9.e45
- Powell, F.L., Rothwell, L., Clarkson, M.J. & Kaiser, P. (2009). The turkey, compared to the chicken, fails to mount an effective early immune response to Histomonas meleagridis in the gut. Parasite Immunology, 31, 312–327. doi: 10.1111/j.1365-3024.2009.01113.x
- Ramaswamy, M., Shi, L., Monick, M.M., Hunninghake, G.W. & Look, D.C. (2004). Specific inhibition of type I interferon signal transduction by respiratory syncytial virus. American Journal of Respiratory Cell and Molecular Biology, 30, 893–900. doi: 10.1165/rcmb.2003-0410OC
- Reemers, S.S., Groot Koerkamp, M.J., Holstege, F.C., van Eden, W. & Vervelde, L. (2009). Cellular host transcriptional responses to influenza A virus in chicken tracheal organ cultures differ from responses in in vivo infected trachea. Veterinary Immunology and Immunopathology, 132, 91–100. doi: 10.1016/j.vetimm.2009.04.021
- Reiss, C.S. & Komatsu, T. (1998). Does nitric oxide play a critical role in viral infections? Journal of Virology, 72, 4547–4551.
- Roussan, D.A., Haddad, R. & Khawaldeh, G. (2008). Molecular survey of avian respiratory pathogens in commercial broiler chicken flocks with respiratory diseases in Jordan. Poultry Science, 87, 444–448. doi: 10.3382/ps.2007-00415
- Schlender, J., Bossert, B., Buchholz, U. & Conzelmann, K.K. (2000). Bovine respiratory syncytial virus nonstructural proteins NS1 and NS2 cooperatively antagonize alpha/beta interferon-induced antiviral response. Journal of Virology, 74, 8234–8242. doi: 10.1128/JVI.74.18.8234-8242.2000
- Sekellick, M.J., Biggers, W.J. & Marcus, P.I. (1990). Development of the interferon system. I. In chicken cells development in ovo continues on time in vitro. In Vitro Cellular & Developmental Biology, 26, 997–1003. doi: 10.1007/BF02624475
- Sharma, J.M., Chary, P., Khatri, M., Cha, R. & Palmquist, J.M. (2004). Pathogenesis and control of avian pneumovirus. In U. Heffels-Redmann & E.F. Kaleta (Eds.), Proceedings of the IV International Symposium on Avian Corona-and Pneumovirus Infections (pp. 318–321). Rauischholzhausen.
- Shin, H.J., McComb, B., Back, A., Shaw, D.P., Halvorson, D.A. & Nagaraja, K.V. (2000). Susceptibility of broiler chicks to infection by avian pneumovirus of turkey origin. Avian Diseases, 44, 797–802. doi: 10.2307/1593051
- Suarez, D.L., Perdue, M.L., Cox, N., Rowe, T., Bender, C., Huang, J. & Swayne, D.E. (1998). Comparisons of highly virulent H5N1 influenza A viruses isolated from humans and chickens from Hong Kong. Journal of Virology, 72, 6678–6688.
- Sugiyama, M., Koimaru, H., Shiba, M., Ono, E., Nagata, T. & Ito, T. (2006). Drop of egg production in chickens by experimental infection with an avian metapneumovirus strain PLE8T1 derived from swollen head syndrome and the application to evaluate vaccine. The Journal of Veterinary Medical Science, 68, 783–787. doi: 10.1292/jvms.68.783
- Suresh, M., Karaca, K., Foster, D. & Sharma, J.M. (1995). Molecular and functional characterization of turkey interferon. Journal of Virology, 69, 8159–8163.
- Takaoka, A., Hayakawa, S., Yanai, H., Stoiber, D., Negishi, H., Kikuchi, H., Sasaki, S., Imai, K., Shibue, T. & Honda, K. (2003). Integration of interferon-α/β signalling to p53 responses in tumour suppression and antiviral defence. Nature, 424, 516–523. doi: 10.1038/nature01850
- Tristram, D.A., Hicks, W.Jr. & Hard, R. (1998). Respiratory syncytial virus and human bronchial epithelium. Archives of Otolaryngology-Head and Neck Surgery, 124, 777–783. doi: 10.1001/archotol.124.7.777
- Van Loock, M. (2006). Pathogenic interactions between Chlamydophila psittaci and avian pneumovirus infections in turkeys. Veterinary Microbiology, 112, 53–63. doi: 10.1016/j.vetmic.2005.10.013
- Van de Zande, S., Nauwynck, H., De Jonghe, S. & Pensaert, M. (1999). Comparative pathogenesis of a subtype A with a subtype B avian pneumovirus in turkeys. Avian Pathology, 28, 239–244. doi: 10.1080/03079459994722
- Vargas, S.O., Kozakewich, H.P., Perez-Atayde, A.R. & McAdam, A.J. (2004). Pathology of human metapneumovirus infection: insights into the pathogenesis of a newly identified respiratory virus. Pediatric and Developmental Pathology, 7, 478–486. doi: 10.1007/s10024-004-1011-2
- Vigerust, D.J. & Shepherd, V.L. (2007). Virus glycosylation: role in virulence and immune interactions. Trends in Microbiology, 15, 211–218. doi: 10.1016/j.tim.2007.03.003
- Villarreal, L.Y., Brandao, P.E., Chacon, J.L., Assayag, M.S., Maiorka, P.C., Raffi, P., Saidenberg, A.B., Jones, R.C. & Ferreira, A.J. (2007). Orchitis in roosters with reduced fertility associated with avian infectious bronchitis virus and avian metapneumovirus infections. Avian Diseases, 51, 900–904. doi: 10.1637/7815-121306-REGR4.1
- Williams, J.V., Tollefson, S.J., Johnson, J.E. & Crowe, J.E. (2005). The cotton rat (Sigmodon hispidus) is a permissive small animal model of human metapneumovirus infection, pathogenesis, and protective immunity. Journal of Virology, 79, 10944–10951. doi: 10.1128/JVI.79.17.10944-10951.2005
- Winter, C., Herrler, G. & Neumann, U. (2008). Infection of the tracheal epithelium by infectious bronchitis virus is sialic acid dependent. Microbes and Infection, 10, 367–373. doi: 10.1016/j.micinf.2007.12.009
- Zhang, L., Peeples, M.E., Boucher, R.C., Collins, P.L. & Pickles, R.J. (2002). Respiratory syncytial virus infection of human airway epithelial cells is polarized, specific to ciliated cells, and without obvious cytopathology. Journal of Virology, 76, 5654–5666. doi: 10.1128/JVI.76.11.5654-5666.2002