
ABSTRACT
Previous studies have implicated oestrogen as a factor in the induction of fatty liver haemorrhagic syndrome (FLHS). In this study, a refined laying hen model was employed to permit further investigations. Intramuscular (i.m.) injections of exogenous oestrogen as β-estradiol-17-dipropionate (E2) (5 mg/kg BW) were given every 4 days for 20 days to 30-week-old hens fed either ad libitum or with restricted feed intake. Elevated (P < 0.01) plasma oestrogen concentrations produced significant macroscopic and microscopic hepatic alterations. Hens in the E2-treated ad libitum fed (EAL) group experienced a higher incidence of FLHS than hens in the E2-treated restricted feed intake group, showing that birds with a higher feed intake are more at risk of developing FLHS. Histological examination of livers revealed that hens in the E2-treated ad libitum fed group had consistent and severe fat infiltration in the liver, and fat vacuolization within hepatocytes. Fat accumulation and fat droplets were found not only in the cytoplasm of hepatocytes but also in liver sinusoids. White blood cell counts and fibrinogen concentrations were altered (P < 0.01) in hens treated with E2 when compared with controls. Plasma fibrinogen concentrations were altered over time, and correlated with white blood cell counts (Pearson’s correlation r = 0.96; P = 0.001). Hens treated with E2 had increased (P < 0.01) levels of cholesterol and triglycerides, confirming that E2 induced hypercholesterolaemia and hypertriglyceridaemia. It was concluded that E2 successfully induced FLHS in hens, with typical systemic and hepatic events resulting from a disturbance in lipid metabolism and chronic low-grade inflammation.
Introduction
Fatty liver haemorrhagic syndrome (FLHS) is a non-infectious disease (or metabolic disorder) of laying hens characterized by excessive accumulation of fat in the liver and abdominal cavity, liver rupture, and hepatic haemorrhage (Crespo & Shivaprasad, Citation2003). Clinical signs of FLHS are variable and can range from mild inappetence and inactivity, to acute haemorrhage and sudden death. All laying hens have fatty livers, but, as suggested by many investigators, excessive fat infiltration appears to occur in laying hens under conditions of excess energy intake due increased feed intake coupled with high circulating oestrogen concentrations (Polin & Wolford, Citation1976, Citation1977; Pearson & Butler, Citation1978b; Walzem et al., Citation1999). Other husbandry factors can also predispose hens to FLHS, including dietary ingredients that stimulate lipogenesis, genetics, environmental conditions, and stress in general (Couch, Citation1956; Jaussi et al., Citation1962; Bragg et al., Citation1973; Jensen et al., Citation1976; Pearson & Butler, Citation1978a; Stake et al., Citation1981). The housing system plays a major role in the occurrence of FLHS (Ringer & Sheppard, Citation1963, Jensen et al., Citation1976; Peckham, Citation1984; Weitzenburger et al., Citation2005; Shini et al., Citation2006; Fossum et al., Citation2009; Shini & Bryden, Citation2009; Shini et al., Citation2019a). The incidence of FLHS was found to be high in commercial cage layer operations, accounting for 40–70% of hen mortality (Shini et al., Citation2006; Shini et al., Citation2019a). It was also suggested that FLHS could be the most common non-infectious cause of mortality in backyard laying hens (Mete et al., Citation2013; Trott et al., Citation2013). As with many other metabolic disorders, FLHS remains an unresolved condition of laying hens. The aetiology of FLHS has not been clearly defined and the pathogenesis is poorly understood, despite 50 years of research. It causes economic losses through reduced egg output or increased mortality; however, it is often overlooked due to difficulties in detecting and preventing the condition in commercial flocks (Scheele, Citation1997; Decuypere & Verstegen, Citation1999; Julian, Citation2005).
The initiation, progression and resolution of FLHS are very difficult to follow in a commercial laying flock, as it occurs sporadically and over an extended period. Diagnosis is only possible at necropsy. To overcome this difficulty, there have been many attempts to develop models to study the pathogenesis of the disease. Most models have manipulated energy intake, and/or elevated circulating oestrogen (E2) concentrations in either immature chicks (Balnave, Citation1971; Harms et al., Citation1977; Pearson & Butler, Citation1978b; Klimis-Tavantzis et al., Citation1983; Chawak et al., Citation1997) or mature hens of laying breeds (Harms et al., Citation1977; Polin & Wolford, Citation1977; Pearson & Butler, Citation1978b; Stake et al., Citation1981). These approaches have generally been successful in increasing liver fat content, but have had varying success in inducing FLHS. The induction of FLHS in mature hens appears to be more reliable than in immature birds (Stake et al., Citation1981). There may be other metabolic factors that predispose the hen in lay to FLHS in addition to circulating concentrations of oestrogen and energy intake.
In a previous study (Shini et al., Citation2019a), we observed a high incidence of FLHS in commercial layer strains maintained in cages. For the present study, using a similar commercial laying strain (Hy-Line Brown) at peak-of-lay, we induced FLHS reliably by administering exogenous E2 and manipulating feed intake. Our hypothesis was that exposing hens to exogenous E2 and feeding them ad libitum would precipitate FLHS while reducing feed intake would decrease the incidence of FLHS. The development of this model should assist the unravelling of the cellular and molecular events preceding excessive fat accumulation and liver rupture in hens.
Materials and methods
Ethical statement
Experiments conducted in this study were approved by the University of Queensland Animal Ethics Committee and complied with the Australian Code of Practice for the Care and Use of Animals for Scientific Purposes. Experiments were carried out at the Poultry Science Unit of the University of Queensland, Gatton Campus.
Laying hens and housing conditions
One hundred and eight, 30-week-old Hy-Line Brown laying hens were housed in individual cages in a temperature-controlled shed and exposed to standard lighting programme (16L:8D). The temperature of the shed ranged from 22°C to 24°C. Birds were fed a commercial layer (wheat–sorghum–soybean) diet with the following specifications: crude protein (CP) 17.5%; crude fat 3.91%, linoleic acid 1.21%, metabolizable energy (ME) 11.5 MJ/kg; calcium (Ca) 4.1%; available phosphorus (P) 0.40%; sodium (Na) 0.18%; lysine 0.85%, methionine + cystine 0.77%. Water was provided ad libitum.
Experimental induction of FLHS
The study commenced when hens were 30 weeks of age and continued for 4 weeks. The hens were injected with E2 (5 mg/kg body weight in 0.5 ml corn oil) every fourth day for 20 days (six injections in total). The dose was delivered i.m. into the pectoral muscle and adjusted to initial body weight (BW). In addition to the administration of exogenous E2, energy intake (estimated as total feed intake) of birds was manipulated by feeding birds an ad libitum diet (AL) or restricting feed intake (RF). Hens in the restricted feed intake treatment were given 10% less feed than the breeder’s recommendation (Hy-Line, Citation2008). It was anticipated that this level of restriction would reduce excessive energy intake without disturbing the birds' physiology. Hens were randomly allocated into six groups (18 hens per group) and three treatments: two control groups were untreated (control/untreated, ad libitum feed intake (CAL) and control, restricted feed intake (CRF)), two treated groups were injected with the E2 (EAL and ERF), and two other groups were treated with vehicle/oil only (OAL and ORF). For each of these treatments, one group was fed an ad libitum diet (CAL, EAL, OAL), and the second group was fed a restricted feed intake diet (CRF, ERF, ORF). For more details on experimental treatments and sampling protocol, see the Supplementary Material, Table 1, available online.
Production and mortality records were kept and used to calculate: hen day production [expressed as percentage of eggs produced per hen per day (%HDP)], egg weight (g), body weight (BW), and mortality rate [expressed as percentages (%) of cumulative mortality from start of the experiment]. Feed intake (FI) g/bird/day was calculated only for birds that were fed ad libitum.
Blood sampling and tests
Blood samples were taken from the wing vein using individual EDTA vacutainers. At each sampling point, six birds per treatment were bled. Whole blood was used to measure haematological parameters in an automated analyser (CELL-DYN® System 3700CS, Abbott Park, IL 60064, USA), including, the total number of red blood cells (RBC) and white blood cells (WBC), WBC differentials (%), haematocrit (HCT) and haemoglobin concentration. For other analyses, blood was centrifuged (1500 ×g for 10 min) and plasma was stored at −20°C. Plasma metabolites, cholesterol (CHOL), triglycerides (TG), total protein (TP), glucose, gamma glutamyl transferase (GGT), and aspartate aminotransferase (AST) were determined using commercial kits and a chemistry system (VetTest chemistry analyser, IDEXX Laboratories, Inc., Westbrook, ME, USA). IDEXX dry-slide technology provides accurate results even on samples compromised by haemolysis or lipaemia (as is the case with high levels of TG in avian female samples). Plasma fibrinogen concentrations were determined by refractometry method (Schalm, Citation1980). Plasma 17-β oestradiol concentration was determined by radioimmunoassay (RIA), using coated tube technology (Spectria, Orion Diagnostica Oy, Espoo, Finland). The RIA assays were conducted according to the manufacturer’s instructions using duplicate 200 μl samples and counted on a Gamma Counter (Wallac 1470 Wizard Automatic). At 394 and 9520 pmol/l, the inter-assay variations were 5.1% and 8%, respectively, and the intra-assay coefficient of variation was 4.33%. The assay sensitivity ranged between 30 and 15,000 pmol/l. The antiserum was highly specific for 17-β oestradiol with relatively low cross-reactivity to other naturally occurring steroids in the plasma sample as stated by the manufacturer. All samples (standards, controls, and unknowns) were assayed in duplicate. A calibration curve was constructed and the oestradiol concentrations of the unknowns were determined from the standard curve and expressed as pmol/l, and then converted to pg/ml plasma.
Necropsy, liver sampling, and liver tests
At each sampling point (0, 24 h, 1, 2, 3, and 4 wk), three hens per treatment were euthanised by cervical dislocation and necropsied for liver macroscopic and microscopic evaluation, and any other findings (Supplementary Material, Table 1). Samples were also taken from hens that were found in distress and euthanised during the experiment. The liver was removed, weighed, examined for the presence of lesions and haemorrhagic scoring. Haemorrhages and haematomas were counted on both dorsal and ventral surfaces of the liver. Liver lesions were graded on a scale from 0 to 5 (Shini et al., Citation2019a). Liver weight (g), and relative liver weights (liver to body weight ratios, g/100 g body weight) were calculated and recorded. Liver samples were taken for the determination of total liver fat content, and liver histology. The liver lipid content was determined by the method of Folch et al. (Citation1957). One gram of sample was weighed into a screw-capped test tube with 20 ml of chloroform/methanol (2:1, vol/vol), and homogenized with a polytron (Type PT 10/35) for 5–10 s at high speed. After overnight incubation at 4°C, the homogenate was filtered through Whatman #1 filter paper into a 100 ml graduated cylinder, and 5 ml of 0.88% sodium chloride solution was added and mixed. After phase separation, the volume of the lipid layer was recorded, and the top layer was completely drained off. Total lipids were determined gravimetrically after evaporating the solvent. The sample was then dried and weighed, and the total lipid weight was calculated, and expressed as the percentage of liver fat against the total liver weight.
For microscopic examination, two liver slices about 1 × 1 × 0.3 cm in size were taken from the right lobe of each hen, fixed in 10% neutral buffered formalin, embedded in paraffin, sectioned, and stained with haematoxylin and eosin (H&E). The ovaries of hens were also inspected for internal ovulations, internal oviposition, ovarian enlargement or regression, and follicular atresia. Light microscopy (20× and 40× magnification) was used to examine three randomly chosen areas for each liver section and evaluated for macrovesicular fatty changes. In this case, a fat vacuole distends the hepatocyte and pushes the nucleus and cytoplasm to the side; a fat vacuole was considered to be any non-staining area of cytoplasm with sharply defined borders. Inflammation was confirmed by focal infiltration of liver tissue with leukocytes. The presence of haemorrhage was determined on the basis of congested perivenular and periarterial zones (due to dilation of arteries and veins), including focal infiltration of liver tissue with RBC. All slides were evaluated in a blind manner by two observers.
Statistical analysis
Data were subjected to a two-way ANOVA for repeated measure SAS programme, and all analyses were performed using the General Linear Model procedure of Statistical Analysis Software (SAS Inc., Citation2001). The effects of independent factors, E2 and diet (ad libitum vs. restricted feed intake), were tested on dependent variables. When significant differences were found, comparisons among treatments were conducted by Duncan’s multiple comparison test. Statements of significance are based on P < 0.05. Correlations between parameters were determined using Pearson’s correlation coefficient.
Results
Feed intake and body weight of hens
There were no significant differences in the feed intake of hens in both ad libitum fed groups (E2 treated and control hens). Hens in CAL and EAL treatments consumed on average 115–122 g/bird/day, respectively, during the whole experimental period. Body weights of birds in both ad libitum fed groups (CAL and EAL birds) did not change significantly after the first week of the experiment (Supplementary Material, a). Hens in both restricted feed intake groups (CRF and ERF) had reduced BW (P < 0.01) in the second week of the experiment when compared to both their initial body weight, and hens fed ad libitum. In the second week of treatments, BW of CRF and ERF birds remained lower (without recovering), and were slightly reduced again at week 4. At week 4, hens with restricted feed intake had lower (P < 0.01) BW when compared to all other hens (CAL vs. CRF, 1892 vs. 1687 g).
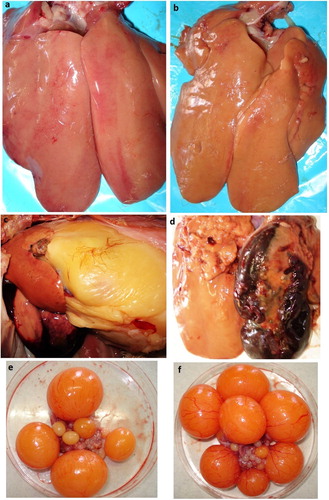
Figure 1. Livers and ovaries from control hens, and hens treated with exogenous oestradiol, showing haematomas and internal haemorrhage. images presented here show livers removed from birds at the end of the experiment (week 4); a liver from a control hen (a); a liver with changed colour and some fat deposition on the surface (b); ruptured liver capsule and internal bleeding (c); liver with a large haematoma (d). Ovaries removed from birds after first week of treatment with E2 showing an increase in ova size (f), compared to untreated hens (e).
Egg production and egg weight
At 30–31 wk of age, hens reached peak egg production, i.e. %HDP over 95% (Supplementary Material, b). Compared to ad libitum fed hens, restricted hens had reduced %HDP in weeks 3 and 4 (P < 0.05). At week 4, E2-treated and untreated hens (in the restricted feed intake group) had reduced (P < 0.05) %HDP as compared to initial %HDP, or hens in the ad libitum groups. Egg weight data of control and treated hens are shown in Supplementary Material, (c). Hens entered the experiment with an average egg weight of 57.8 g. At week 3, egg weights of E2-treated hens fed ad libitum were increased significantly (P < 0.05) (Supplementary Material, Figure 1c). At scheduled necropsy, hens from the EAL group had ovaries full with large ova (yolks). Egg weights of hens in the restricted feed diet were significantly decreased by week 4. Oestrogen levels and egg weights of E2-treated hens at week 3 were positively correlated (Pearson’s correlation, r = 0.90; P < 0.01).
Induction and the incidence of FLHS
The incidence (%) of FLHS, mortality (%), liver haemorrhagic score, liver weight (g), relative liver weights (g liver/100 g BW), and liver fat content (%) of treated and control birds are presented in . Birds treated with exogenous E2 and fed an ad libitum diet developed severe signs of FLHS. In 87.5% of birds for this treatment, liver haemorrhagic score was found to be 4–5 ((c,d)). Three birds (or 18.8%) in this group died due to FLHS (i.e. haemorrhages or haematomas in the liver). Oestrogen-treated birds in the restricted feed intake group also developed FLHS but the incidence was 20% lower (P < 0.05; 68.8% vs. 87.5%). There were no mortalities in control groups (untreated or oil-treated birds). All control groups had a low incidence of FLHS, in terms of haemorrhagic score, with birds having a small number of haemorrhages or petechiae in the liver (). Control hens in the restricted feed intake group had a lower incidence of FLHS than hens in the control ad libitum fed groups (6.3% vs. 18.8%). The relative liver weights (g/100 g) were significantly increased (P < 0.05) in E2-treated hens when compared to controls (2.9 vs. 2.1). Data on other liver measurements indicated that treatment with E2 induced a significant increase (P < 0.05) in liver weight, and liver fat content (). In particular, the EAL-treated hens had an increase in liver fat content over 50%. There was an observed enlargement of the ova in EAL-treated hens compared to control hens ((e,f)), while hens in CRF and ERF showed a reduction of large yellow follicles (no measurements were conducted with ovaries). No internal ovulations were found in any of the treated or untreated birds.
Table 1. Effect of oestrogen injections and feed restriction on the incidence of FLHS, mortality, liver haemorrhagic score, liver weight and fat content, and relative liver weight of laying hens.1
Plasma oestradiol concentration
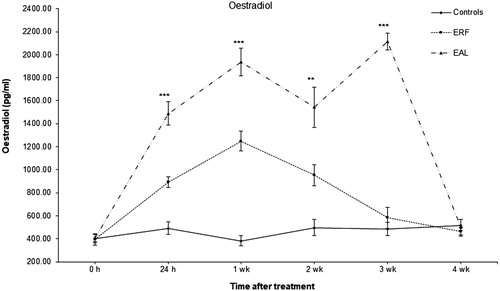
The baseline concentrations of oestradiol were found to range between 350 and 500 pg/ml in all groups. Plasma oestradiol concentrations were elevated by exogenous administration of E2 5 mg/kg BW (). At 24 h post-injections, plasma oestradiol levels were 2–3 times higher compared to baseline levels and control birds (approx. 1500 and 900 pg/ml in EAL and ERF birds, respectively). The oestradiol concentrations peaked twice for EAL-treated birds (at week 1 and week 3 after treatments started) with the highest value of approx. 2115 pg/ml reached at week 3. The oestradiol concentration for ERF birds was significantly lower (P < 0.05) than EAL birds; however, ERF birds showed a significant increase (P < 0.05) in oestradiol concentrations compared to control birds. Birds in the ORF group had slightly lower levels of oestradiol than other controls, however this difference was not significant (P > 0.05) from other controls; therefore data are presented together for all controls. In the treatment group EAL, oestradiol concentrations were elevated over the whole period of the experiment, and the levels decreased and reached the baseline 10 days after the last treatment (). It should be noted that the E2 treatment did not always fit with blood sampling for oestradiol measurements; treatments were every 4–5 days, while blood sampling was performed at time 0 h and at 24 h and then weekly.
Figure 2. Effect of exogenous oestradiol on plasma oestradiol concentration in treated and control hens. Controls: control and oil-treated, ad libitum feed intake; control and oil-treated restricted feed intake. EAL: oestrogen-treated, ad libitum feed intake; ERF: oestrogen-treated, restricted feed intake. There were no significant differences between untreated and oil-treated groups (for both diets, ad libitum and restricted feed intake); therefore, data were pooled and presented together for control untreated and oil-treated groups. Values are presented as mean ± SD (n = 6, at each time point); significant differences between groups are represented by *P < 0.05; ** P < 0.01; ***P < 0.001.
Peripheral leukocyte counts and fibrinogen concentration
As shown in , at 24 h, 1, 2 and 3 wk post-treatment, E2-treated hens of both groups (EAL and ERF) showed a significant (P < 0.01) increase in peripheral WBC, when compared to basal (at 0 h) levels, and control hens (at 0 and 24 h). At 2 wk post-treatment, WBC counts increased rapidly (P < 0.01) in E2-treated birds of the EAL group and peaked with a value of 64.8 ± 4.6 × 10⁹/l. The WBC counts stayed elevated for both E2-treated groups (EAL and ERF) in the following week (week 3) and were reduced at week 4 (or 1 week after the last treatment with E2). Plasma fibrinogen levels were also elevated (P < 0.01) over time in EAL and ERF hens, predominantly in the first and second week post-E2 treatment. Fibrinogen levels peaked earlier than the WBC counts at week 1 (the value was approx. 3 times higher than the baseline, ca. 6 g/l), and continued to be elevated at week 2, in both E2 treatment groups (EAL and ERF). Thereafter, plasma fibrinogen concentrations declined and were found to be significantly (P < 0.05) lower than the baseline levels. There was a low positive correlation between WBC counts and fibrinogen concentrations over time in E2-treated hens (Pearson’s correlation r = 0.20; P = 0.014). The highest correlation was found at week 2 (Pearson’s correlation r = 0.96; P = 0.001) post-treatment. All control hens (fed ad libitum or with restricted feed intake) had slight and insignificant (P > 0.05) changes of WBC and fibrinogen levels over time; there were no significant differences (P > 0.05) in RBC counts and HCT for all treated and untreated hens ().
Table 2. Haematological parameters and plasma fibrinogen concentration of control and E2-treated hens.
Plasma metabolites
(a–d) present data on plasma metabolites (CHOL, TG, TP, and AST, respectively) from E2 treated and control hens. There were no significant differences between control groups (untreated and oil-treated groups, under ad libitum and restricted feed intake diets: CAL, OAL, and ORF), therefore data were pooled and presented together. Hens treated with E2 showed increased (P < 0.01) levels of plasma CHOL and TG, at 24 h, weeks 1, 2, and 3 after treatments ((a,b)). In both E2-treated groups (EAL and ERF) plasma CHOL rose 24 h after treatment, and was found elevated during the whole experimental period; however, ad libitum treated hens had higher (P < 0.05) levels of CHOL than hens in the restricted feed intake treatment. Hens in E2-treated groups had higher levels (P < 0.01) of plasma TG than controls, at all measurement points after first treatment with E2. TP concentrations in EAL and ERF groups were decreased at week 1 after treatment with E2, and were found lower than the levels of control hens ((c)).
Figure 3. Plasma metabolite concentrations in oestradiol-treated and untreated birds. Cholesterol (mmol/l) (a); TG (mmol/l) (b); TP (g/l) (c); AST (IU/l) (d); Values are presented as mean ± SD (n = 6, at each time point); there were no significant differences between untreated and oil-treated groups (for both diets, ad libitum, and restricted feed intake); therefore, data were pooled and presented together for control untreated and oil-treated groups. EAL: oestrogen-treated, ad libitum feed intake; ERF: oestrogen-treated, restricted feed intake; OAL: oil-treated, ad libitum feed intake; ORF: oil-treated, restricted feed intake; CAL: control/untreated, ad libitum feed intake; CRF: control/untreated, restricted feed intake; significant differences between groups are represented by *P < 0.05; **P < 0.01; ***P < 0.001.
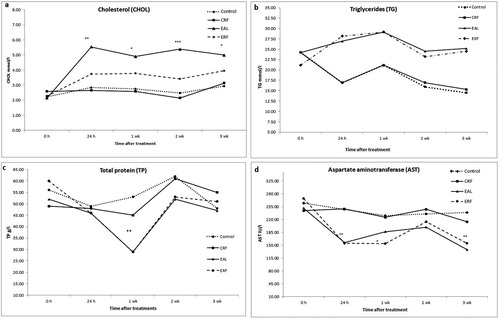
For this study, both AST and GGT were measured to assess changes in liver enzyme activity in treated or untreated birds. However, changes in GGT concentrations were insignificant (data not shown). The levels of plasma AST ((d)) revealed a significant decrease of AST concentration in particular at 24 h, 1, and 3 wk after the first treatment with E2, in both E2-treated groups (EAL and ERF). At week 2, levels of AST were not significantly different from control birds.
Liver macroscopic and microscopic examination
The majority of livers examined from hens treated with E2 were pale, swollen, and friable with different grades of haemorrhages and haematomas on both surfaces (dorsal and ventral) or in the edges of both lobes. In severe cases (a haemorrhage score of 4 or 5), liver tissue was ruptured and small superficial or deep haematomas or large blood clots were present in the abdominal cavity ((c,d)). Hens with liver rupture or very large haematomas ((c)) died during the experimental period (see mortality data in ); most deaths in E2-treated birds happened in the first or second week of treatment. Hens with small or medium haematomas survived and were diagnosed with FLHS after euthanasia ((d)). These hens stopped egg production earlier in week 2.
Data on other liver measurements showed that E2 treatment resulted in a significant (P < 0.05) increase in liver relative weight and fat content in treated hens vs. controls (). Oestradiol treatment resulted in an increased infiltration of liver tissue and hepatocytes with fat. This can be seen macroscopically in (c,d). Histologically, all livers had some degree of significant lipid accumulation ((a–f)). However, E2-treated birds demonstrated severe fat deposition, as indicated by the presence of small or large fat droplets in hepatocytes, or large fat vacuoles filling the cytoplasm and distending hepatocytes ((c,d)). In addition to fat deposition, histological sections of E2-treated birds demonstrated focal inflammation (lymphocytic or mononuclear, and heterophilic infiltration), local haemorrhage and congestion of sinusoids surrounding the central venae ((d–f)).
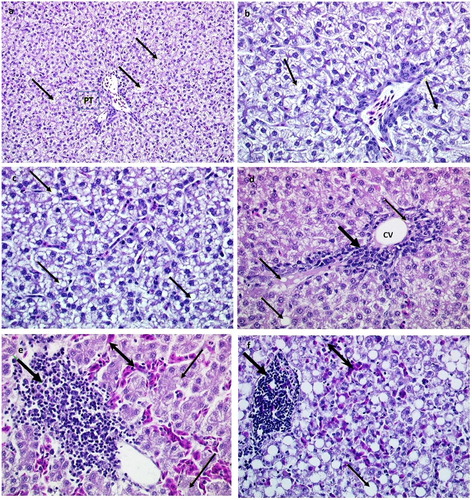
Figure 4. Histological sections of livers from hens in the control group and hens treated with oestradiol. Images (a and b) show normal structure of the tissue with some fat deposition (thin arrows) in hepatocytes, and small fat vacuoles around the nucleus (microvesicular fatty change) PT=portal triad; H&E stain, using ×200 (a) and ×400 (b) magnification; portal triad = PT. Images (c and d) present livers from treated hens (after week 1), while images (e and f) show livers of oestradiol- treated hens (after week 2); CV=central vein. Thin arrows show fat vacuoles in hepatocytes and fat droplets in the enlarged sinusoid; nucleus disappeared or displaced to periphery in hepatocytes (macrovesicular steatosis). Note focal infiltration with leukocytes (thick arrow) near central vein (CV); and erythrocytes (double-headed arrow). H&E stain, using ×400 magnification.
Discussion
FLHS was experimentally induced in the laying hen. The administration of exogenous E2 in mature birds elevated (P < 0.01) plasma oestrogen concentrations and reproduced significant clinical lesions, haemorrhagic scores, histopathological alterations, and mortality that were similar to naturally occurring cases of FLHS (Shini et al., Citation2019). Stake et al. (Citation1981) used a similar model to evaluate breed differences in response to exogenous E2 injections. For the current study, 30-week-old Hy-Line Brown laying hens were used and treated with E2 (5 mg/kg BW). The induction of FLHS in these hens was associated with significant hepatic changes (e.g. relative weights and fat content) and liver macroscopic (haemorrhages and haematomas) and microscopic alterations. In the accompanying paper (Shini et al., Citationunder review) we have used exogenous E2 and lipopolysaccharide (LPS) to induce FLHS in another commercial layer strain, Hisex brown laying hens. Many investigators have suggested that oestrogen, along with a positive energy balance, are necessary for the production of FLHS (Harms et al., Citation1977; Polin & Wolford, Citation1977; Pearson & Butler, Citation1978b; Stake et al., Citation1981; Haghighi-Rad & Polin, Citation1982). In the current study, the effect of feed intake (ad libitum vs. restricted feed intake) on the incidence and progression of FLHS was also explored.
As expected, ad libitum hens demonstrated a higher incidence of FLHS than hens fed a restricted diet. This was in agreement with previous studies (Lee et al., Citation1975; Harms et al., Citation1977; Pearson & Butler, Citation1978b; Stake et al., Citation1981; Haghighi-Rad & Polin, Citation1982), which suggested that birds with a greater feed intake are more at risk of developing FLHS. In the current study, hens fed ad libitum experienced severe FLHS and an increase in mortality (approx. 20% of hens in E2-treated ad libitum group vs. 0% of hens in control ad libitum group). Hens that did not die from FLHS were diagnosed with FLHS at necropsy. Approximately 88% had a very high haemorrhagic score (4–5) and high liver fat content (over 40%). Overall, restriction of feed intake reduced the occurrence of FLHS in hens treated with E2, in terms of mortality and haemorrhagic score. However, it also affected hen performance. Our hypothesis, to reduce feed intake by 10% so the positive energy balance could be minimized without disturbing hen physiology, was rejected. In fact, feed intake records showed that hens fed ad libitum consumed more feed than the breeder’s recommendation, or approx. 120 g/bird/day, suggesting that the feed intake of hens in CRF and ERF groups was reduced by greater than 10% or approx. 20 g/bird/day. Most probably, this was the reason for reduced BW, egg production and egg weights of restricted fed hens during weeks 3 and 4 of the experiment. Despite these treatment effects, egg production remained over 80% throughout the experiment.
Our results demonstrated that a dose 5 mg/kg BW of E2 every fourth day (equivalent to 1.25 mg/kg BW/day) increased circulating concentrations of the hormone (P < 0.01) above physiological values, and induced the condition without any of the neurological side effects (ataxia and opisthotonus) noted by Stake et al. (Citation1981) in Rhode Island Red hens. As demonstrated in this study, external (e.g. nutritional) and internal (e.g. hormones) factors, may stimulate hepatic lipid synthesis and increase fat deposition in the liver and abdominal cavity. Typically, in the laying hen, baseline E2 increases 1–2 days after photostimulation and is maintained at a high level until egg production starts to decline (Etches & Cheng, Citation1981). In the adult bird, the rate of secretion of oestradiol by the ovary is of the order 1–2.0 mg oestradiol/24 h (Hawkins et al., Citation1969), while the clearance rate for oestradiol is between 6.3 and 11 ng/min (Johnson & van Tienhoven, Citation1981; Tsang & Grunder, Citation1984). This kinetic is important for maintaining elevated oestradiol levels. At the same time as oestradiol elevates, hepatic lipogenesis increases dramatically in order to meet the demand for vitellogenesis (Hansen & Walzem, Citation1993).
While the main products of de novo hepatic lipogenesis are TG, the liver is also the major site of CHOL and phospholipid synthesis (Hermier, Citation1997). Our data demonstrated that E2 significantly induced hypercholesterolaemia and hypertriglyceridaemia. Once secreted from the liver into the blood, exogenous and endogenous lipids are transported as components lipoproteins to the ovary. Fatty livers are normal for egg producing hens and occur when the increase in lipogenesis exceeds the capacity of synthesis and secretion of lipoproteins (Hermier, Citation1997). The fat content of the livers of hens with FLHS exceeded 40% of dry weight, but it can be increased above 70% of dry weight, largely due to an increase in the amount of TG (Squires & Leeson, Citation1988). In this study, liver fat content was found to be approx. 51% of liver wet weight in hens with FLHS.
The histological examination of livers revealed that all hens had some degree of hepatic fat infiltration (microvesicular fatty change) ((a,b)). However, hens treated with E2 had consistent and severe infiltrations with fat, and fat vacuolizations (macrovesicular fatty degeneration or steatosis) ((c,d)). The current study was in agreement with histological observations of previous investigators (Pearson & Butler, Citation1978c; Walzem et al., Citation1993; Cherian & Goeger, Citation2004), and confirmed transient and massive accumulation of lipids in the cytoplasm of hepatocytes ((c)). Interestingly, apart from large vacuoles in the liver parenchyma, fat droplets were observed in liver sinusoids in histological examination of E2-treated birds ((d)). Sinusoids are distensible vascular channels that carry mixed blood (from portal vein and hepatic artery) from the edges of the lobule to the central vein, which then empties into the hepatic vein, subsequently draining into the inferior vena cava (Sturkie, Citation1986). The sinusoidal wall is formed by four different cell types: fenestrated endothelial cells, Kupffer cells, fat-storing cells, and pit cells (the natural killer cells of the liver). The role of sinusoidal endothelial cells is to permit hepatocytes to access nutrients and macromolecules from plasma; they are also responsible for endocytosis of molecules and particles such as lipoproteins (Wisse et al., Citation1996; Tanaka et al., Citation2011). The presence of fat-storing cells (stellate cells) or lipocytes or vitamin A storing cells has been shown in mammals (Wisse et al., Citation1996). Previous FLHS investigators have not reported or discussed the presence of fat droplets in the sinusoids or blood vessels of the liver in the hen and their implication in the pathogenesis of FLHS.
As discussed above, in avians the liver is directly exposed to dietary fat, and is also the major site of lipogenesis (Bickerstaffe & Annison, Citation1970). Unlike mammals, chickens have a rudimentary lymphatic system, thus the absorption of dietary fat (or portomicrons) in birds occurs directly via the portal blood system, and lipids are rapidly taken up by the liver (Cherian et al., Citation1996). One interesting fact is that the fenestra in the sinusoidal endothelium of liver tissue in chickens are smaller in size and lower in number than in mammals; therefore the endothelium is less porous (Fraser et al., Citation1986; Braet & Wisse, Citation2002). This characteristic may prevent hepatocytes from being swamped by dietary fat, but, at the same time, it makes the chicken susceptible to diet-induced atherosclerosis (Fraser et al., Citation1986). There is no evidence of atherosclerosis found in laying hens with FLHS. As in female mammals, there is evidence that in CHOL-fed chicks, oestrogens inhibit coronary atherosclerosis (Hanke et al., Citation1996; Beaufrère, Citation2013; Petzinger & Bauer, Citation2013). In the chicken, the fenestrated endothelial cells in the liver may act as a sieve allowing only small macromolecules and portomicrons to cross through the fenestrations (sieve plates) to hepatocytes. Apparently, large particles that cannot pass the fenestrae in the sinusoidal capillary bed (and cannot be also processed by the liver) are trapped inside the sinusoids surrounding a central vein ((d)). These specific structural features of chicken liver could be reasons for hepatic steatosis and, under certain circumstances, for the precipitation of FLHS in hens.
Haematological parameters were used to monitor the progression of FLHS. It was thought that these parameters (particularly the RBC and HCT) would help to predict any recent haematoma or haemorrhage in the liver or abdominal cavity of hens treated with E2. The HCT and RBC counts are usually decreased in haemorrhages and haematomas (Lumeij, Citation2008). In this study, there were no changes (P > 0.05) in HCT and RBC values, yet these parameters remained only slightly depressed in E2-treated hens. This could have happened because birds usually have a good tolerance of blood loss (Sturkie, Citation1986). When birds lose a low quantity of blood (under 10% of their circulating blood volume), they experience physiological stress that helps them to replenish the blood loss (Kovach et al., Citation1969). In the case of small internal haemorrhages and haematomas in this experiment, a simultaneous release of RBC from reserves in the bone marrow, and rapid fluid replacement or relocation across compartments, could have happened (Sturkie & Griminger, Citation1986), so hens did not exhibit clinical signs. In the case of large haematomas, or when the liver capsules rupture causing significant haemorrhage into the abdominal cavity, hens die due to hypovolaemic shock (within minutes) or peritonitis (within 24 h).
Total WBC counts were recorded to assess the general health and the inflammatory response of hens. In this study, significant alteration of WBC counts and fibrinogen concentrations were found in hens treated with E2 when compared to controls (). This is the first demonstration of increased WBC counts and fibrinogen in oestrogenised birds. As in mammals, the elevation of these parameters in birds demonstrates increased systemic inflammation and tissue repair (Latimer & Rakich, Citation2007). Hens treated with E2 had a significant increase in leukocytes (24 h post-treatments) and WBC counts continuously increased in weeks 1, 2, and 3. At the same time, there was an elevation of plasma fibrinogen which correlated to the WBC increase, with the exception that in week 3 fibrinogen levels decreased, while WBC counts continued to be elevated; perhaps liver damage was impacting on fibrinogen synthesis in hepatocytes (Nagata et al., Citation2007; Brunt, Citation2010). Fibrinogen is an acute phase protein that circulates in the plasma at a concentration of 2–4 g/l with a half-life of approximately 4 days. The concentration increases in response to most forms of tissue injury, infection, or inflammation (Mosesson et al., Citation2001; Gruys et al., Citation2005). The ability of fibrinogen to participate in the inflammatory response depends on its specific interaction with leukocyte cell surface adhesion receptors or integrins (Mosesson et al., Citation2001; Ugarova & Yakubenko, Citation2001). Changes in markers of inflammation including leukocytes and fibrinogen are, in general, seen as a local or systemic low-grade inflammation response (Temelkova-Kurktschiev et al., Citation2002; Haukeland et al., Citation2006).
In order to fully assess the liver, responses of plasma metabolites, including CHOL, TG, TP, and AST, were measured (). The data showed that E2 induced hypercholesterolaemia and hypertriglyceridaemia, which were associated with severe impairment of liver structure such as fat accumulation, inflammation, and vacuolization ((c–f)), as described above. Plasma AST and TP were also significantly affected in E2-treated birds (especially with restricted feed intake), probably reflecting the impact of lipids on hepatocytes and hepatic protein synthesis (Limdi & Hyde, Citation2003). When a liver is partially damaged and hepatocytes are congested with fat droplets, swelling and necrosis may occur. However, the mitotic activity in the remaining cells begins as early as 12 h later, eventually restoring the liver to its normal weight (Sidorova, Citation1962; Bertalanffy et al., Citation1970; Michalopoulos, Citation2014). This remarkable capacity to regenerate after injury, and the large reserve capacity of liver tissue, make it technically difficult to detect clinical changes and diagnose liver diseases. Many previous investigators have recommended measurements of plasma enzymes to test for FLHS (Pearce, Citation1980; Walzem et al., Citation1993; Diaz et al., Citation1999). However, as these investigators have suggested, these tests are indicative of liver tissue damage, and do not specifically demonstrate the presence of liver damage due to FLHS. In this study, both GGT and AST were measured, but only AST was significantly reduced in E2-treated hens, suggesting that the situation could have been associated with a disordered metabolic state, and liver dysfunction in these birds.
To sum up, the observations of this study demonstrate that FLHS can be successfully induced by feeding mature laying hens ad libitum with a commercial layer diet and increasing circulating oestrogen concentrations by injection. It appears from using this model that an inflammatory response due to disturbed lipid metabolism could be involved in the pathogenesis of FLHS. Further studies are required to explore these observations, and explain why only some laying hens develop FLHS while all have fatty livers.
Supplemental Material
Download Zip (254.7 KB)Disclosure statement
No potential conflict of interest was reported by the authors.
Additional information
Funding
Related Research Data
References
- Balnave, D. (1971). The influence of exogenous oestrogens and the attainment of sexual maturity on fatty acid metabolism in the immature pullet. Comparative Biochemistry and Physiology Part B: Comparative Biochemistry, 40, 189–197. doi: 10.1016/0305-0491(71)90075-7
- Beaufrère, H. (2013). Atherosclerosis: comparative pathogenesis, lipoprotein metabolism, and avian and exotic companion mammal models. Journal of Exotic Pet Medicine, 22, 320–335. doi: 10.1053/j.jepm.2013.10.016
- Bertalanffy, F.D., Parrott, J.C.W. & Ozohan, M.L. (1970). Mitotic rates of regenerating liver parenchyma and DAB induced primary hepatoma. Cells Tissues Organs, 77, 216–237. doi: 10.1159/000143542
- Bickerstaffe, R. & Annison, E.F. (1970). Lipid metabolism in the perfused chicken liver. The uptake and metabolism of oleic acid, elaidic acid, cis-vaccenic acid, trans-vaccenic acid and stearic acid. Biochemical Journal, 118, 433–442. doi: 10.1042/bj1180433
- Braet, F. & Wisse, E. (2002). Structural and functional aspects of liver sinusoidal endothelial cell fenestrae: a review. Comparative Hepatology, 1, 1–17. doi: 10.1186/1476-5926-1-1
- Bragg, D.B., Sim, J.S. & Hodgson, G.C. (1973). Influence of dietary energy source on performance and fatty liver syndrome in White Leghorn laying hens. Poultry Science, 52, 736–740. doi: 10.3382/ps.0520736
- Brunt, E.M. (2010). Pathology of nonalcoholic fatty liver disease. Nature Reviews Gastroenterology & Hepatology, 7, 195–203. doi: 10.1038/nrgastro.2010.21
- Chawak, M.M., Raju, M., Rao, S.V.R., Srilatha, C. & Praharaj, N.K. (1997). Experimental induction of fatty liver haemorrhagic syndrome in layers. Indian Veterinary Journal, 74, 290–293.
- Cherian, G. & Goeger, M.P. (2004). Hepatic lipid characteristics and histopathology of laying hens fed CLA or n-3 fatty acids. Lipids, 39, 31–36. doi: 10.1007/s11745-004-1198-2
- Cherian, G., Wolfe, F.W. & Sim, J.S. (1996). Dietary oils with added tocopherols: effects on egg or tissue tocopherols, fatty acids, and oxidative stability. Poultry Science, 75, 423–431. doi: 10.3382/ps.0750423
- Couch, J.R. (1956). Fatty livers in laying hens – a condition which may occur as a result of increased strain. Feedstuffs, 28, 46–54.
- Crespo, R. & Shivaprasad, H.L. (2003). Developmental, Metabolic, and Other Noninfectious Disorders. In Y.M. Saif, H.J. Barnes, J.R. Glisson, A.M. Fadley, L.R. McDougald & D.E. Swayne (Eds.), Diseases of Poultry 11th edn (pp. 1055–1102). Ames: Iowa State Press.
- Decuypere, E. & Verstegen, M.W. (1999). Metabolic insights and nutrition of poultry. Tijdschrift voor Diergeneeskunde, 124, 47–51.
- Diaz, G.J., Squires, E.J. & Julian, R.J. (1999). The use of selected plasma enzyme activities for the diagnosis of fatty liver-hemorrhagic syndrome in laying hens. Avian Diseases, 43, 768–773. doi: 10.2307/1592746
- Etches, R.J. & Cheng, K.W. (1981). Changes in the plasma concentrations of luteinizing hormone, progesterone, oestradiol and testosterone and in the binding of follicle-stimulating hormone to the theca of follicles during the ovulation cycle of the hen (Gallus domesticus). Journal of Endocrinology, 91, 11–22. doi: 10.1677/joe.0.0910011
- Folch, J., Lees, M. & Sloane Stanley, G.H. (1957). A simple method for the isolation and purification of total lipides from animal tissues. Journal of Biological Chemistry, 226, 497–509.
- Fossum, O., Jansson, D.S., Etterlin, P.E. & Vågsholm, I. (2009). Causes of mortality in laying hens in different housing systems in 2001 to 2004. Acta Veterinaria Scandinavica, 51, 1–9. doi: 10.1186/1751-0147-51-3
- Fraser, R., Heslop, V.R., Murray, F.E. & Day, W.A. (1986). Ultrastructural studies of the portal transport of fat in chickens. British Journal of Experimental Pathology, 67, 783–791.
- Gruys, E., Toussaint, M.J., Niewold, T.A. & Koopmans, S.J. (2005). Acute phase reaction and acute phase proteins. Journal of Zhejiang University Science, 6B, 1045–1056. doi: 10.1631/jzus.2005.B1045
- Haghighi-Rad, F. & Polin, D. (1982). Lipid alleviates fatty liver hemorrhagic syndrome. Poultry Science, 61, 2465–2472. doi: 10.3382/ps.0612465
- Hanke, H., Hanke, S., Finking, G., Muhic-Lohrer, A., Mück, A.O., Schmahl, F.W., Haasis, R. & Hombach, V. (1996). Different effects of estrogen and progesterone on experimental atherosclerosis in female versus male rabbits. Quantification of Cellular Proliferation by Bromodeoxyuridine, 94, 175–181.
- Hansen, R.J. & Walzem, R.L. (1993). Avian fatty liver hemorrhagic syndrome: a comparative review. Advances in Veterinary Science and Comparative Medicine, 37, 451–468.
- Harms, R.H., Roland Sr, D.A. & Simpson, C.F. (1977). Experimentally induced “fatty liver syndrome” condition in laying hens. Poultry Science, 56, 517–520. doi: 10.3382/ps.0560517
- Haukeland, J.W., Damås, J.K., Konopski, Z., Løberg, E.M., Haaland, T., Goverud, I., Torjesen, P.A., Birkeland, K., Bjøro, K. & Aukrust, P. (2006). Systemic inflammation in nonalcoholic fatty liver disease is characterized by elevated levels of CCL2. Journal of Hepatology, 44, 1167–1174. doi: 10.1016/j.jhep.2006.02.011
- Hawkins, R.A., Heald, P.J. & Taylor, P. (1969). The uptake of (6,7-3H) 17beta-oestradiol by tissues of the domestic fowl. Acta Endocrinologica, 60, 199–209. doi: 10.1530/acta.0.0600199
- Hermier, D. (1997). Lipoprotein metabolism and fattening in poultry. The Journal of Nutrition, 127, 805s–808s. doi: 10.1093/jn/127.5.805S
- Hy-Line. (2008). Hy-Line Variety Brown Commercial Management Guide 2006–2008. West Des Moines, IA: Hy-Line International.
- Jaussi, A.W., Newcomer, W.S. & Thayer, R.H. (1962). Hyperlipemic effect of ACTH injections in the chicken. Poultry Science, 41, 528–532. doi: 10.3382/ps.0410528
- Jensen, L.S., Chang, C.H. & Maurice, D.V. (1976). Liver lipid accumulation and performance of hens as affected by cage density and initial body weight. Poultry Science, 55, 1926–1932. doi: 10.3382/ps.0551926
- Johnson, A.L. & van Tienhoven, A. (1981). Pharmacokinetics of estradiol-17 beta in the laying hen. Poultry Science, 60, 2720–2723. doi: 10.3382/ps.0602720
- Julian, R.J. (2005). Production and growth related disorders and other metabolic diseases of poultry – a review. The Veterinary Journal, 169, 350–369. doi: 10.1016/j.tvjl.2004.04.015
- Klimis-Tavantzis, D.J., Kris-Etherton, P.M. & Leach Jr, R.M. (1983). The effect of dietary manganese deficiency on cholesterol and lipid metabolism in the estrogen-treated chicken and the laying hen. The Journal of Nutrition, 113, 320–327. doi: 10.1093/jn/113.2.320
- Kovach, A.G., Szasz, E. & Pilmayer, N. (1969). Mortality of various avian and mammalian species following blood loss. Acta Physiologica Academiae Scientiarum Hungaricae, 35, 109–116.
- Latimer, K.S. & Rakich, P.M. (2007). Avian cytology. Veterinary Clinics of North America: Exotic Animal Practice, 10, 131–154.
- Lee, K., Flegal, C.J. & Wolford, J.H. (1975). Factors affecting liver fat accumulation and liver hemorrhages associated with fatty liver-hemorrhagic syndrome in laying chickens. Poultry Science, 54, 374–380. doi: 10.3382/ps.0540374
- Limdi, J.K. & Hyde, G.M. (2003). Evaluation of abnormal liver function tests. Postgraduate Medical Journal, 79, 307–312. doi: 10.1136/pmj.79.932.307
- Lumeij, J.T. (2008). Avian Clinical Biochemistry. In J.J. Kaneko, J.W. Harvey, & M.L. Bruss (Eds.), Clinical Biochemistry of Domestic Animals 6th edn (pp. 839–872). San Diego: Academic Press.
- Mete, A., Giannitti, F., Barr, B., Woods, L. & Anderson, M. (2013). Causes of mortality in backyard chickens in northern California: 2007-2011. Avian Diseases, 57, 311–315. doi: 10.1637/10382-092312-Case.1
- Michalopoulos, G.K. (2014). Advances in liver regeneration. Expert Review of Gastroenterology & Hepatology, 8, 897–907. doi: 10.1586/17474124.2014.934358
- Mosesson, M.W., Siebenlist, K.R. & Meh, D.A. (2001). The structure and biological features of fibrinogen and fibrin. Annals of the New York Academy of Sciences, 936, 11–30. doi: 10.1111/j.1749-6632.2001.tb03491.x
- Nagata, K., Suzuki, H. & Sakaguchi, S. (2007). Common pathogenic mechanism in development progression of liver injury caused by non-alcoholic or alcoholic steatohepatitis. The Journal of Toxicological Sciences, 32, 453–468. doi: 10.2131/jts.32.453
- Pearce, J. (1980). The response of liver enzymes to feed restriction and subsequent ad lib. feeding in the laying hen. British Journal of Nutrition, 44, 81–87. doi: 10.1079/BJN19800012
- Pearson, A.W. & Butler, E.J. (1978a). Environmental temperature as a factor in the aetiology of fatty liver-haemorrhagic syndrome in the fowl. Research in Veterinary Science, 25, 133–138. doi: 10.1016/S0034-5288(18)32967-9
- Pearson, A.W. & Butler, E.J. (1978b). The oestrogenised chick as an experimental model for fatty liver-haemorrhagic syndrome in the fowl. Research in Veterinary Science, 24, 82–86. doi: 10.1016/S0034-5288(18)33103-5
- Pearson, A.W. & Butler, E.J. (1978c). Pathological and biochemical observations on subclinical cases of fatty liver-haemorrhagic syndrome in the fowl. Research in Veterinary Science, 24, 65–71. doi: 10.1016/S0034-5288(18)33100-X
- Peckham, M.C. (1984). Diseases of Caged Layers. In M.S. Hofstad. Diseases of Poultry 8th edn (pp. 774–775). Ames: Iowa State University Press.
- Petzinger, C. & Bauer, J.E. (2013). Dietary considerations for atherosclerosis in common companion avian species. Journal of Exotic Pet Medicine, 22, 358–365. doi: 10.1053/j.jepm.2013.10.013
- Polin, D. & Wolford, J.H. (1976). Various types of diets, sources of energy, and positive energy balance in the induction of fatty liver hemorrhagic syndrome. Poultry Science, 55, 325–334. doi: 10.3382/ps.0550325
- Polin, D. & Wolford, J.H. (1977). Role of estrogen as a cause of fatty liver hemorrhagic syndrome. The Journal of Nutrition, 107, 873–886. doi: 10.1093/jn/107.5.873
- Ringer, R.K. & Sheppard, C.C. (1963). Report of fatty liver syndrome in a Michigan caged layer operation. Quarterly Bulletin, 45, 426–427. Michigan Agricultural Experimental Station
- SAS Institute (2001). SAS/STAT Guide for Personal Computers, Version 8. Cary, NC: SAS Institute, Inc.
- Schalm, O.W. (1980). Manual of Feline and Canine Hematology. In Veterinary Practice (p. 152). Santa Barbara, CA: Veterinary Practice Pub. Co.
- Scheele, C.W. (1997). Pathological changes in metabolism of poultry related to increasing production levels. Veterinary Quarterly, 19, 127–130. doi: 10.1080/01652176.1997.9694756
- Shini, A., Shini, S. & Bryden, W.L. (2019). Fatty liver haemorrhagic syndrome occurrence in laying hens: impact of production system. Avian Pathology, 48, 25–34. doi: 10.1080/03079457.2018.1538550
- Shini, S. & Bryden, W.L. (2009). Occurrence and Control of Fatty Liver Haemorrhagic Syndrome (FLHS) in Caged Hens. In AECL Publication (pp. 44–48). Sydney: Australian Egg Corporation.
- Shini, S., Shini, A. & Bryden, W.L. (Under review). Unravelling fatty liver haemorrhagic syndrome: 2. Inflammation and pathophysiology. Avian Pathology, Submitted.
- Shini, S., Stewart, G., Shini, A. & Bryden, W. (2006). Mortality Rates and Causes of Death in Laying Hens Kept in Cage and Alternative Housing Systems. In D.G. Martin. 12th European Poultry Conference (p. 601). Verona: World Poultry Science Association.
- Sidorova, V.F. (1962). Liver regeneration in birds. Bulletin of Experimental Biology and Medicine, 52, 1426–1429. doi: 10.1007/BF00785312
- Squires, E.J. & Leeson, S. (1988). Aetiology of fatty liver syndrome in laying hens. British Veterinary Journal, 144, 602–609. doi: 10.1016/0007-1935(88)90031-0
- Stake, P.E., Fredrickson, T.N. & Bourdeau, C.A. (1981). Induction of fatty liver-hemorrhagic syndrome in laying hens by exogenous β-estradiol. Avian Diseases, 25, 410–422. doi: 10.2307/1589933
- Sturkie, P.D. & Griminger, P. (1986). Body Fluids: Blood. In P.D. Sturkie. Avian Physiology (pp. 102–129). New York: Springer.
- Sturkie, P.D. (1986). Heart and Circulation: Anatomy, Hemodynamics, Blood Pressure, Blood Flow. In P.D. Sturkie. Avian Physiology (pp. 130–166). New York, NY: Springer.
- Tanaka, M., Itoh, T., Tanimizu, N. & Miyajima, A. (2011). Liver stem/progenitor cells: their characteristics and regulatory mechanisms. Journal of Biochemistry, 149, 231–239. doi: 10.1093/jb/mvr001
- Temelkova-Kurktschiev, T., Koehler, C., Henkel, E. & Hanefeld, M. (2002). Leukocyte count and fibrinogen are associated with carotid and femoral intima-media thickness in a risk population for diabetes. Cardiovascular Research, 56, 277–283. doi: 10.1016/S0008-6363(02)00547-3
- Trott, K.A., Giannitti, F., Rimoldi, G., Hill, A., Woods, L., Barr, B., Anderson, M. & Mete, A. (2014). Fatty liver hemorrhagic syndrome in the backyard chicken. Veterinary Pathology, 51, 787–795. doi: 10.1177/0300985813503569
- Tsang, C.P. & Grunder, A.A. (1984). Production, clearance rates and metabolic fate of estradiol-17 beta in the plasma of the laying hen. Steroids, 43, 71–84. doi: 10.1016/0039-128X(84)90059-X
- Ugarova, T.P. & Yakubenko, V.P. (2001). Recognition of fibrinogen by leukocyte integrins. Annals of the New York Academy of Sciences, 936, 368–385. doi: 10.1111/j.1749-6632.2001.tb03523.x
- Walzem, R.L., Hansen, R.J., Williams, D.L. & Hamilton, R.L. (1999). Estrogen induction of VLDLy assembly in egg-laying hens. The Journal of Nutrition, 129, 467s–472s. doi: 10.1093/jn/129.2.467S
- Walzem, R.L., Simon, C., Morishita, T., Lowenstine, L. & Hansen, R.J. (1993). Fatty liver hemorrhagic syndrome in hens overfed a purified diet. Selected enzyme activities and liver histology in relation to liver hemorrhage and reproductive performance. Poultry Science, 72, 1479–1491. doi: 10.3382/ps.0721479
- Weitzenburger, D., Vits, A., Hamann, H. & Distl, O. (2005). Effect of furnished small group housing systems and furnished cages on mortality and causes of death in two layer strains. British Poultry Science, 46, 553–559. doi: 10.1080/00071660500303206
- Wisse, E., Braet, F., Luo, D., De Zanger, R., Jans, D., Crabbe, E. & Vermoesen A.N. (1996). Structure and function of sinusoidal lining cells in the liver. Toxicologic Pathology, 24, 100–111. doi: 10.1177/019262339602400114